Introduction
Nitric oxide (NO) is a ubiquitous endogenous signaling molecule involved in the regulation of a number of developmental, physiological, and biochemical processes associated with plant metabolism (Asgher et al.,2016). NO is a free radical of particular interest in plant science, on account of its unique properties, being small in size, short-lived, lacking a charge, and having high diffusibility through biological membranes, and its multifunctional roles in plants under both normal and stress conditions (Siddiqui et al.,2010).
The distinctive reactivity properties of NO, and its eventual dual action (i.e., beneficial or harmful) in biological cells, can be attributed to the presence of an unpaired electron within the π orbital of the nitrogen atom of the NO molecule, together with NO concentration and site of production. Owing to its specific chemical characteristics and biological effects, NO can be considered as either a stress-inducing (Gould et al.,2003) or protective agent (Bai et al.,2015; Hsu & Kao,2004).
NO has been found to play a vital role at multiple stages in plant growth and development, from germination to flowering, the ripening of fruit, apoptosis induction, and senescence, as well as in plant responses to biotic and abiotic stressors (Popova & Tuan,2010). Increasing evidence indicates that NO is a key component in the signaling networks controlling numerous physiological and metabolic processes and the acclimation to environmental stresses (Fatma et al.,2016; Procházková & Wilhelmová,2011; Simontacchi et al.,2013).
Salinity causes an accumulation of Na+ and Cl− in the cytosol, which can be fatal to cells. An excess of Na+ leads to ion-specific stresses, resulting in a change in the K++/Na ratio. External sources of Na+ can adversely affect intracellular K+ influx, and high levels of Na+ (greater than 100 mM) are toxic to cell metabolism and can suppress the activity of a large number of key enzymes, having detrimental effects with respect to cell division and expansion, causing membrane disruption, and promoting osmotic imbalance, which collectively contribute to growth inhibition. Moreover, sodium ions can also reduce photosynthesis and increase the production of reactive oxygen species (ROS) (Hasegawa et al.,2000; Khan et al.,2010; Marschner,2002; Siddiqui et al.,2008).
Rapid industrialization is one of the main causes of environmental pollution, caused by the release of significantly large amounts of toxic metals, including nickel (Ni) (Rizwan et al.,2017). Ni is released into the environment from various anthropogenic activities, including metal mining and smelting, the burning of fossil fuels, vehicle emissions, the disposal of household and industrial wastes, and the application of fertilizers (Chen et al.,2009). The amount of Ni in normal soils ranges from 10 to 1,000 mg kg−1, but in high concentrations can cause substantial toxic effects on plants, including the inhibition of seed germination, reduction in plant growth and yield (Shukla & Gopal,2009), induction of leaf chlorosis, necrosis, and wilting (Mosa et al.,2016), and peroxidation of lipids (Rizwan et al.,2017).
Both salt stress and Ni toxicity are known to increase the amounts of ROS produced by disrupting redox homeostasis in plant cells (Gajewska & Skłodowska,2008; Israr et al.,2011), thereby causing a deterioration of essential cellular constituents, including membrane lipids, pigments, DNA, and proteins (Sharma & Dubey,2007). However, plants have evolved complex antioxidant defense systems to protect against ROS-induced damage. The antioxidant defense system of plants comprises antioxidant enzymes, such as superoxide dismutase (SOD), catalase (CAT), and peroxidase (POX), and nonenzymatic antioxidants, such as glutathione (GSH) and ascorbate (AsA). These antioxidant compounds act in concert to detoxify the elevated levels of ROS produced under stress conditions (Verma & Dubey,2003).
Exogenous application of sodium nitroprusside (SNP), as an NO donor, has been demonstrated to significantly mitigate the oxidative damage attributable to salinity in the seedlings of rice (Oryza sativa L.) (Uchida et al.,2002) and cucumber (Cucumis sativus L.) (Fan et al.,2007; Yu-Qing et al.,2007) and enhance the seed germination and growth of pakchoi (Brassica chinensis L.) (Ren et al.,2020), and has also been shown to increase the dry weight of maize (Zea mays L.) and Kosteletzkya virginica seedlings (Guo et al.,2009; Y. Zhang et al.,2006) under salt stress. Similar results have been obtained for lupine plants, in which SNP treatments have been found to markedly alleviate the inhibitory effects of Ni stress on plant growth and photosynthetic pigment contents (Hashem et al.,2018). These studies accordingly provide substantial evidence to indicate that developing appropriate NO-associated measures may be an effective approach for enhancing the productivity crops exposed to environmental stress. The objectives of the present study were twofold. Firstly, we sought to evaluate the potential of applying SNP at the vegetative stage to alleviate the harmful effects of salinity and Ni toxicity on lupine yield, and, secondly, we aimed to examine the changes in antioxidant enzyme activities in relation to the redox status of lupine plants treated with SNP, salt, and Ni sulfate.
Material and Methods
Plant Material
Lupinus albus subsp. termis (Forssk.) Ponert seeds were obtained from the Agriculture Research Center, Ministry of Agriculture, Giza, Egypt.
Growth Conditions
Lupinus albus seeds were sterilized for 15 min using 2.5% sodium hypochlorite, and thereafter washed thoroughly with distilled water. Seeds were sown in plastic pots (22 cm diameter and 20 cm high) filled with homogenous soil (clay:sand, 2:1 w/w). The plants were irrigated to 80% saturation capacity with tap water. Three weeks after sowing, the pots were divided into three groups. Pots in the first group were sprayed with tap water (control), whereas those in the second and third groups were sprayed twice (at 23 and 30 days after sowing) with 0.4 and 0.6 mM SNP (as an NO donor), respectively. The concentrations of SNP were selected based on those recommended by Esmail et al. (2018). The plants of the control group and each of the two SNP treatments were divided into five subgroups, each of which received one of the following treatments [water (serving as a control), 75 or 150 mM NaCl, and 100 or 150 mM NiSO4]. For each treatment, shoot and root samples were collected from 2-month-old plants growing in five pots to determine total phenol and flavonoid contents and antioxidant enzyme activities [superoxide dismutase (SOD), peroxidase (POX), ascorbate peroxidase (APX), catalase (CAT), and glutathione transferase (GST)]. The remainder of the plants were left to grow to the fruiting stage (5-month-old plants) for measurement of growth parameters, including shoot and root lengths and weights. After thoroughly drying the plants, pods were collected to determine yield characteristics [number of pods per plant, pod length, pod diameter, pod weight, number of seeds per pod, number of seeds per plant, weight of seeds per plant, and weight of 1,000 seeds (seed index)]. Data are presented as the means of five replicates.
Methods
Extraction and Determination of Antioxidant Enzyme Activities
Enzyme Extraction
Enzyme extraction was performed as described by Mukherjee and Choudhurri (1983). Fresh tissue (2 g) was frozen in liquid nitrogen and finely ground using a pestle and chilled mortar. Enzymes were extracted in 100 mM phosphate buffer (KH2PO4/K2HPO4) pH 6.8, and the homogenates were centrifuged at 44,800 rcf for 20 min. The resulting supernatants were made up to a known volume using the same buffer, and these enzyme extracts were used for assaying the activities of antioxidant enzymes.
Determination of Superoxide Dismutase (SOD) Activity
The activity of SOD (EC 1.15.1.1) was determined by measuring inhibition of the auto-oxidation of pyrogallol, as described by Marklund and Marklund (1974). Activities were assayed using 10-mL reaction mixtures containing 3.6 mL of distilled water, 0.1 mL of the enzyme extract, 5.5 mL of 50 mM phosphate buffer (pH 7.8), and 0.8 mL of 3 mM pyrogallol (dissolved in 10 mM HCl). The rate of pyrogallol reduction was measured at 325 nm using a UV-spectrophotometer. One unit of enzyme activity was defined as the amount of enzyme that resulted in 50% inhibition of the auto-oxidation rate of pyrogallol at 25 °C, and values are presented as units/mg protein.
Determination of Ascorbate Peroxidase (APX) Activity
The activity of APX (EC 1.11.1.11) was determined according to Koricheva et al. (1997) with a few modifications. The reaction mixture (10 mL) contained 5.5 mL of 50 mM phosphate buffer (pH 7.0), 0.5 mL of enzyme extract, 1 mL of 20 mM H2O2, 1 mL of 20 mM EDTA, and 2 mL of 20 mM ascorbic acid. The decrease in absorbance concomitant with ascorbate oxidization was monitored at 290 nm using a UV-spectrophotometer (extinction coefficient of 2.8 mM−1 cm−1). The enzyme activity is expressed as µmol of ascorbate oxidized g−1 fresh weight min−1.
Determination of Catalase (CAT) Activity
The activity of CAT (EC 1.11.1.6) was assayed following the method of Kar and Mishra (1976). The assay mixture (5 mL) used to determine catalase activity comprised 300 µM of phosphate buffer (pH 6.8), 100 µM H2O2, and 1 mL of enzyme extract. After incubation at 25 °C for 1 min, the reaction was stopped by adding 10 mL of 2% H2SO4 (v/v), and the residual H2O2 was titrated against 0.01 N KMnO4 until a faint purple color persisted for at least 15 s. Catalase activity is expressed as µmol H2O2 decomposed g−1 fresh weight min−1.
Determination of Peroxidase (POX) Activity
The activity of POX (EC 1.11.1.7) was assayed using the method of Kar and Mishra (1976) with slight modifications. The assay mixture (5 mL) contained 300 µM phosphate buffer (pH 6.8), 50 µM catechol, 50 µM H2O2, and 1 mL of crude enzyme extract. After incubation at 25 °C for 5 min, the reaction was stopped by adding 1 mL of 10% H2SO4. The optical density of the reaction mixture was recorded at 340 nm, and the activity is expressed as the change in the optical density g−1 fresh weight min−1.
Determination of Glutathione-S-Transferase (GST) Activity
The activity of GST (EC 2.5.1.13) was measured by observing the conjugation of 1-chloro, 2,4-dinitrobenzene (CDNB) with reduced GSH (Vontas et al.,2000), which is indicated by an increase in absorbance at 340 nm. The reaction mixture contained 980 µL of PBS pH 6.5, 10 µL of 100 mM CDNB, and 10 µL of 100 mM glutathione. GST activity was calculated using the extinction coefficient of CDNB (0.0096 µM−1 cm−1) and is expressed as mmol g−1 fresh weight.
Determination of Total Phenolics
The total phenolic content of lupines was determined using Folin–Ciocalteu reagent (Makkar et al.,1993). Absorbance was measured at 725 nm against a reagent blank. A calibration curve was plotted by mixing 1-mL aliquots of 10, 20, 30, 40, 50, 60, 70, 80, 90, and 100 μg/mL gallic acid solutions with 0.5 mL of Folin–Ciocalteu reagent and 2.5 mL of sodium carbonate solution. The results are expressed in terms of gallic acid (GA) equivalents g−1 fresh weight.
Determination of Flavonoids
The total flavonoid content of crude plant extracts was determined using the aluminum chloride colorimetric method (Chang et al.,2002). Aliquots (200 µL) of the extract were made up to a volume of 1.8 mL with methanol, to which 0.1 mL of 10% aluminum chloride, 0.1 mL of 1 M potassium acetate, and 2.8 mL of distilled water were added to make up to a final volume of 5 mL. After 30 min, the absorbance of the reaction mixture was measured at 415 nm. A calibration curve for quercetin was constructed using different concentrations of methanol solutions of quercetin (20, 30, 40, 50, 60, 70, and 80 µg mL−1). Total flavonoid content is expressed as µg quercetin equivalents (QE) g−1 fresh weight.
Statistical Analysis
Mean values were calculated from measurements of five replicates and standard deviations of the means were calculated using an independent samples t test (SPSS ver. 17.0), to test for significant differences between means, based on two-tailed p values (Snedecor & Cochran,1980).
Results
Growth and Yield Characteristics
Compared with untreated control plants, lupines treated with 0.4 mM SNP showed an increase in growth and yield. Salinity and Ni toxicity significantly reduced all assessed growth and yield parameters (Table 1 and Table 2). The inhibitory effects of both salt and Ni on lupine growth and yield was found to be concentration dependent, although the toxic effects of high Ni concentration (150 mM) were notably more pronounced than those of the same concentration of salt. Compared with untreated controls, the values of shoot and root lengths, weights of shoots and roots, number of pods/plant, pod length, number of seeds/plant, weight of seeds/plant, and seeds index were calculated as 50.5%, 46.59%, 29.97%, 26.22%, 39.9%, 49.4%, 75.1%, 31.2%, 6.4%, and 17.9%, respectively, in response to 150 mM Ni sulfate treatment, and 81%, 92.1%, 53.2%, 33.33%, 69.9%, 49.7%, 63.4%, 46.9%, 20.7%, and 48.1%, respectively, in response to 150 mM NaCl. The yield characteristics of lupine plants treated with 0.4 mM SNP and NaCl or NiSO4 were found to be lower than those treated with the same concentration of SNP alone and higher than those treated with the corresponding concentrations of NaCl and NiSO4. Exogenous application of 0.4 mM SNP at the vegetative stage was found to completely alleviate the inhibitory effects of NaCl and NiSO4 on lupine growth and yield up to a concentration 150 mM.
Table 1
Effect of sodium nitroprusside (SNP) on growth characteristics of Lupinus albus subsp. termis (Forssk.) Ponert, under sodium chloride (0, 75, and 150 mM) and nickel sulfate (0, 100, and 150 mM) stress. Data are mean ±SE (standard error) of five replicates.
[i] Values with letters are significantly different from the control (tap water). Letter “a” at p < 0.05 (significant), “b” at p < 0.01 (highly significant), “c” at p < 0.001 (extremely significant), and no letter = nonsignificant. Values with asterisks are significantly different from the SNP control (0.4 mM, 0.6 mM). Asterisks * at p < 0.05 (significant), ** at p < 0.01 (highly significant), *** at p < 0.001 (extremely significant), and no asterisks = nonsignificant.
Table 2
Effect of sodium nitroprusside (SNP) on yield of Lupinus albus subsp. termis (Forssk.) Ponert, under sodium chloride (0, 75, and 150 mM) and nickel sulfate (0, 100, and 150 mM) stress. Data are mean ±SE (standard error) of five replicates.
[i] Values with letters are significantly different from the control (tap water). Letter “a” at p < 0.05 (significant), “b” at p < 0.01 (highly significant), “c” at p < 0.001 (extremely significant), and no letter = nonsignificant. Values with asterisks are significantly different from SNP control (0.4 mM, 0.6 mM). Asterisks * at p < 0.05 (significant), ** at p < 0.01 (highly significant), *** at p < 0.001 (extremely significant), and no asterisks = nonsignificant.
Antioxidant Enzyme Activities
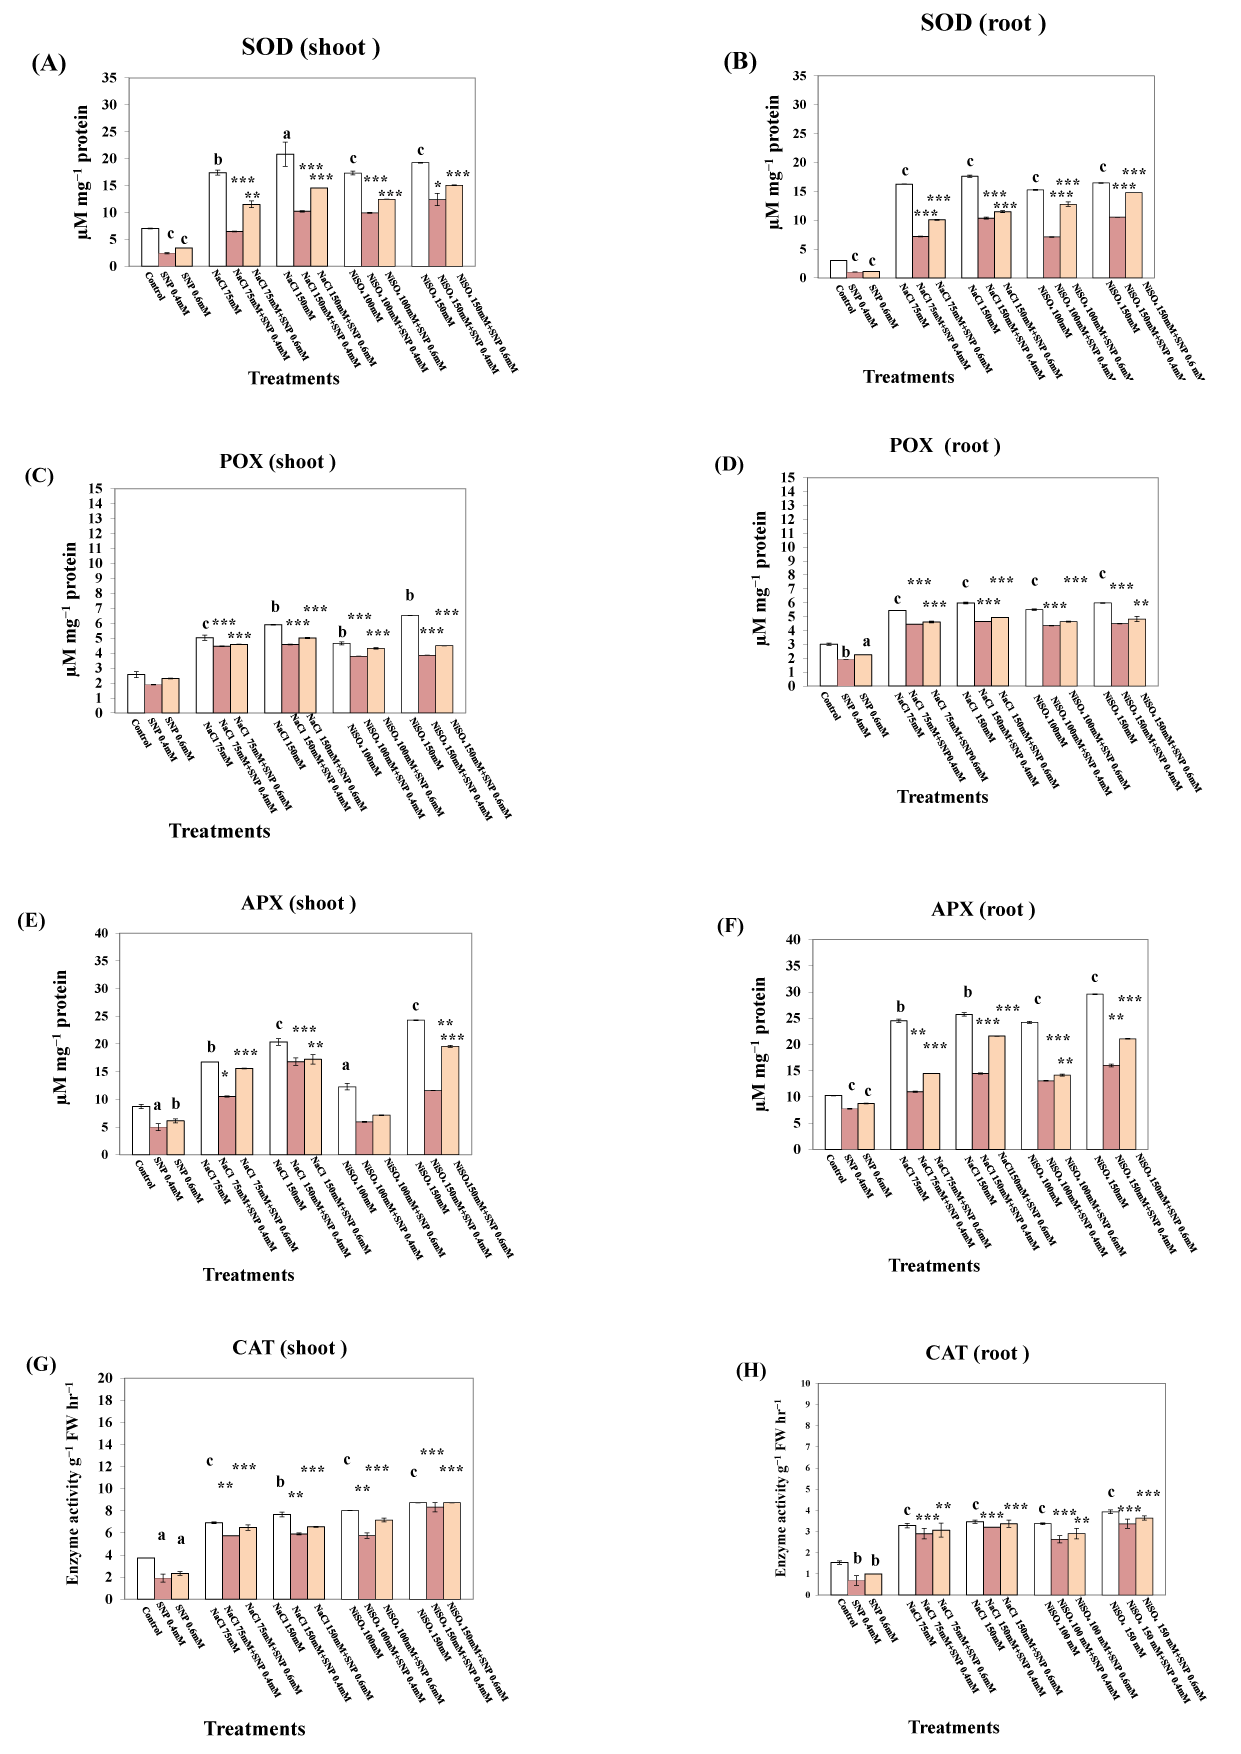
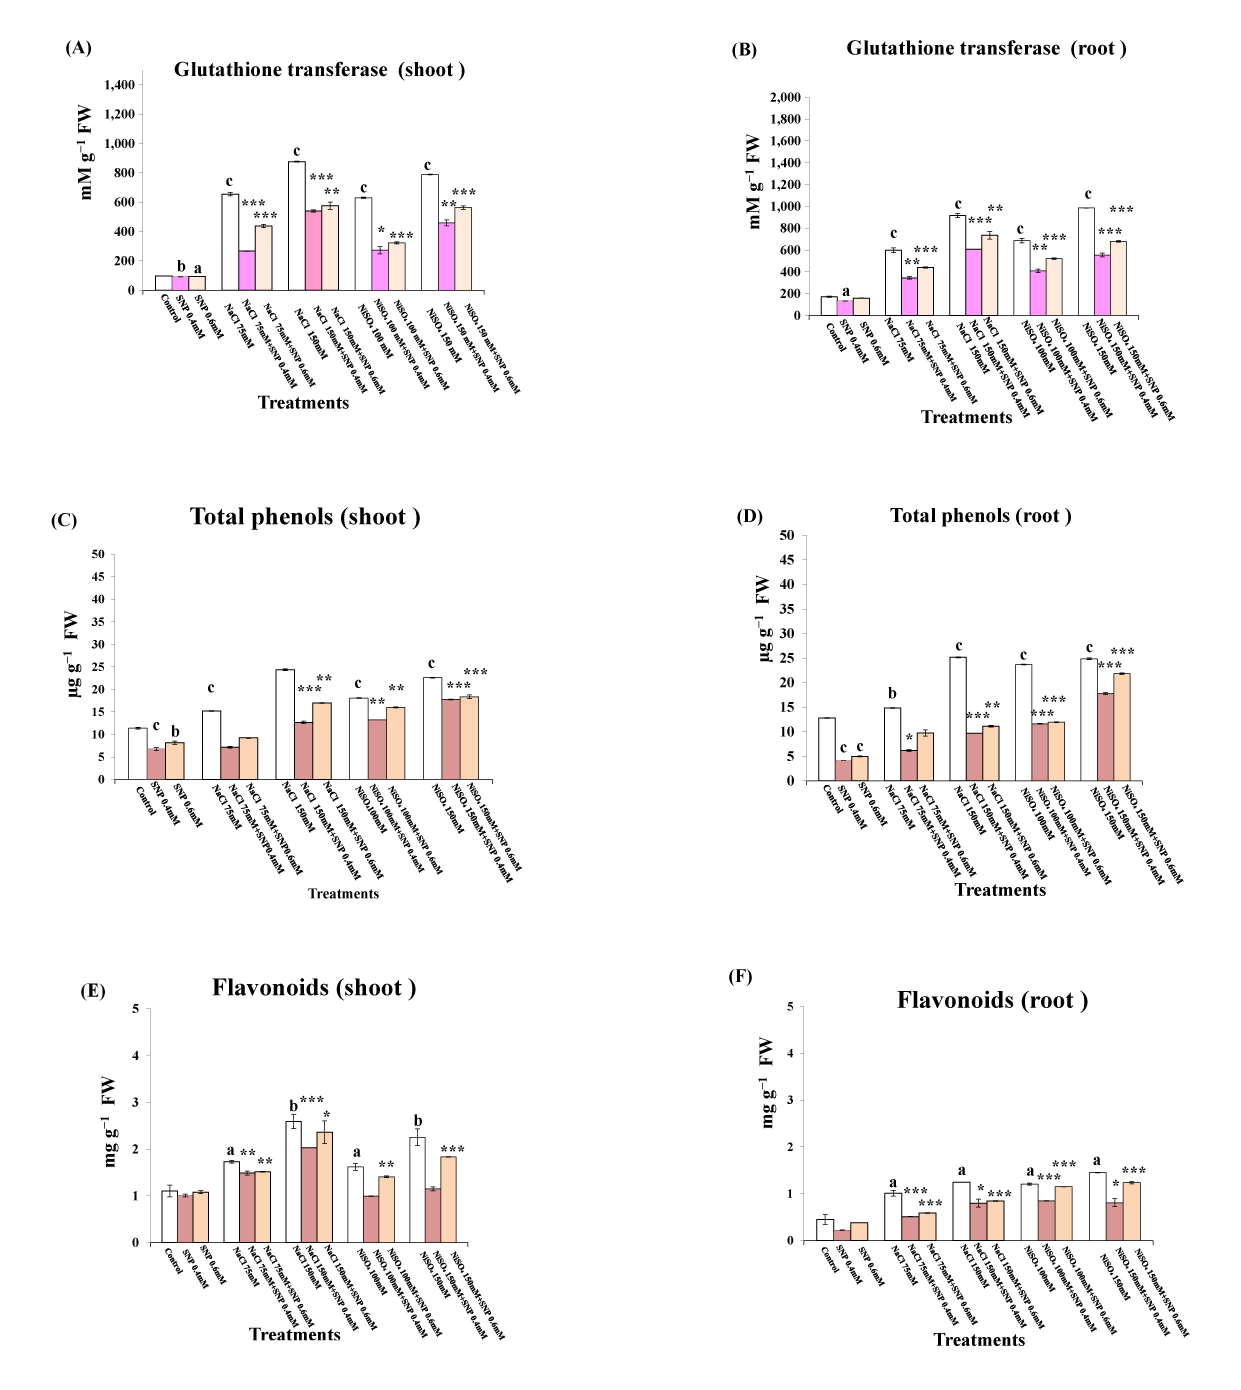
Data shown in Figure 1A–H and Figure 2A,B indicate that SNP treatment significantly reduced the activities of all assessed antioxidants enzymes in both the shoots and roots of lupine plants. In contrast, the activities of antioxidative enzymes were significantly increased in the roots and shoots of lupine plants subjected to salt or Ni stress. The highest activity of SOD (196.58%) was detected in the shoots of plants treated with 150 mM NaCl (Figure 1A), whereas treatment with 150 mM NiSO4 caused increases of 153.70%, 178.87%, 134.32%, and 708.54% in the activities of POX, APX, CAT, and GST, respectively, compared with the untreated control plants (Figure 1C,E,G and Figure 2A). Similar effects detected in roots, in which the maximum activity of SOD (487%) was detected in plants treated with 150 mM NaCl (Figure 1B), whereas maximum activities of 187.13%, 156.66%, and 471.14% were detected for APX, CAT, and GST, respectively, compared with control plants, in response to treatment with 150 mM NiSO4 (Figure 1D,F,H and Figure 2B). Treatment with a combination of 0.4 mM SNP and NaCl or NiSO4 reduced the activities in both the shoots and roots of lupine plants to values below those detected in response to salinity or NiSO4 alone. However, the activities of all assessed antioxidative enzymes in plants treated with a combination of 0.6 mM SNP and NaCl or NiSO4 were found to be higher than those in plants treated with combinations of 0.4 mM SNP and NaCl or NiSO4.
Figure 1
Effect of sodium nitroprusside (SNP) (as nitric oxide donor) on superoxidedismutase, peroxidase, ascorbate peroxidase, and catalase activity of Lupinus albus subsp. termis (Forssk.) Ponert, under sodium chloride (0 ,75, and 150 mM) and nickel sulphate (0, 100, and 150 mM) stress. Data are mean ±SE (standard error) of five replicates. Values with letters are significantly different from the control (tap water). Letter “a” at p < 0.05 (significant), “b” at p < 0.01 (highly significant), “c” at p < 0.001 (extremely significant), and no letter = nonsignificant. Values with asterisks are significantly different from the SNP control (0.4 mM, 0.6 mM). Asterisks * at p < 0.05 (significant), ** at p < 0.01 (highly significant), *** at p < 0.001 (extremely significant), and no asterisks = nonsignificant.
Total Phenols and Flavonoids
The data presented in Figure 2C–F indicate that there were significant reductions in the total phenol and flavonoid contents in lupine shoots and roots in response to SNP treatment, whereas contents were significantly increased in response to application of all the assessed concentrations of NaCl and NiSO4. The lowest amounts of total phenols and flavonoids were detected in plants treated with 0.4 mM SNP, followed by those treated with 0.6 mM, calculated as 59.5% and 32.5% for total phenols (Figure 2C,D) and 91.5% and 49.5% for total flavonoids (Figure 2E,F) in the shoots and roots, respectively, compared with control plants. In contrast, the highest total phenol content and total flavonoid content in shoots and roots were detected in plants treated with the highest concentration of NaCl (213.7% and 198.7% for total phenols in shoots and roots and 234.5% and 277.6% for total flavonoids in shoots and roots, respectively, compared with the untreated control values). However, these values did not differ significantly from those detected in plants treated with 150 mm NiSO4. In lupine plants grown under either Ni or salt stress, treatment with SNP significantly reduced the amounts of both total phenols and flavonoids.
Figure 2
Effect of sodium nitroprusside (SNP) (as nitric oxide donor) on glutathione transferase activity, total phenolics and flavonoids contents of Lupinus albus subsp. termis (Forssk.) Ponert, under sodium chloride (0, 75, and 150 mM) and Ni stress (0, 100, and 150 mM). The results of total phenolics and flavonoids are expressed in µg g−1 fresh weight. Data are mean ±SE (standard error) offive replicates. Values with letters are significantly different from the control (tap water). Letter “a” at p < 0.05 (significant), “b” at p < 0.01 (highly significant), “c” at p < 0.001 (extremely significant), and no letter = nonsignificant. Values with asterisks are significantly different from the SNP control (0.4 mM, 0.6 mM). Asterisks * at p < 0.05 (significant), ** at p < 0.01 (highly significant), *** at p < 0.001 (extremely significant), and no asterisks = nonsignificant.
Discussion
Growth and Yield Characteristics
The results shown in Table 1 and Table 2 clearly reveal that treatments with 75 and 150 mM NaCl or 100 mM and 150 mM NiSO4 caused a significant reduction in all assessed yield parameters (No. of pods/plant, pod length, No. of seeds/plant, weight of seeds/plant, weight of 1,000 seeds, shoot and root lengths, and shoot and root weights) of lupine plants. The reduction in yield and its components in response to salinity could be attributed to low production and growth, senescence, and physiologically less active green foliage, causing a reduction in photosynthetic rate (Hasanuzzaman et al.,2009). Hasanuzzaman et al. (2013) have reported a reduction in the grain yield of rice varieties due to salt stress (200 mM NaCl), whereas the salt-tolerant sugar beet (Beta vulgaris L.) showed a reduction of only 20% in dry weight, and the moderately tolerant cotton (Gossypium hirsutum L.) showed a 60% reduction. Salt concentrations at these levels would, however, be sufficient to kill sensitive species such as soybean (Glycine max L.). In contrast, a halophyte such as Suaeda maritima L. shows optimal growth at salt concentrations in this range. According to Shanker et al. (2005), biomass production and yield are affected by heavy metal stress in many plants, as has been demonstrated in rice plants, the biomass production of which is reduced by chromium toxicity (Panda,2007).
In the present study, we observed significant increases in the yield characteristics of lupine plants in response to application SNP to plants subjected to salt or Ni stress, compared with those of untreated plants grown under the same stress condition. We found that application of 0.4 mM of SNP resulted in a compete alleviation of the inhibitory effect of NaCl and NiSO4 on lupine growth and yield. Similar results have been obtained by X. W. Zhang et al. (2014), who found that a foliar spray of SNP at 1.0 mmol L−1 significantly enhanced peanut growth, pod yield, and quality, whereas Xu et al. (2014) demonstrated that exogenously applied SNP alleviated Cd toxicity and improved the yield of lettuce (Lactuca sativa L.). These effects of SNP could be attributed to the role of NO in modulating Ni acquisition in lupine plants grown at supra-optimum toxic Ni concentrations (Hashem et al.,2018). A peculiar feature of the NO mode of action is its ability to directly alter proteins through covalent posttranslational modifications (PTMs), NO-dependent PTMs have been found to be involved in ROS regulation and cellular metabolic pathways such as photorespiration (Cui et al.,2018), and Gzyl et al. (2016) have reported that almost half of the nitrated proteins they identified were correlated with proteolysis, a highly important process in plant responses to heavy metal stress. In addition, NO interaction with different signaling pathways in the cell such as those associated with hormones, Ca, and mitogen-activated protein kinases, and diverse transcriptional factors have been proven using transcriptomic analyses (Terrón-Camero et al.,2019).
Antioxidant Enzymes
Under stress conditions, plants produce excessive amounts of ROS, and also convert free-oxygen radicals into less harmful forms such as H2O2, via the activities SOD and CAT enzymes, to prevent oxidative damage (Sharma et al.,2012). Detoxification is mediated via the ascorbate–glutathione cycle, based on the oxidation reduction potentials of APX, glutathione reductase (GR), and GST enzymes (Shim et al.,2003). In the present study, we observed increases in the activities of SOD, CAT, APX, and GST in response to different levels of salinity and Ni toxicity, whereas significant reductions in the activities of these enzymes were detected when SNP was applied at concentrations of 0.4 or 0.6 mM to the stressed plants (Figure 1A–H and Figure 2A,B). Moreover, reductions in activity were more pronounced in response to treatment with 0.4 mM SNP. Compared with plants subjected to either salt or Ni stress, we found that Ni has a greater stimulatory effect on most of the assessed antioxidant enzymes than the same concentration of NaCl.
Ahmad et al. (2016) demonstrated that antioxidant enzyme activities were significantly increased in response to salinity, with or without exogenous application of NO. In contrast to the findings of the present study, they found that exogenous application of NO to salt-treated plants had an additive effect on the activities of antioxidant enzymes, whereas compared with the 0.0 mM NaCl + 0.0 µM SNP (control) treatment, no significant change was observed in the activities of antioxidant enzymes in response to the 0.0 mM NaCl + 50 µM SNP treatment. Gapińska et al. (2008) have also reported increases in the GST activities of tomato (Lycopersicon esculentum L.) plants under salt stress, whereas Hasanuzzaman et al. (2011), who examined the effects of salt stress on wheat (Triticum aestivum L.), detected an increase in GST activity in response to pretreatments with an NO-releasing substance (SNP). Furthermore, improvements in wheat seed germination and alleviation of the oxidative stress induced by Cu toxicity have been observed in response to NO pretreatment, which were attributed to due to increases in the activities of SOD and CAT and reductions in the activity of lipoxygenase and synthesis of malondialdehyde (MDA) (Hu et al.,2007).
It would appear most likely that the effects of NO are mediated via modulation of the activities of antioxidant enzymes (CAT, POD, and APX) involved in H2O2 detoxification and in the maintenance of cellular redox couples (GR) and the contents of molecular antioxidants, particularly nonprotein thiol, ascorbate, and their redox status (Tewari et al.,2008). NO has been shown to protect plants against Al3+-induced oxidative stress, and enhancement of root elongation has been found to be correlated with lower levels of accumulated Al3+ in Cassia tora L. root apices (Wang & Yang,2005). Moreover, SNP-exposed wheat plants have been found to have elevated SOD, APX, and CAT activities and protein contents, whereas reduced amounts of H2O2 and MDA have been detected in Chlamydomonas reinhardtii Dangeard under Al3+ stress compared with untreated controls (L. P. Zhang et al.,2008).
The decline in antioxidant enzyme activities in response to SNP treatment observed in the present could be attributed to the fact that NO interacts rapidly with ROS, giving rise to a number of reactive nitrogen species (RNS), such as NO• and its derivative, peroxynitrite ONOO−, and nitrogen dioxide (NO2), which are degraded to nitrite (a precursor of NO) and nitrate. In this regard, it has been suggested that NO might play an antioxidative role in response to different stress conditions (Beligni & Lamattina,1999). Modulation of superoxide formation (Caro & Puntarulo,1998) and inhibition of lipid peroxidation (Boveris et al.,2000) by NO also illustrates its power as an antioxidant. In this respect, He et al. (2019) found that SNP markedly suppresses the production of O2•− and H2O2 by mitochondria, whereas Al stress promotes an increase in MDA accumulation and H2O2 production, which is related to an increase in the SOD/APX ratio. The reaction of NO with ROS could serve to alleviate the damage caused to membranes and maintain the cellular redox status under stress conditions (Sheokand et al.,2010). Observed differences in the regulation of antioxidant enzymes in response to NO supplementation could conceivably be attributed to differences in the NO donor and/or concentration used, which warrants further investigations.
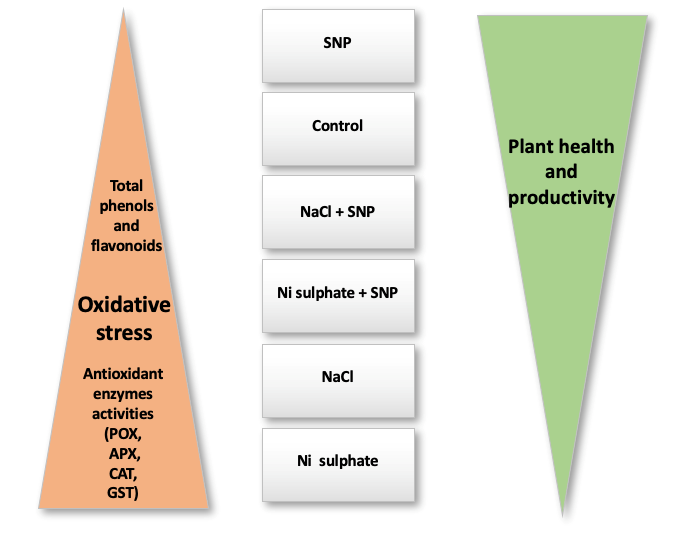
In the present study, we noted that increases in the activities of antioxidant enzymes were more pronounced in response to Ni stress than to salt stress. Moreover, we observed that changes in antioxidant enzyme activities were linearly correlated with plant redox status, as indicated by H2O2 content and lipid peroxidation level (evaluated by MDA content) in lupine shoots and roots under salt stress (unpublished data) or Ni toxicity or SNP treatments (Hashem et al.,2018). Furthermore, the activities of these enzymes show an inverse relationship with plant health, as indicated by growth and yield in response to these treatments (Figure 3).
Total Phenols and Flavonoids
The results obtained in the present study indicate that salt stress (75 mM and 150 mM NaCl) caused an increase in total phenol and flavonoid contents in both the shoots and roots of L. albus compared with the control values (Figure 2C–F). Similar results have been obtained by Valifard et al. (2015), who found that treatment of Salvia species with 100 mM NaCl increased the accumulation of total phenolics by between 35% and 43%. In contrast, the total phenolic content in the leaves of some rice cultivars have been observed to decrease significantly in response to high levels of salt in the rooting medium (Habib et al.,2016), whereas Simaei et al. (2012) found that salt stress induced by NaCl inhibited the accumulation of flavonoids.
With regards to the effects of heavy metals, we found that treatment with NiSO4 at 100 mM and 150 mM promoted increases in total phenol and flavonoid contents in the shoots and roots of lupine plants, when compared with the control values. Previous studies have shown significant increases in phenol and flavonoid contents of plants in response to nickel treatment (Rajaei & Mohamadi,2015) , and it is believed that such increases in turnip (Brassica rapa L.) and lettuce plants grown in heavy metal-enriched soil are defense mechanisms designed to ameliorate the oxidative damage caused by heavy metal contamination (Hassanein et al.,2013).
In the present study, we found that exogenous SNP treatment promoted a significant reduction in total phenol and flavonoid contents, both under normal and salinity or Ni stress conditions. Notably, the contents of total phenols and flavonoids decreased in both the shoots and roots of L. albus in response to the application of 75 mM or 150 mM NaCl + 0.4 mM or 0.6 mM SNP compared with 75 mM or 150 mM NaCl treatments alone.
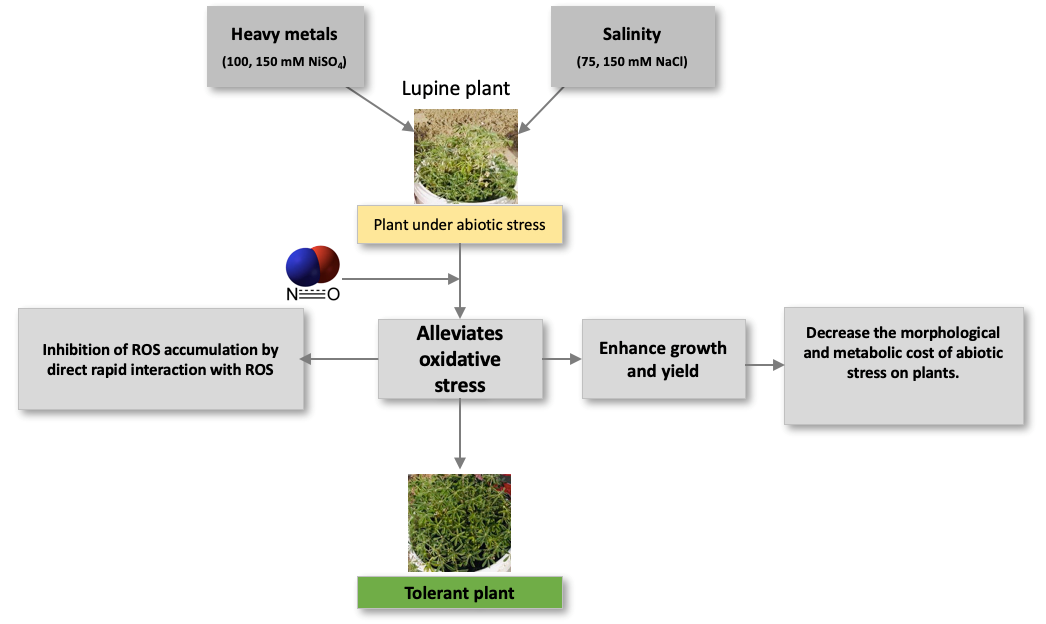
In contrast to our findings, Simaei et al. (2012) have previously demonstrated that exposure to NaCl, treatment with salicylic acid, or SNP or salicylic acid + SNP enhances the flavonoid content in leaves, which had the effect of conferring resistance to salt stress in soybean seedlings. Similarly, salinity and/or SNP (50 and 75 μM) treatments have been found to promotes an increase in phenolic compounds (Jamali et al.,2014), whereas Abdallah et al. (2016) have reported that flavonoid metabolism increased in Solanum nigrum L. plants in response to salt stress, which was associated an increase in the expression of flavonoid-related genes (phenylalanine ammonialyase, chalcone synthase, and flavonol synthase transcripts). Consistent with the results of the present study, D. D. Zhang et al. (2007) found that NO caused a delay in total phenol formation. Reductions in the accumulation of total phenols and flavonoids in NO-treated lupine plants, compared with untreated plants, are indicative of the protective role played by NO with respect to both salt and Ni stress, which is assumed to be related to reductions in both the morphological and metabolic cost of abiotic stress in plants (Figure 4).
Conclusion
The results of the present study provide clear evidence that SNP, as an exogenous NO donor, can alleviate salt stress and Ni toxicity in lupine plants, with a concentration of 0.4 mM being more effective than 0.6 mM in this regard. These effects were found to be associated with significant reductions in antioxidant enzyme activities and secondary metabolite (phenols and flavonoids) production. This highlights the role of NO as an antioxidant molecule that interacts with ROS and reduces the oxidative stress induced by salt or Ni stress, thereby enhancing plant tolerance, as indicated by increases in selected growth parameters and yield quality and quantity. We also found that there is a linear relationship between the activities of antioxidant enzymes and the severity of the stress to which plants are exposed.
Handling Editor
Iwona Ciereszko; University of Bialystok, Poland; https://orcid.org/0000-0003-2694-7991
