. Introduction
The estimation of plant tolerance values for agronomic characters, whilst genetically influenced, is also subject to the environmental conditions in which the plant grows. Effective screening at the generative stage occurs on land directly affected by salinity; however, salinity levels on farmers’ land vary widely and are challenging to predict (Hairmansis & Nafisah, 2020). In different environments, the evaluation of multiple characters or traits in a genotype (including agronomic characters and yield) employs the Genotype by Trait (GT) biplot analysis, a component of GGE Biplot (Oladosu et al., 2017).
The GGE biplot method combines the additive influence of genotype with the multiplicative influence of genotype-environment interactions through PCA analysis (Yan & Tinker, 2006). Decomposing the effects of genotype (G) and genotype-environment interaction (G × E) in the model provides a more comprehensive interpretation of both the main effects of the genotype and its interaction with the environment. This concept is further developed for each observation variable using GT analysis, which considers various concepts of adaptation and stability related to representative and discriminative environmental indications. It facilitates the ranking of genotypes that are more adapted and stable in specific environments (Atnaf et al., 2017).
The GT analysis is utilized to identify salinity stress-tolerant genotypes, playing a crucial role in phenotypic variability assessment and understanding the complexity of genetic interactions. In genetic studies, GT involves interactions between a plant’s genotype and the observed traits or phenotypes displayed by the plant (Yan & Frégeau-Reid, 2018). The primary objective of GT analysis is to determine the interaction between the genotype and the phenotype, identifying genetic factors contributing to complex traits and understanding patterns in which these factors interact (Shojaei et al., 2022). This study aimed to establish the relationship between traits (plant height, tiller numbers, harvesting date, stomatal density, grain filling, and total weight per hill) and the genotypes tested, information on genotype adaptability and stability, and evaluate genotypes based on traits in salinity stress conditions.
. Materials and method
. Experimental design and cultural practices
This research was divided into three experimental phases spanning from March to July 2023. The materials comprised 16 genotypes resulting from IRRI introduction and crossbreeding. The initial experiment took place in a greenhouse in optimal conditions without stress. The subsequent experiment was carried out in a greenhouse in saline conditions, with controlled electrical conductivity (EC) maintained at 5 dS/m throughout the life stages of rice plants. The final experiment was conducted in rice fields affected by salinated intrusion (Table 1). Each experimental phase adopted a randomized block design with three replications, featuring the genotype as a single factor at 16 levels. Observations were recorded just before harvest, encompassing such variables as plant height, number of tillers, number of leaves, flowering date, harvest date, pollen fertility, stomatal density, leaf area, wet and dry weight of leaves and stems, root length, panicle length, percentage of grain content, weight of 1,000 grains, and total weight per hill.
. Statistical analysis
The analysis of variance was based on a randomized block design at each location as well as a combined analysis of variance. The homogeneity of two variances was tested using an F-test. Traits with homogeneous variances underwent a combined analysis of variance. The combined analysis of variance was performed using an F-test to determine genotype-environment interactions. The Finlay and Wilkinson (1963) method is used to measure stability with linear regression values (b1). Genotypes with static stability values and low adaptability have b1 smaller than b1 = 0; low adaptation to the marginal environment is obtained in genotypes with bi values between 0–1 at the regression coefficient (b1) = 1 and the mean that is lower than the total mean, and if the mean is higher than the total mean, a dynamically stable genotype with high adaptability to the marginal environment is declared. In turn, genotypes with b1 greater than 1 are declared to have special adaptation values in the optimal environment. The analysis is performed by calculations with the formula (Finlay & Wilkinson, 1963):
where Yij is the response of genotype i in environment j,
Pearson correlation was used in the correlation analysis. The biplot analysis is divided into three; the first is the GT biplot analysis which is used to determine the relationship between the trait and the genotype being tested. The genotype ranking biplot analysis is used to determine genotypes that have high stability and adaptability values in salinity stress environments. The mega environment biplot analysis is used to evaluate genotypes based on traits in salinity stress environments using the which-won-where concept. R.4.2.2 software was used in the statistical analyses, which included analysis of variance and comparison of means with the Tukey HSD method; correlation coefficients between traits were also used for graphical analysis in each environment, or the following equation according to Yan and Tinker (2006) was used:
where
where Z is the standard score, X is the initial data of the trait,
. Results
. Combined analysis of variance and mean comparison
The results of the analysis of variance showed a very significant effect of environmental factors on all observation variables (plant characters) except plant height, while genetic factors also had a very significant effect except on the number of leaves and pollen fertility. The interaction between the environmental and genetic factors had a significant effect on plant characteristics except pollen fertility and 1,000-grain weight (Table 2).
Table 2
Recapitulation of observed characters based on analysis of variance.
Different environments or levels of salinity stress induce variations in plant responses for all characters, except for plant height, number of leaves, and pollen fertility. Elevated NaCl salt stress levels disrupt seed development. The low harvest index in plants due to salinity is attributed to the accumulation of morphological and physiological changes, including decreased leaf size, increased flowering time, and heightened stomatal density (Table 3).
Table 3
HSD mean comparison of traits in 16 genotypes of rice.
[i] Note: PH: Plant height, Till: Number of tillers, Leaf: Number of leaves, Flow: Flowering age, Harv: Harvest age, Stom: Stomatal density, Poll: Pollen fertility, Root: Root length, LA: Leaf area, LwW: Weight of leaf wet, LdW: Weight of leaf dry, SwW: Weight of stem wet, SdW: Weight of stem dry, PL: Panicle length, FG: Percentage of filled grain, GW: 1,000-grain weight, TWC: Total weight per hill, ns: non-significant, Numbers followed by the different letter in the same column show significantly at p < 0.05.
The adaptability and stability analysis performed with the Finlay and Wilkinson method was based on the general mean and b1 (regression coefficient) values, where genotypes with b1 between 0–1 at regression coefficient (b1) = 1 and greater mean for all variables and lower for harvest age were declared as dynamically stable genotypes and highly adapted to all environmental conditions. The results showed that G2 and G13 were dynamically stable and had wide adaptation with indicators of average plant height, root and panicle length, number of tillers, and total weight per clump above the general average and average harvest age below the general average with b1 between 0–1. In turn, G5, G14, and G16 exhibited stability and wide adaptation for 3–4 main plant characters (Table 4).
Table 4
Adaptability and stability analysis of 16 genotypes of rice.
. Correlation analysis
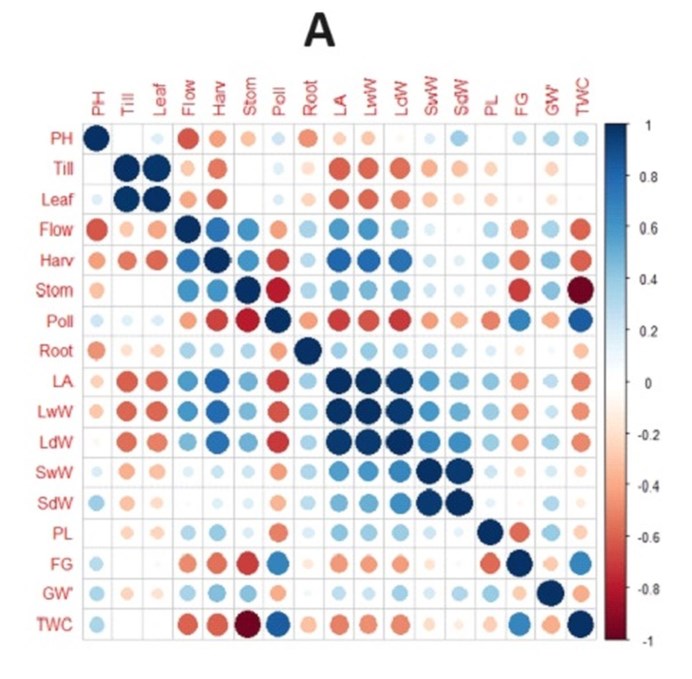
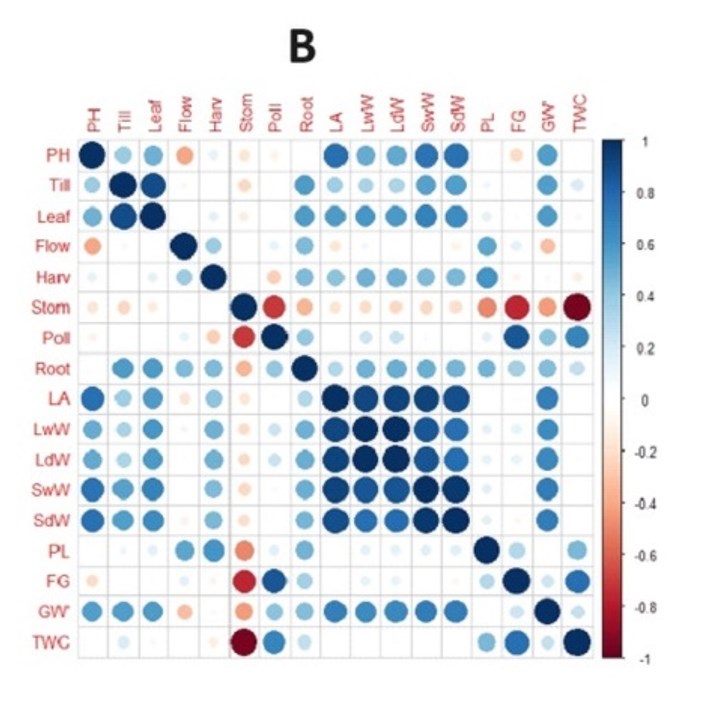
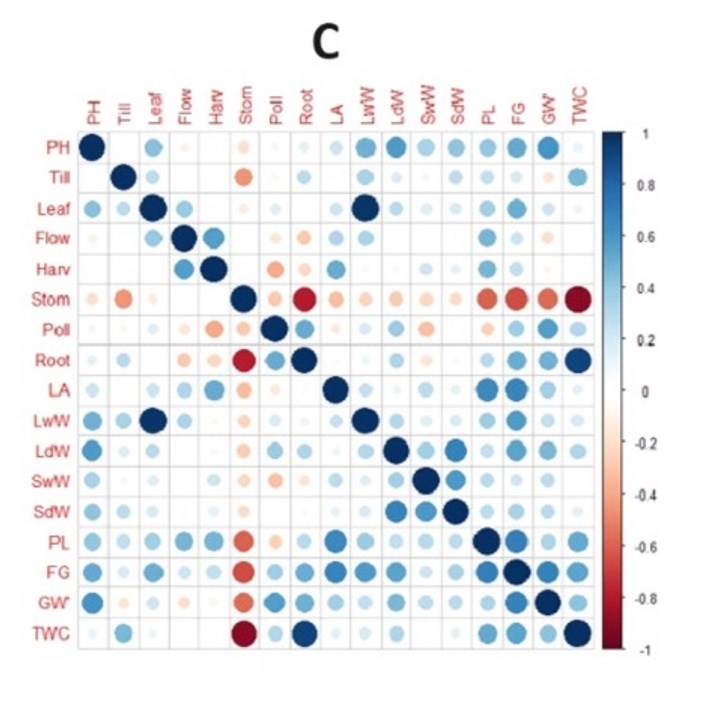
Correlation analysis between the traits was conducted separately in each environment. This was done to determine the G × E interaction for each trait within each environment. In the optimal environment, a significant negative correlation was observed between total weight per hill and harvest age, flowering age, and stomatal density. Pollen fertility and grain content percentage showed a positive and significant correlation with total weight per hill (Figure 1A). In the saline environment of the greenhouse, plant height exhibited a positive and significant correlation with leaf area as well as with wet and dry stem weight. Total weight per hill demonstrated a negative and significant correlation with harvest age and stomatal density (Figure 1B). In rice fields affected by salinated intrusion, stomatal density displayed a negative and significant correlation with root length, panicle length, percentage of grain content, weight of 1,000 grains, and total weight per hill. Leaf area showed a positive and significant correlation with the wet weight of leaves. Panicle length, percentage of filled grains, and weight of 1,000 grains exhibited a positive correlation with total weight per hill (Figure 1C). The correlation analysis (Figure 1) shows that L1 (optimum environment) has more significant negative correlation values compared to salinity stress environments (L2 and L3), characterised by more orange colour in Figure 1A, for example in the characteristics of leaf area with number of tillers, leaf area with number of leaves, leaf area with pollen fertility, and wet and dry weight of leaves with pollen fertility. A significant negative correlation between these traits was only found in the optimum environment, whereas in the salinity stress environment (Figure 1B, Figure 1C), these traits had a non-significant positive correlation.
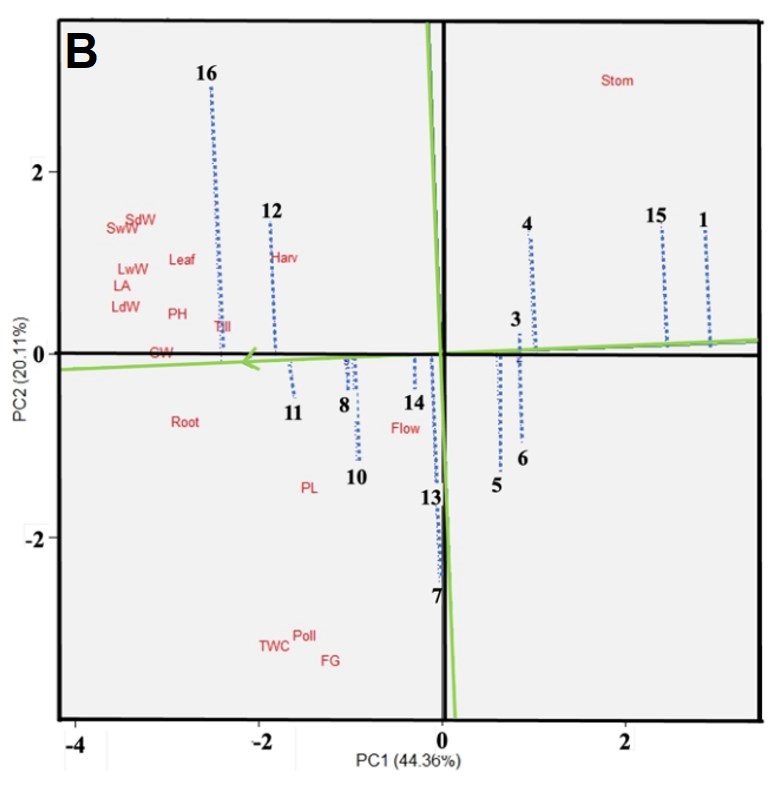
. Genotype by trait evaluation
The genotype by trait evaluation biplot illustrates data from 16 salinity-tolerant rice genotypes across 17 traits measured during the growth phase. The purpose of this GT evaluation biplot is to identify and select superior genotypes based on these traits. These selected genotypes can then serve as parents in crossbreeding programs aimed at developing improved salinity-tolerant rice varieties.
The GT biplot consists of a genotype vector and a trait vector. The difference in length between the genotype vector and the biplot axis point signifies the variation between the genotype and the average genotype (Yan & Frégeau-Reid, 2018). Both representatively and discriminatively, this indicates the influence of genotype on yield component characters or interactions between these genotypes and yield component characters (GT) (Yan & Tinker, 2006). Genotypes positioned near the center point of the biplot, characterized by shorter vector lines, exhibit a minimal impact of genotype and GT interactions or static stability. The distance and angle formed by two genotype vectors elucidate the distinctions among the genotypes. The genotype’s performance is considered better than average if the angle between its vector and the environmental vector is <90°, worse than average if the angle is >90°, and close to average if the angle is approximately 90° (Yan & Frégeau-Reid, 2018). The primary function of this biplot is to determine genotype rankings based on the average GT interaction value.
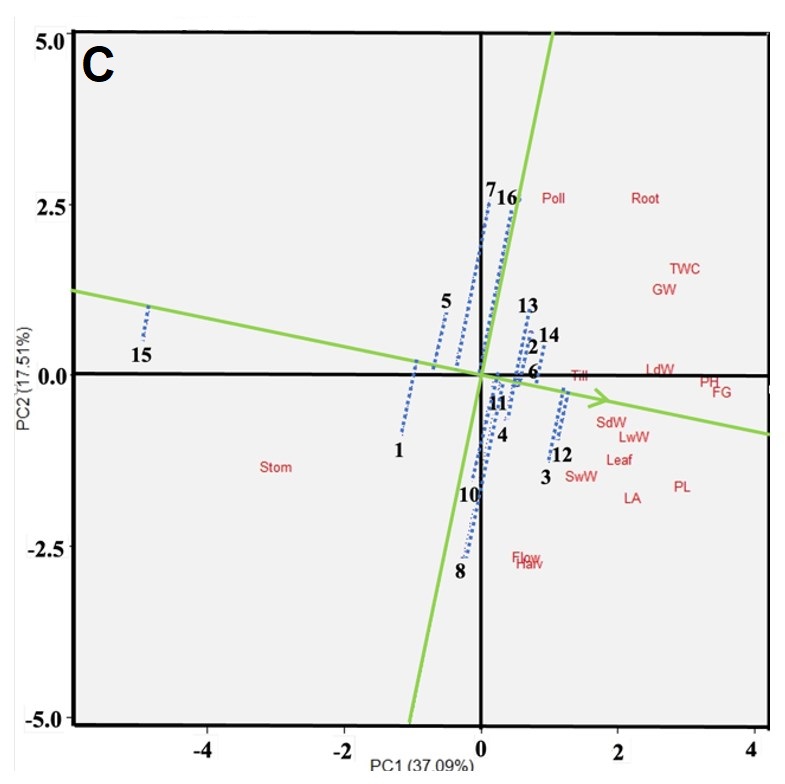
In Figure 2A, it is explained that in an optimal environment, the trait vector and genotype vector are evenly spread from the biplot’s center point. Genotypes IL05, IL01, and IL015 score high in traits like the number of tillers and number of leaves, as indicated by genotype vectors and trait vectors forming acute angles (<90°). IL07 exhibits the highest trait value for pollen fertility, and IL16 and IL13 in such characteristics as the percentage of filled grain and total weight per hill. Genotypes IL03, IL04, IL06, and IL11 score high in plant height as well as wet and dry stem weight. IL12 and IL10 excel in such traits as wet and dry leaf weight, leaf area, and weight of 1,000 grains. IL08 leads in panicle length, root length, flowering time, and harvest time. High stomatal density is observed in IL09 and IL02. Genotypes that form obtuse angles, or angles greater than 90°, with total weight traits per hills are IL02, 1L08, IL09, IL14, and IL12. This indicates that, in an optimal environment, these genotypes have a lower average value in the total weight trait per hill compared to other genotypes.
Figure 2
Genotype by trait biplot on salinity tolerant rice genotypes based on yield component characters. (A) Optimum environment; (B) Salinity environment in greenhouses; (C) Rice field environment affected by salinated intrusion.
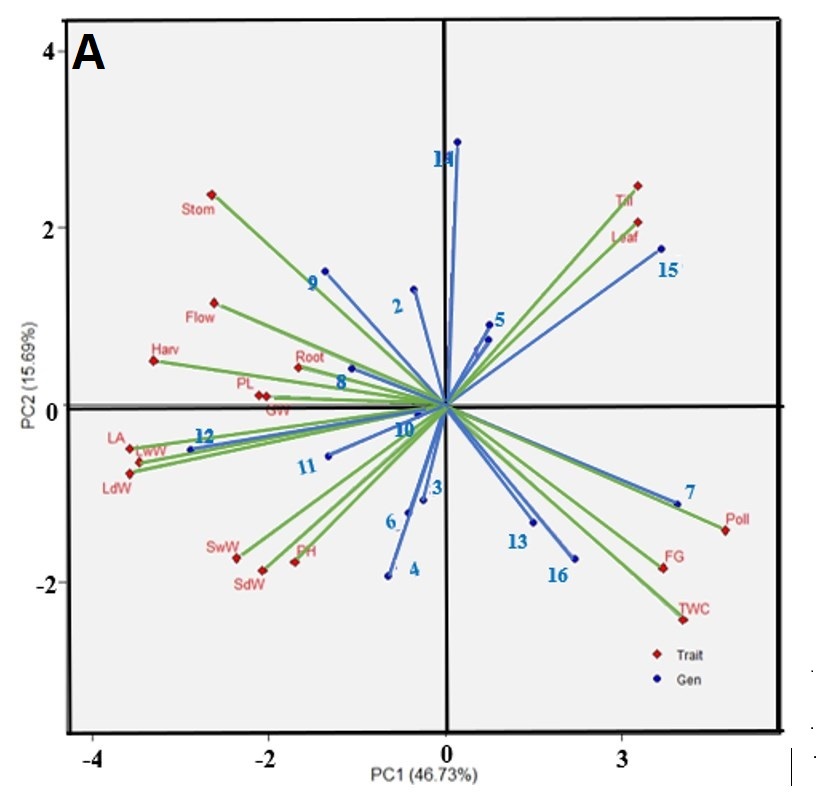
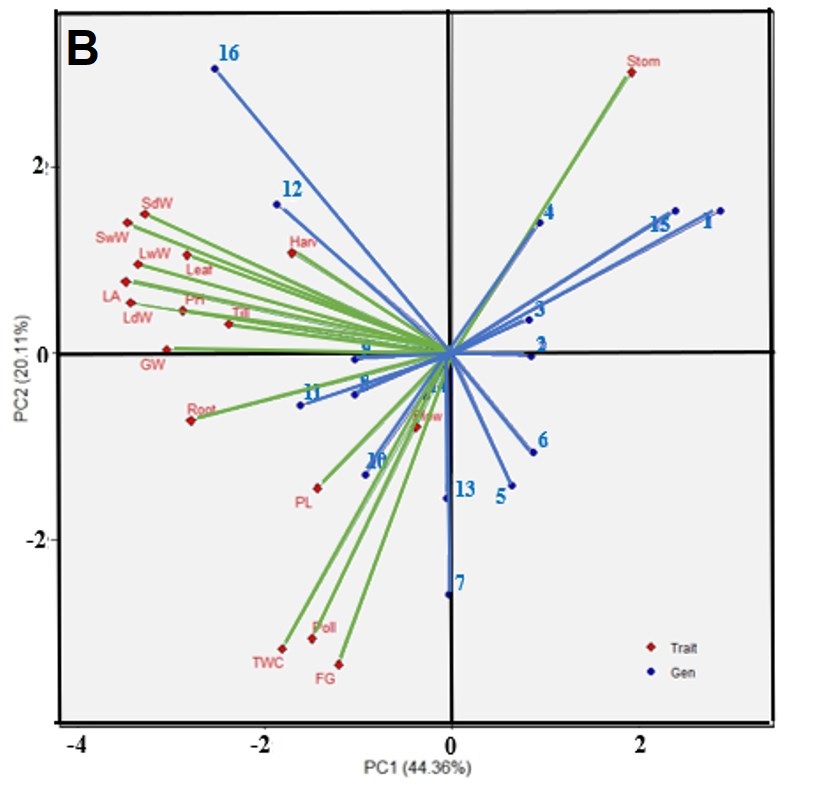
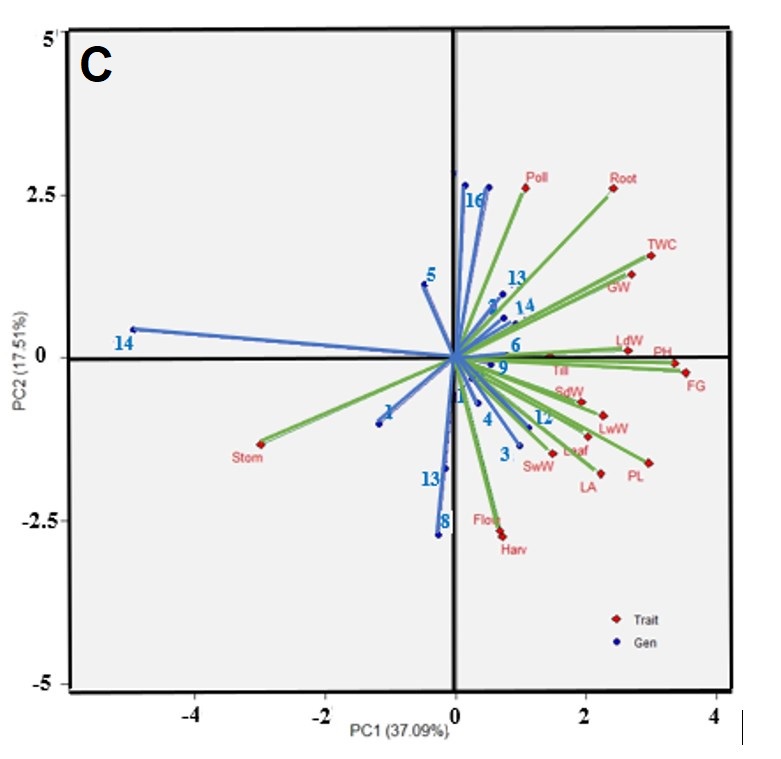
Figure 2B is a biplot illustration in a greenhouse saline environment (L2). This figure reveals that the distribution of genotype vectors and trait vectors is not as even as in Figure 2A due to the stress in the experimental environment. Consequently, certain traits can be grouped into specific genotypes. Genotypes IL04, IL15, IL01, IL03, and IL02, based on the angle between the genotype vector and the trait vector, form acute angles in the stomatal density trait. This indicates that these genotypes have high values for stomatal density and are considered discriminative genotypes. IL14, IL13, IL07, and IL10 score highly in terms of flowering age, while IL14, IL10, IL6, IL11, and IL09 have high scores in grain content percentage, pollen fertility, total weight per hill, panicle length, root length, and weight of 1,000 grains. IL12 and IL16 exhibit higher values in such traits as the number of tillers, plant height, wet and dry weight of leaves and stems, leaf area, number of leaves, and harvest age. If the desired genotype exhibits a high number of tillers, number of leaves, panicle length, percentage of filled grain, and total weight per hill, while having low values for harvest age, flowering age, and stomatal density, then there is no genotype that matches these criteria in L2. IL12 comes close to these criteria with the highest values in the number of tillers and number of leaves, but IL12 also has a high harvest age. On the other hand, IL07, IL13, IL14, and IL10 have high percentages of grain content, panicle length, and total weight per hill, but these genotypes also have a high or prolonged flowering period.
In Figure 2C, vectors forming acute angles (<90°) between the genotypes and the traits include those found in IL07, IL16, and IL05, which have the highest values for pollen fertility. IL02 and IL13 have the highest values for root length, while IL14 leads in total weight per hill and weight of 1,000 grains. IL06 tops the list in plant height, percentage of grain content, number of tillers, and dry weight of leaves. IL09, IL12, IL04, and IL03 score highest in stem dry and wet weight, leaf wet weight, number of leaves, leaf area, and panicle length. IL11, IL08, and IL10 have the highest values for flowering time and harvest time. IL01 and IL15 record the highest values for stomatal density. If the desired genotype exhibits a high number of tillers, number of leaves, panicle length, percentage of filled grain, and total weight per hill, then IL14, IL9, IL12, and IL6 are recommended genotypes in the experimental environment of rice fields intruded by seawater. These representative genotypes closely align with the desired trait vector, forming an acute angle of <90°. Meanwhile, IL10, IL11, IL08, IL01, and IL15 are undesirable genotypes because they exhibit the highest values for flowering age, harvest age, and stomatal density traits. These genotypes are discriminative with dynamic stability and low adaptability to rice fields affected by salinated intrusion (L3).
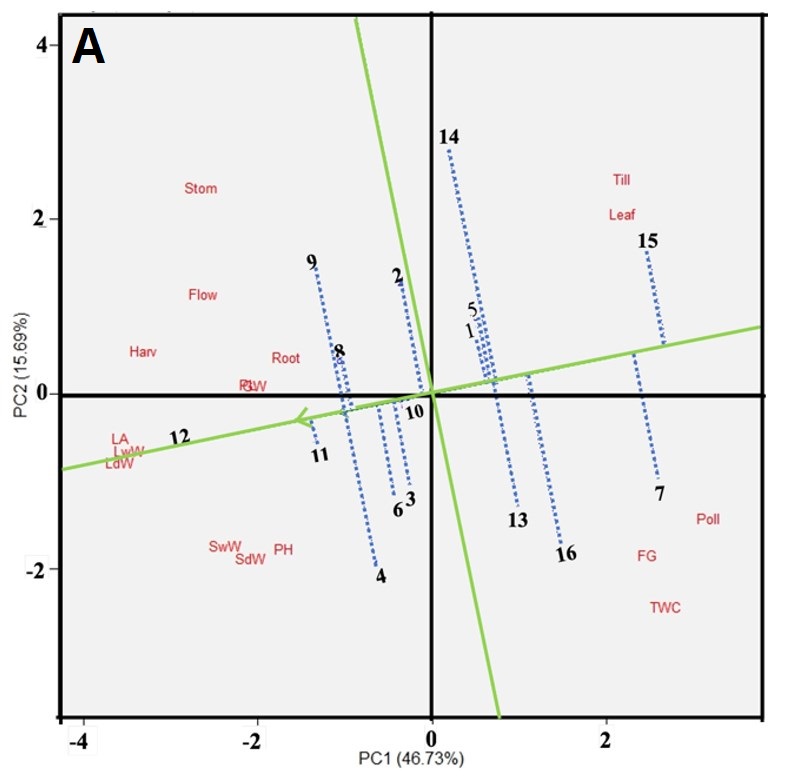
. Ranking of genotypes
In the genotype ranking biplot for yield component characters, an AEA line on the x-axis represents the average salinity stress tolerance for each genotype. Perpendicular to the AEA axis is the y-axis describing the dynamic stability of the tested genotypes (Yan & Tinker, 2006). Genotypes outside the y-axis arrow have overall average character values higher than the genotypic average, indicating high average values for yield component characters during their growth phase until harvest. However, their overall yield may not be the highest, as they may excel in specific optimal environments. On the other hand, genotypes within the y-axis arrow have overall average character values lower than the genotypic average. The further a genotype is from the x-axis, the more unstable it is.
In Figure 3A, it is evident that IL15, IL07, IL016, IL13, IL14, IL05, and IL01 exhibit lower average values for each yield component character in the optimal environment (L1). Among the genotypes with high average scores for all yield component characters, IL12, IL11, IL09, IL04, IL08, IL06, IL03, and IL10 stand out. However, for the optimal environment (L1), IL09 is the recommended genotype due to its proximity to the AEA arrow point. Therefore, in an optimal environment without salinity stress, IL12 exhibits the highest stability, IL09 delivers the highest yield, and IL15 has the lowest stability.
Figure 3
Ranking of rice genotypes tolerant to salinity stress based on the performance of yield component characters. (A) Optimum environment; (B) Salinity environment in greenhouses; (C) Rice field environment affected by salinated intrusion.
In Figure 3B, IL07 and IL13 have yield component character values close to the average. In this environment, IL16 demonstrates the highest average yield component value (high stability), while IL12 represents the ideal genotype. Conversely, IL01 exhibits the lowest average value. Figure 3C indicates that IL15, IL01, IL05, and IL07 exhibit lower average values for each yield component character in the rice field environment affected by salinated intrusion (L3). IL12 represents the ideal genotype with a high level of stability, while IL01 exhibits the lowest average value.
. Mega-Environment analysis
Mega-environment analysis aims to identify a genotype that is best suited to each test environment. The most suitable genotypes can be further developed for breeding salinity-tolerant rice. This analysis used the average total weight per hill for each genotype in every environment, as shown in Figure 4. The mega-environmental analysis is divided into five sectors with five points. Genotypes at the vertices exhibit high or low adaptability to salinity stress in different environmental conditions. The fifth genotype, which shows high adaptability, aligns with the environmental factors forming a perpendicular line, denoted as IL07>IL13>IL14>IL12>IL015.
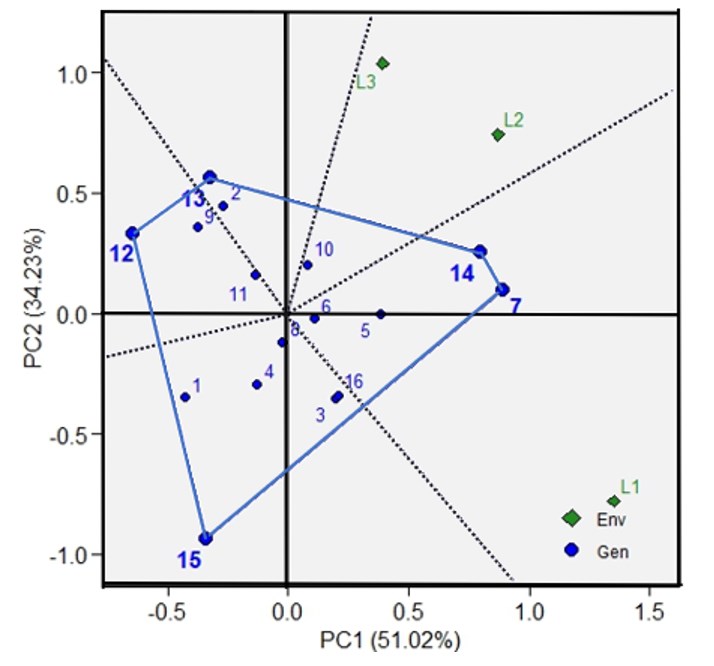
Sector I consists of IL07, IL14, IL05, IL06, and IL16. These genotypes have the highest total weight values per hill in L1. Sector II consists of IL10, which has the highest average total weight per hill in L2 and L3. Sector III consists of IL13 and IL02. Sector IV consists of IL12, IL09, and IL11. Sector V consists of IL15, IL01, IL04, and IL08. Genotypes in Sector V have a lower average total weight per hill compared to the other genotypes.
. Discussion
Environments with different salinities can disrupt metabolic processes and cause differential responses in rice, ultimately resulting in a low harvest index (Hoang et al., 2016). High NaCl salt stress prolongs the flowering duration (Krismiratsih & Winarso, 2020). The inhibition of the flowering process in rice plants under Na+ salt stress levels is linked to genetic factors (Puvanitha & Mahendran, 2018). Salinity stress can impact the weight of 1,000 grains of rice produced (Muttaqien & Rahmawati, 2019). Excessive salt or Na+ in the soil inhibits the absorption of water and nutrients due to osmotic pressure. Reduced water absorption by the roots leads to depletion of water within the plant. Impaired absorption of water and nutrients hinders rice plants from efficiently transporting photosynthate to the grains, resulting in reduced weight (Liu et al., 2022).
Undesirable genotypes are those that exhibit the highest values for such traits as flowering age, harvest age, and stomatal density. A high flowering age and harvest age indicate that these genotypes take longer to mature and are harvested later compared to other genotypes (Kazan & Lyons, 2016). This results in stomata becoming thicker, tighter, and closed to reduce excessive evaporation. Genotypes with high stomatal density traits are more susceptible to salinity stress (Pitaloka et al., 2022).
A combination of the environment and the genotype is needed to improve plant characteristics and test stability before releasing new varieties (Silva Júnior et al., 2020). This information can be obtained from several experiments. A single stability analysis method is not representative enough to determine genotype performance in various environments because it will give different results, which sometimes leads to wrong decisions about genotype stability (Herawati et al., 2021). Breeders generally use several methods to determine the adaptation and stability of genotypes and interpretation of genotype stability to recommendations for variety release (Oladosu et al., 2017).
Stability adaptation analysis is classified as one of the univariate and multivariate stability methods (Oladosu et al., 2017). Univariate methods commonly used were proposed by Francis and Kannenberg (1978) with coefficient of variation (CVi), Finlay and Wilkinson (1963) with linear regression parameters (b1), Eberhart and Russell (1966) with linear regression (b1) and standard deviation (S2di), and Kang (1993) with yield stability parameters (YSi). This method has a drawback, namely the model used cannot accurately describe the G × E interaction because the genotype response varies in different environments (Akbar et al., 2021). Another drawback is that this method can cause bias, especially in incomplete designs where several genotypes are evaluated in each environment, and cause greater sample variation (Herawati et al., 2021). The G × E interaction can be further explained using multivariate analysis. One of the popular multivariate methods used is the GGE biplot analysis (Atnaf et al., 2017). Biplots function to visualize the relationship between genotypes and traits and identify which genotypes have the best performance for certain traits (Yan & Tinker, 2006).
. Conclusion
GT biplots are essential in plant breeding for evaluating the performance of different genotypes based on multiple traits or supporting characteristics. They work by plotting genotypes and traits on biplots to visualize the relationship between genotypes and traits, enabling the identification of which genotypes perform best for specific traits. Based on GT biplot analysis, differences in genotype responses based on yield component variables were observed in each experimental environment. Notably, IRRI-IL12, a cross of BBPadi lines, and IRRI-IL09, an IRRI introduced line, demonstrated stability as salinity-tolerant rice genotypes. In the optimal environment (L1), IRRI-IL07 and IRRI-IL16 exhibited adaptability, while in the greenhouse salinity environment (L2), IRRI-IL07 and IRRI-IL10 demonstrated adaptability. Additionally, IRRI-IL13 proved to be adaptive in the rice field salinity stress environment (L3).
