. Introduction
It is estimated that approximately 20% of the irrigated land in the world is affected by salinity and is exclusively classified as arid and desert lands, comprising 25% of the total land of our planet (de la Torre-González et al., 2020; Wang et al., 2019). Soil salinity is a major constraint on food production because it limits crop yield and restricts the use of previously uncultivated land (Hernández, 2019; Li et al., 2018; Uddin et al., 2021). The growth and development of glycophytes are negatively affected, but halophytes tolerate high concentrations of inorganic salts (Abd El-Samad, Shaddad, & Ragaey, 2019; Helaly et al., 2017; Meng et al., 2018).
Zinc is a micronutrient that plays a dual role in plants. This element activates many enzymes and is involved in protein synthesis and whole plant metabolism (nitrogen assimilation, photosynthesis, auxin synthesis, and in carbohydrate, nucleic acid, and lipid metabolism) (Das et al., 2020; Mohammad et al., 2021; Sun et al., 2010). At appropriate concentrations, Zn increases plant productivity, growth, and fruit development (Borowiak et al., 2015). The beneficial role of this element is limited because of its concentration in the environment as well as in plants. This level is quite narrow within the range of 15–100 mg/kg (Clemens, 2006). In turn, excess Zn can cause an imbalance in proper functioning of transpiration, photosynthetic electron transport chain, chlorophyll biosynthesis, and membrane integrity (Arif et al., 2016).
Nickel is an essential micronutrient among trace metals and an integral constituent of the enzyme urease, which catalyzes the hydrolysis of urea (Fabiano et al., 2015). However, high concentrations of Ni in the soil can cause toxic effects in plants (Bhalerao et al., 2015). Excess Ni in plant tissues may induce changes in primary metabolism, resulting in growth inhibition and other toxicity symptoms, such as chlorosis, leaf wilting, and necrotic spots (Pandey & Sharma, 2002).
During growth, plants are simultaneously exposed to a number of stresses such as excessive salinity and heavy metals (Jagetiya et al., 2013). Therefore, experiments were conducted to study the influence of salt-induced osmotic stress and the interactive effects of different concentrations of selected micronutrients (Zn or Ni) on wheat plants.
. Material and Methods
. Field Experiment
Wheat is considered to be one of the oldest and most important cereal crop plants for global food security. This study was conducted to investigate the effect of different levels of NaCl-induced osmotic stress, as well as the interactive effects of selected micronutrients (Zn and Ni) on the growth and metabolic activities of wheat at both vegetative and generative stages.
A pot experiment was conducted in open air at the garden of the Faculty of Science-Minia University during the winter season (November 2021 – April 2022). Seeds of wheat (Triticum aestivum L.) cv. Gimiza 11 were brought from the International Research Center of Agriculture. The seeds were surface-sterilized by immersion in a mixture of ethanol (96%) and H2O2 (1:1) for 3 min, followed by several washes with sterile distilled water. The concentrations of salt, Zn, and Ni were chosen after preliminary experiments in which the grains were subjected to different concentrations of NaCl, Zn, and Ni. Zn and Ni were applied to the soil, and 1,000 mL of the Ni or Zn solution was added to each pot according to the field capacity. Zinc was added as zinc sulfate (ZnSO4 × 7H2O) at concentrations of 20 or 200 µM, whereas Ni was added as nickel chloride (NiCl2 × 6H2O) at concentrations of 1 or 100 µM.
Each pot contained 4 kg of garden clay soil in three replicates, to which 1,000 mL of the experimental solutions (distilled water as a control or different concentrations of NaCl solutions as osmotic stress inductors) were added according to field capacity. Five seeds were sown in each pot. All pots were irrigated with tap water for 2 weeks until full germination. The seedlings were then irrigated with different concentrations of NaCl solution to induce the desired level of osmotic stress (0, −0.6 MPa, −0.9 MPa, or −1.2 MPa) in the first group. These treatments were repeated with 20 µM Zn in the form of ZnSO4 as the second group and 200 µM Zn as the third group. The fourth group was treated with 1 µM Ni in the form NiCl2 and the fifth group with 100 µM Ni. To maintain the osmotic potential, the soil moisture was kept near field capacity using tap water. Plants were allowed to grow under natural conditions for 120 days. Plant dry weights were determined at the end of the experimental period, and the yields of the different organs (shoots, roots, and spikes) were measured. To determine the dry matter content of the different organs, they were dried in an oven at 80 °C. Successive weighting was performed until a constant dry weight was reached for each sample.
. Biochemical Analysis
Soluble sugars in water-extracted samples were determined using the anthrone-sulfuric acid method (Fales, 1951). The soluble protein content was measured according to Lowry et al. (1951) in water-extracted samples. Amino acid and free proline concentrations were measured as described by Moore and Stein (1948) and Bates et al. (1973), respectively. The levels of Na+ and K+ accumulation were measured using the flamphotometric method described by Williams and Twine (1960).
. Estimation of Carbohydrates
Water-Soluble Carbohydrates
Extraction: To estimate water-soluble carbohydrates, a known weight of the dried tissue material (0.1 g) was placed in 10 mL of distilled H2O and boiled in a water bath at 100 °C for 2 hr. After cooling, the hydrolysates were filtered and completed to a definite volume using distilled H2O.
Determination: Soluble carbohydrates were determined by the anthrone-sulfuric acid method, as described by Fales (1951).
Reagents: The anthrone-sulfuric acid reagent consists of 0.2 g anthrone, 8 mL absolute ethyl alcohol, 30 mL of distilled water, and 100 mL of concentrated H2SO4 (D = 1.84). The substances were successively mixed in a conical flask under continuous cooling. This reagent must always be freshly prepared.
Procedure:
One mL of the plant tissue extract was put in a clean Pyrex test tube of about 16 × 160 mm and mixed with 4.5 mL anthrone reagent.
This sample was heated at 100 °C in a water bath for 7 min and directly cooled under tap water.
The extinction of the developed blue-green color was measured at a wavelength of 620 nm against a blank, which contained only distilled water and anthrone reagent, using a spectrophotometer.
A calibration curve was created using pure glucose, from which it was indicated that one extinction was equivalent to 210 mg glucose. Then 4.5 mL of anthrone reagent was added to 1 mL of the prepared unknown solution in a clean, dried test tube. Carbohydrate content was calculated as mg/g dry weight of the plant organs.
Total Carbohydrates
Extraction: Because the different plant organs have relatively high or low carbohydrate content, a preliminary experiment was made for every plant organ to find out the suitable quantity of the sample to be hydrolyzed, the normality of hydrochloric acid used, and the time required for a complete hydrolysis. These preliminary experiments showed that for root samples, 2 N HCl and a period of one hour were suitable for complete hydrolysis in a water bath at 100 °C. In addition, the experiments showed that 4 N HCl was suitable for the complete hydrolysis of carbohydrates in stems, leaves, and spikes when applied for a period of 1 hr.
Determination: Total carbohydrates were estimated by the anthrone-sulfuric reagent method, as described in the case of water-soluble carbohydrates.
. Estimation of Proteins
Water-Soluble Proteins
Extraction: To estimate water-soluble proteins, a known weight of the dried tissue material (0.1 g) was placed in 10 mL of distilled H2O and boiled in a water bath at 100 °C for 2 hr. After cooling, the water extract was centrifuged, and the supernatant was decanted and completed to a definite volume using distilled water.
Determination: Soluble proteins were determined according to the method adopted by Lowry et al. (1951).
Reagents:
Reagent A (2% Na2CO3 in 0.1 N NaOH): Reagent A was prepared by dissolving 2 g of sodium carbonate in 100 mL of 0.1 N NaOH solution.
Reagent B (0.5% CuSO4 in 1% sodium-potassium tartrate): Reagent B was prepared by dissolving 0.5 g of CuSO4 × 5H2O in 1% sodium-potassium tartrate.
The alkaline reagent solution: This solution consisted of 50 mL of Reagent A and 1 mL of Reagent B. This reagent should always be freshly prepared.
Procedure:
Five milliliters of the alkaline reagent solution were added to 1 mL of the test solution (water extract) in a clean test tube.
These were mixed thoroughly and allowed to stand at room temperature 25–30 °C for at least 10 minutes.
A volume of 0.5 mL of the diluted Folin–Ciocâlteu reagent (1:2 v/v) was added to the mixture and mixed immediately.
After 30 min, extinction against the appropriate blank was measured at 700 nm. A calibration curve was constructed using egg albumin and the data were expressed as mg protein/g dry weight.
Total Proteins
Extraction: Total proteins were extracted by adding 10 mL of 1 N NaOH to approximately 100 mg of oven-dried plant material and heated in a boiling water bath for 1 hr. Finally, the solution was cooled, filtered in sterilized vials, and stored in a refrigerator until use.
Determination: One milliliter of plant extract was added to 5 mL of alkaline reagent solution. Both were thoroughly mixed and allowed to stand at room temperature for at least 10 min. Thereafter, 0.5 mL of Folin–Ciocâlteu reagent (1:2 v/v) was added and mixed rapidly. After 30 min, the extinction was measured against a suitable blank at 700 nm.
Total Free Amino Acids Analysis
Determination: Free amino acids were extracted from the plant tissues and determined according to the method described by Moore and Stein (1948).
Reagents:
Reagent A – ninhydrin solution: The solution was prepared by dissolving 0.25 g of ninhydrin in 100 mL methanol.
Reagent B – citrate buffer: The solution was prepared by dissolving 8 g of citric acid in 50 mL of 2 N NaOH (pH = 5), followed by completion to 100 mL using distilled water.
Reagent C – stannous chloride: Stannous chloride (0.016 g) was dissolved in 10 mL citrate buffer (pH = 5) and 10 mL of ninhydrin solution.
Reagent D – diluent solution: Mix an equal volume of distilled water and ethyl alcohol.
Procedure:
One milliliter from the sample and 1 mL of stannous chloride was put in a test tube.
After shaking, the test tube was placed in a boiling water bath for at least 20 min, and then cooled at room temperature.
After cooling, 3 mL of diluent solution was added to each test tube.
The above steps were repeated with a blank by substituting the sample with 1 mL distilled water.
The absorbance was read at 570 nm within an hour.
A calibration curve was constructed using any amino acid (e.g., leucine or glycine), and the data were expressed as mg/g dry matter.
Estimation of Free Proline
Extraction: A definite weight of macerated dry tissue was homogenized in 5 mL of 3% sulfosalicylic acid, boiled for 20 min, cooled, and filtered through a filter paper.
Determination: Free proline was determined according to Bates et al. (1973).
Procedure:
One milliliter of the filtrate was mixed with 1 mL of glacial acetic acid and 1 mL of acid ninhydrin in a test tube and boiled for 1 hr at 100 °C.
Preparation of acid ninhydrin solution:
Ninhydrin at a weight of 1.25 g was dissolved in 20 mL of orthophosphoric acid (6 M), and then 30 mL glacial acetic acid was added.
The reaction mixture was extracted with 4 mL toluene and mixed vigorously in a test tube for 15–20 s. The chromophore containing the toluene fraction was aspirated from the aqueous phase and heated to room temperature.
The absorbance was measured at 520 nm using toluene as the blank. Proline concentration was determined using a standard curve and calculated on a dry weight basis as mg proline/g dry matter.
. Estimation of Sodium and Potassium Concentrations
Because the flame emission technique is a sensitive method for the determination of cations, the flame photometer method (Carl Zeiss flame photometer) was used for potassium and sodium determination (Williams & Twine, 1960).
. Antioxidant Compounds Assay
l-Ascorbic acid (AsA) levels were determined according to the procedure described by Jagota and Dani (1982). The total flavonoid content was determined according to the technique described by Harborne (1998). Anthocyanin concentrations were determined according to the method proposed by Krizek et al. (1993).
. Statistical Analysis
The experimental data sets were subjected to one-way analysis of variance (ANOVA) using SPSS version 11.0, to quantify and evaluate the source of variation, and the means were separated by the least significant differences (LSD) at a p level of 0.05% (Steel & Torrie, 1960). Correlation coefficients were calculated using the STATGRAPHICS 5.0 software.
. Results
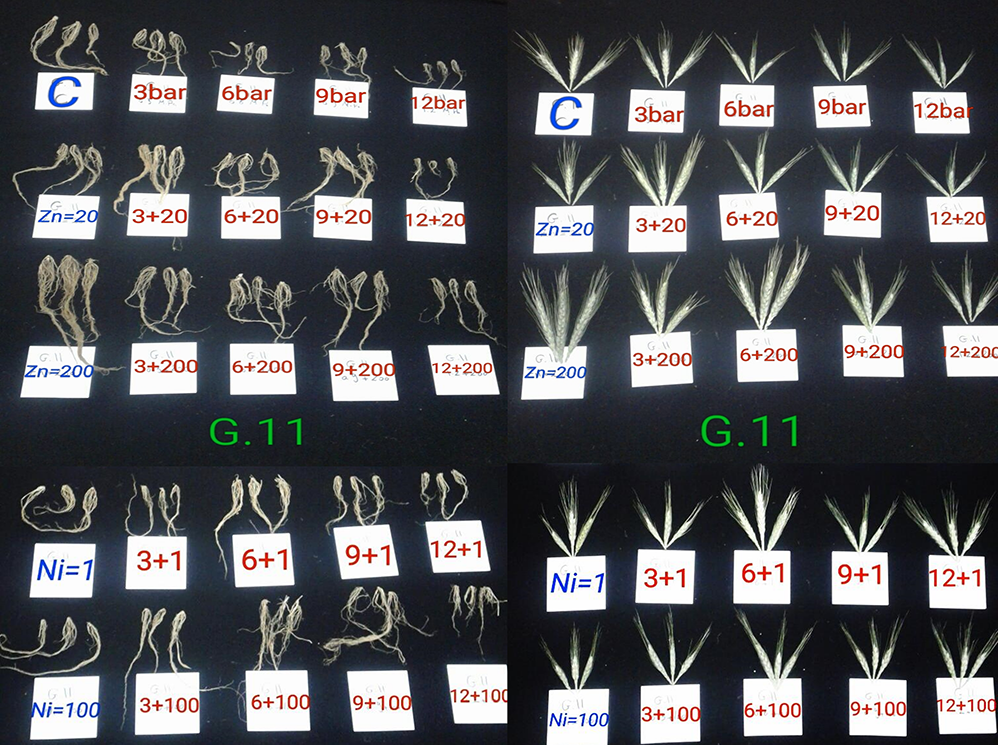
The data in Table 1 and Figure 1 show that the fresh and dry matter yield declined significantly with increasing osmotic stress intensity in the roots, shoots, and spikes. The rate of decline in these growth parameters was greater at higher osmotic stress levels (OSL). The percentage reductions of fresh and dry matter at −0.3 MPa OSL were 18.4%, 20.8%, 44.0%, 35.5%, 23.3%, and 20.5%, respectively. Correspondingly, the percentage reductions of fresh and dry matter at −1.2 MPa were 68.4%, 75%, 88.1%, 86.2%, 66.6%, and 64.9%, respectively, in roots, shoots, and spikes.
Treatment of wheat with Zn or Ni at both concentrations reversed the growth-inhibitory effects of salt stress and increased the production of fresh and dry matter in shoots compared with those of the corresponding OSL. In the roots, low or high concentrations of Zn increased fresh and dry matter, as compared with those of the equivalent OSL, whereas in spikes, treatments with low concentrations of Zn (20 µM) did not affect the fresh and dry matter. In turn, a high Zn concentration (200 µM) induced a significant increase in these parameters compared to that of the corresponding OSL. On the other hand, treatments of wheat with low or high concentrations of Ni generally exhibited marked stimulatory effects on the fresh and dry matter of shoots and spikes at all OSL. In addition, roots of plants supplemented with 1 µM Ni demonstrated an activation trend in these parameters at all OSL. However, treatment with 100 µM Ni resulted in a decrease in the fresh and dry matter when compared with that at equivalent levels (Table 1).
Table 1
Fresh and dry matter of roots, shoots and spikes (g/plant) of wheat as effected by different osmotic stress levels with or without Zn (20 and 200 µM) or Ni (1 and 100 µM) supplementation.
| Root | Shoot | Spike | ||||||||||
|---|---|---|---|---|---|---|---|---|---|---|---|---|
| F. m. | % | D. m. | % | F. m. | % | D. m. | % | F. m. | % | D. m. | % | |
| Treatment (−MPa) | ||||||||||||
| 0.0 (control) | 0.38 | 100 | 0.24 | 100 | 1.93 | 100 | 1.09 | 100 | 2.4 | 100 | 1.17 | 100 |
| −0.3 | 0.26 | 68.4* | 0.18* | 75 | 1.7 | 88.08 | 0.94 | 80.2 | 1.6* | 66.6 | 0.76* | 64.9 |
| −0.6 | 0.17 | 44.7* | 0.1* | 41.7 | 1.65 | 82.9 | 0.85 | 77.9 | 1.30* | 54.2 | 0.54* | 46.2 |
| −0.9 | 0.11 | 28.9* | 0.09* | 37.5 | 1.5 | 77.7 | 0.76 | 69.7 | 1.08* | 45.0 | 0.45* | 38.4 |
| −1.2 | 0.07 | 18.4* | 0.05* | 20.8 | 0.85 | 44.04 | 0.42* | 38.5 | 0.56* | 23.3 | 0.24* | 20.5 |
| Zn (µM) | ||||||||||||
| 0.0+20 | 0.19 | 50* | 0.14* | 58.3 | 1.44* | 74.6 | 0.72* | 66.05 | 1.13* | 47.08 | 0.56* | 47.8 |
| −0.3+20 | 0.42 | 110.5* | 0.26 | 108.3 | 2.76* | 143 | 1.39* | 127.5 | 1.12* | 46.5 | 0.52* | 44.4 |
| −0.6+20 | 0.32 | 88.9* | 0.12* | 50.0 | 2.39* | 123.8 | 1.17* | 117 | 1.1* | 45.8 | 0.48* | 41.0 |
| −0.9+20 | 0.21 | 55.2* | 0.14* | 58.3 | 2.02 | 104 | 0.95* | 87.0 | 0.99* | 41.2 | 0.40* | 34.1 |
| −1.2+20 | 0.21 | 55.2* | 0.14* | 58.3 | 0.62* | 32.1 | 0.33* | 30.2 | 0.50* | 20.8 | 0.21* | 17.9 |
| 0.0+200 | 0.84 | 221.1* | 0.46* | 191.6 | 4.9* | 253.8 | 2.32* | 212.8 | 4.1* | 170.8 | 1.71* | 146.1 |
| −0.3+200 | 0.26 | 68.4* | 0.18* | 75.0 | 1.95 | 101.0 | 1.03 | 94.4 | 2.1 | 87.5 | 1.06* | 90.5 |
| −0.6+200 | 0.24 | 63.1* | 0.17* | 70.8 | 2.1 | 108.8 | 1.16 | 106.4 | 2.0 | 83.3 | 1.0 | 85.5 |
| −0.9+200 | 0.20 | 52.6* | 0.15* | 62.5 | 1.6 | 82.9 | 0.82* | 75.2 | 1.37* | 57.1 | 0.62* | 52.9 |
| −1.2+200 | 0.11 | 28.9* | 0.06* | 25.0 | 0.96* | 49.7 | 0.50* | 45.8 | 0.72* | 30.0 | 0.33* | 28.2 |
| Ni (µM) | ||||||||||||
| 0.0+1 | 0.14 | 36.8* | 0.12* | 50.0 | 1.59* | 82.3 | 0.89 | 81.6 | 1.2* | 50.0 | 0.56* | 47.8 |
| −0.3+1 | 0.16 | 42.1* | 0.13* | 54.2 | 1.69* | 87.8 | 1.0 | 91.7 | 1.6* | 66.7 | 0.75* | 64.1 |
| −0.6+1 | 0.18 | 47.3* | 0.14* | 58.3 | 1.8* | 93.2 | 1.11 | 101.8 | 2.06 | 85.8 | 1.01 | 86.3 |
| −0.9+1 | 0.14 | 36.5* | 0.11* | 43.8 | 1.59 | 82.1 | 0.78* | 71.5 | 1.73* | 72.1 | 0.75* | 64.1 |
| −1.2+1 | 0.09 | 23.6* | 0.07* | 29.1 | 1.37* | 70.9 | 0.86* | 78.8 | 1.4* | 58.3 | 0.75* | 64.1 |
| 0.0+100 | 0.08 | 21.1* | 0.07 | 29.1 | 0.96* | 49.7 | 0.59 | 54.1 | 0.69* | 28.7 | 0.33* | 28.2 |
| −0.3+100 | 0.09 | 23.6* | 0.07 | 29.1 | 1.2* | 62.1 | 0.77 | 70.6 | 0.9* | 37.5 | 0.42* | 35.8 |
| −0.6+100 | 0.07 | 18.4* | 0.06 | 25.0 | 1.3* | 67.3 | 0.84 | 77.1 | 1.23* | 51.2 | 0.57* | 48.7 |
| −0.9+100 | 0.08 | 21.1* | 0.06 | 25.0 | 1.1* | 58.8 | 0.8 | 73.3 | 1.23* | 51.2 | 0.48* | 41.7 |
| −1.2+100 | 0.07 | 18.4* | 0.06 | 25.0 | 0.97* | 50.2 | 0.66 | 60.5 | 0.93* | 38.7 | 0.48* | 41.02 |
| LSD 0.05% | 0.1 | 0.06 | 0.38 | 0.16 | 0.45 | 0.24 | ||||||
Figure 1
Roots and spikes in wheat treated by different NaCl-induced osmotic stress levels with or without Zn (20 and 200 µM) or Ni (1 and 100 µM) supplementation.
The soluble sugar content significantly increased with increasing OSL in roots at a level of 36.9% at −1.2 MPa OSL (Table 2); whereas there was a significant increase in the sugar content of both shoots and spikes with maximum percentage values of 153.6% at −0.3 MPa level and 161.9% at −0.6 MPa level in shoots and spikes, respectively. The soluble protein content (Table 2) significantly increased with increasing OSL in the three tested organs with maximum percentage values of 135.6%, 120.3%, and 15.6%, respectively, at −0.9 MPa level, −0.6 MPa, and −0.3 MPa levels. The treatment of wheat plants with low or high concentrations of Zn or Ni did not significantly change the soluble sugar content of the shoots. In contrast, soluble sugars were markedly accumulated at the −1.2 MPa level with a 79.8% and 109.9% increase, respectively, in plants treated with 20 µM Zn as compared with the corresponding OSL and/or 200 µM Zn as compared with the absolute control. Additionally, mineral nutrient application enhanced the accumulation of amino acids in roots and spikes (Table 3). Amino acid content increased with increasing OSL in both roots and spikes at 140.1% and 121.1%, respectively, whereas a reduction in their accumulation was detected in shoots. Proline content was elevated in both shoots and spikes by 111.6% and 916.6%, respectively (Table 3).
Table 2
Contents of soluble sugars (mg/g dry matter) and soluble protein (mg/g dry matter) in roots, shoots and spikes of wheat treated by different osmotic stress levels with or without Zn (20 and 200 µM) or Ni (1 and 100 µM) supplementation.
| Soluble sugar | Soluble protein | |||||||||||
|---|---|---|---|---|---|---|---|---|---|---|---|---|
| Root | Shoot | Spike | Root | Shoot | Spike | |||||||
| Aver. | % | Aver. | % | Aver. | % | Aver. | % | Aver. | % | Aver. | % | |
| Treatment (−MPa) | ||||||||||||
| 0.0 (control) | 48.2 | 100 | 76.6 | 100 | 30.2 | 100 | 20.2 | 100 | 20.9 | 100 | 24.1 | 100 |
| −0.3 | 34.5* | 71.6 | 117.2 | 153.0 | 46.2* | 152.9 | 22.6* | 111.2 | 38.8* | 185.6 | 26.6* | 110.4 |
| −0.6 | 25.7* | 53.3 | 95.0 | 117.7 | 48.9* | 161.9 | 22.6* | 111.9 | 38.8* | 125.8 | 29.0* | 120.3 |
| −0.9 | 15.8* | 32.8 | 96.4 | 125.8 | 42.2* | 139.7 | 27.6* | 135.6 | 34.4* | 164.6 | 26.4* | 109.5 |
| −1.2 | 17.8* | 36.9 | 31.5 | 41.1 | 40.7* | 134.8 | 27.6* | 128.7 | 30.4* | 145.5 | 28.4* | 117.8 |
| Zn (µM) | ||||||||||||
| 0.0+20 | 13.1* | 27.23 | 81.6 | 106.5 | 35.4* | 116.6 | 26.0* | 128.7 | 32.4* | 155.0 | 24.2 | 100.0 |
| −0.3+20 | 17.5* | 36.3 | 81.6 | 106.5 | 45.8* | 151.7 | 27.2* | 134. | 33.0* | 157.9 | 23.1* | 95.9 |
| −0.6+20 | 18.6* | 38.6 | 81.3 | 106.6 | 57.5* | 190.4 | 22.1* | 109.4 | 32.0* | 153.1 | 34.4* | 142.4 |
| −0.9+20 | 20.9* | 43.4 | 65.2 | 85.1 | 57.8* | 191.4 | 19.0* | 94.1 | 33.8* | 161.2 | 32.6* | 135.3 |
| −1.2+20 | 26.9* | 55.8 | 61.2 | 79.9 | 75.1* | 248.7 | 15.6* | 77.2 | 34.4* | 111.3 | 34.2* | 141.9 |
| 0.0+200 | 10.7* | 22.2 | 107.8 | 139.7 | 51.1* | 169.2 | 26.0* | 128.7 | 37.8* | 180.9 | 24.8* | 102.9 |
| −0.3+200 | 12.2* | 25.3 | 83.4 | 108.9 | 60.7* | 200.9 | 26.8* | 132.7 | 31.8* | 152.2 | 22.6* | 107.8 |
| −0.6+200 | 18.1* | 37.6 | 89.2 | 116.4 | 46.5* | 153.9 | 26.8* | 132.7 | 37.8* | 180.9 | 23.8* | 98.8 |
| −0.9+200 | 22.2* | 46.1 | 89.9 | 117.4 | 47.2* | 156.3 | 28.8* | 145.6 | 34.6* | 165.6 | 20.4* | 101.2 |
| −1.2+200 | 68.3* | 141.7 | 84.2 | 153.3 | 87.6* | 290.1 | 20.2* | 100 | 38.2* | 182.8 | 23.2* | 96.7 |
| Ni (µM) | ||||||||||||
| 0.0+1 | 21.4* | 44.4 | 103.6 | 134.4 | 67.2* | 222.5 | 28.4* | 140.6 | 36.0* | 172.2 | 27.2* | 112.9 |
| −0.3+1 | 25.4* | 52.7 | 77.3 | 100.9 | 85.1* | 281.8 | 26.4* | 130.7 | 28.4* | 135.9 | 27.8* | 133.0 |
| −0.6+1 | 25.2* | 52.3 | 77.2 | 100.7 | 69.2* | 229.2 | 27.0* | 133.7 | 26.4* | 126.3 | 23.8 | 98.8 |
| −0.9+1 | 25.1* | 52.1 | 80.4 | 104.9 | 66.4* | 219.9 | 22.4* | 110.9 | 32.0* | 153.1 | 23.8 | 98.8 |
| −1.2+1 | 26.8* | 55.2 | 78.8 | 102.9 | 88.8* | 294.0 | 22.6* | 111.9 | 31.1* | 148.8 | 23.8 | 98.8 |
| 0.0+100 | 13.8* | 28.6 | 81.4 | 106.3 | 33.1* | 109.6 | 24* | 118.8 | 35* | 167.5 | 21.6* | 89.6 |
| −0.3+100 | 18.1* | 37.6 | 60.6 | 79.1 | 48.6* | 160.9 | 25* | 123.8 | 40.2* | 192.3 | 30.6* | 126.9 |
| −0.6+100 | 33.4* | 69.3 | 51.5 | 67.2 | 44.2* | 146.4 | 28.8* | 145.6 | 35.0* | 167.5 | 24.2 | 100.4 |
| −0.9+100 | 29.4* | 60.9 | 45.5 | 59.4 | 58.4* | 193.4 | 24.2* | 119.8 | 35.0* | 167.5 | 24.2 | 100.4 |
| −1.2+100 | 20.2* | 41.9 | 40.3 | 52.6 | 65.3* | 216.2 | 19.6* | 98.0 | 31.6* | 151.9 | 23.1* | 95.9 |
| LSD 0.05% | 0.4 | 0.16 | 0.6 | 0.4 | 0.17 | 0.6 | ||||||
Table 3
Amino acids (mg/g dry matter) and proline (mg/g dry matter) content in roots, shoots and spikes of wheat treated by different osmotic stress levels with or without Zn (20 and 200 µM) or Ni (1 and 100 µM) supplementation.
| Amino acids | Proline | |||||||||||
|---|---|---|---|---|---|---|---|---|---|---|---|---|
| Root | Shoot | Spike | Root | Shoot | Spike | |||||||
| Aver. | % | Aver. | % | Aver. | % | Aver. | % | Aver. | % | Aver. | % | |
| Treatment (−MPa) | ||||||||||||
| 0.0 (control) | 10.7 | 100 | 10.7 | 100 | 5.32 | 100 | 0.13 | 100 | 0.3 | 100 | 0.06 | 100 |
| −0.3 | 15.5* | 145.4 | 12.1* | 112.7 | 6.5* | 122.1 | 0.06* | 46.1 | 0.22 | 73.3 | 0.18* | 300 |
| −0.6 | 13.5* | 126.6 | 8.7* | 81.2 | 6.96* | 130.8 | 0.07* | 53.8 | 0.26 | 86.6 | 0.34* | 566.6 |
| −0.9 | 12.6* | 117.7 | 10.5* | 97.8 | 6.59* | 123.8 | 0.09 | 69.2 | 0.54 | 180.0 | 0.50* | 833.3 |
| −1.2 | 14.9* | 140.1 | 9.8* | 91.3 | 6.44* | 121.1 | 0.09 | 69.2 | 0.35 | 116.6 | 0.55* | 916.6 |
| Zn (µM) | ||||||||||||
| 0.0+20 | 12.9* | 120.5 | 9.8* | 91.4 | 8.4* | 157.7 | 0.09 | 69.2 | 0.24 | 80.0 | 0.16* | 266.6 |
| −0.3+20 | 17.2* | 161.7 | 8.3* | 77.4 | 8.4* | 157.7 | 0.12 | 92.3 | 0.25 | 43.3 | 0.22* | 366.7 |
| −0.6+20 | 12.6* | 118.1 | 8.5* | 79.4 | 10.6* | 199.2 | 0.12 | 92.3 | 0.27 | 90.0 | 0.27* | 450.0 |
| −0.9+20 | 12.6* | 118.0 | 9.9* | 91.9 | 14.4* | 270.6 | 0.12 | 92.3 | 0.27 | 90.0 | 0.37* | 616.6 |
| −1.2+20 | 11.8* | 110.3 | 7.0* | 65.5 | 6.8* | 112.8 | 0.12 | 92.3 | 0.24 | 80.0 | 0.47* | 783.3 |
| 0.0+200 | 15.2* | 142.9 | 9.2* | 85.4 | 6.4* | 119.5 | 0.01* | 73.1 | 0.26 | 86.6 | 0.19* | 316.6 |
| −0.3+200 | 15.9* | 149.9 | 5.2* | 48.9 | 6.0* | 113.3 | 0.13 | 100 | 0.27 | 90.0 | 0.07 | 116.6 |
| −0.6+200 | 11.5* | 107.6 | 6.3* | 59.1 | 6.0* | 113.3 | 0.12 | 92.3 | 0.26 | 86.6 | 0.11* | 183.3 |
| −0.9+200 | 12.7* | 119.5 | 7.4* | 69.3 | 8.8* | 164.8 | 0.12 | 92.3 | 0.25 | 83.3 | 0.41* | 683.3 |
| −1.2+200 | 12.4* | 116.0 | 7.8* | 72.4 | 8.3* | 156.2 | 0.07* | 53.8 | 0.25 | 83.3 | 0.41* | 683.3 |
| Ni (µM) | ||||||||||||
| 0.0+1 | 12.9* | 121.3 | 5.9* | 55.1 | 5.7* | 106.5 | 0.08* | 61.5 | 0.17 | 56.6 | 0.12* | 200.0 |
| −0.3+1 | 13.2* | 123.4 | 5.6* | 52.0 | 5.4 | 100.9 | 0.14 | 107.6 | 0.17 | 56.6 | 0.10 | 166.6 |
| −0.6+1 | 14.6* | 137.2 | 6.9* | 64.3 | 5.4 | 100.9 | 0.10 | 76.9 | 0.19 | 63.3 | 0.10 | 166.6 |
| −0.9+1 | 14.6* | 137.2 | 6.0* | 56.3 | 5.2 | 97.7 | 0.11 | 84.6 | 0.23 | 76.6 | 0.14 | 233.3 |
| −1.2+1 | 15.4* | 144.7 | 4.5* | 42.2 | 4.3* | 80.6 | 0.08* | 61.5 | 0.15 | 50.0 | 0.12 | 200.0 |
| 0.0+100 | 12.9* | 121.5 | 6.9* | 63.9 | 4.83* | 90.7 | 0.08* | 61.5 | 0.13 | 43.3 | 0.16 | 266.6 |
| −0.3+100 | 14.6* | 137.2 | 4.8* | 44.8 | 8.31* | 156.2 | 0.09 | 69.2 | 0.27 | 90.0 | 0.34* | 566.6 |
| −0.6+100 | 13.9* | 130.5 | 6.2* | 57.7 | 5.27* | 99.1 | 0.10 | 76.9 | 0.28 | 93.3 | 0.29* | 491.0 |
| −0.9+100 | 13.6* | 127.7 | 5.8* | 53.7 | 5.05* | 94.9 | 0.12 | 92.3 | 0.24 | 80.0 | 0.25* | 416.6 |
| −1.2+100 | 13.1* | 122.8 | 9.9* | 92.4 | 12.5* | 234.0 | 0.13 | 100.0 | 0.25 | 83.3 | 0.25* | 416.6 |
| LSD 0.05% | 0.13 | 0.10 | 0.13 | 0.05 | 0.253 | 0.10 | ||||||
The uptake and partitioning of Na+ and K+ in wheat plants did not vary among the three organs examined under different salt stress intensities and Zn or Ni treatments (Table 4). However, Na+ and K+ content increased with increasing osmotic stress levels. The increase in Na+ was much greater under high osmotic stress (294.8%, 111.5%, and 179.4%) in the roots, shoots, and spikes, respectively. Similarly, the increase in K+ was more pronounced at −1.2 MPa OSL at 195.5%, 104.4%, and 127.7% in the roots, shoots, and spikes, respectively. In turn, the distribution of Na+ and K+ was much higher in the roots than those in the shoots or spikes. Zn and Ni treatments retarded the absorption and, consequently, the accumulation of Na+. In addition, there was a marked increase in Na+ content in plants treated with 200 µM Zn. Consequently, K+ was increased in the roots of control plants and those subjected to −0.3 MPa OSL supplemented with 20 or 200 µM of Zn, while in the spikes, this effect was recorded at all osmotic stress levels. However, Ni treatments with low or high concentrations caused a reduction in K+ content in the spikes. Excluding this trend, there was also an increasing trend in K+ accumulation in the roots (Table 4).
Table 4
Sodium and potassium content (mg/g dry matter) in roots, shoots and spikes of wheat treated by different osmotic stress levels with or without Zn (20 and 200 µM) or Ni (1 and 100 µM) supplementation.
| Na++ | K++ | |||||||||||
|---|---|---|---|---|---|---|---|---|---|---|---|---|
| Root | Shoot | Spike | Root | Shoot | Spike | |||||||
| Aver. | % | Aver. | % | Aver. | % | Aver. | % | Aver. | % | Aver. | % | |
| Treatment (−Mpa) | ||||||||||||
| 0.0 (control) | 4.68 | 100 | 3.29 | 100 | 1.26 | 100 | 2.24 | 100 | 10.4 | 100 | 5.0 | 100 |
| −0.3 | 6.58* | 140.5 | 2.78 | 84.4 | 1.5 | 120.6 | 2.9 | 129.0 | 11.6 | 111.6 | 6.72 | 133.3 |
| −0.6 | 8.0* | 170.9 | 3.42 | 103.9 | 2.0 | 160.3 | 3.0 | 133.9 | 11.4 | 109.8 | 6.5 | 129.5 |
| −0.9 | 9.0* | 192.3 | 3.67 | 111.5 | 2.3 | 179.4 | 3.2 | 143.8 | 10.8 | 104.4 | 5.7 | 112.8 |
| −1.2 | 13.8* | 294.8 | 3.67 | 111.5 | 2.3 | 179.4 | 4.4 | 195.5 | 10.8 | 104.4 | 6.4 | 127.7 |
| Zn (µM) | ||||||||||||
| 0.0+20 | 5.8 | 124.5 | 2.7 | 80.8 | 1.01 | 80.1 | 2.9 | 129.0 | 11.6 | 111.6 | 5.2 | 103.5 |
| −0.3+20 | 5.8 | 124.5 | 2.8 | 84.4 | 1.4 | 110.3 | 2.9 | 133.0 | 12.0* | 115.4 | 5.2 | 103.5 |
| −0.6+20 | 5.8 | 124.5 | 2.0 | 61.3 | 1.5 | 120.6 | 2.7 | 120.5 | 9.6 | 92.6 | 5.9 | 116.6 |
| −0.9+20 | 8.5* | 181.1 | 1.9* | 57.7 | 1.9 | 150.7 | 2.8 | 125.0 | 4.5* | 43.5 | 5.2 | 103.5 |
| −1.2+20 | 12.0* | 257.1 | 1.9* | 57.7 | 2.0 | 160.3 | 3.5 | 154.0 | 8.8* | 84.6 | 7.0* | 138.8 |
| 0.0+200 | 6.7* | 143.3 | 2.9 | 88.4 | 1.64 | 130.1 | 2.9 | 129.0 | 13.3* | 127.8 | 6.1 | 120.2 |
| −0.3+200 | 6.8* | 146.1 | 3.5 | 107.5 | 1.2 | 100 | 3.0 | 136.4 | 12* | 115.4 | 6.8 | 136.0 |
| −0.6+200 | 8.6* | 182.9 | 7.5* | 227.1 | 1.0 | 80.14 | 2.6 | 115.2 | 10.3* | 99.0 | 7.0* | 138.8 |
| −0.9+200 | 10* | 213.6 | 4.2 | 127.1 | 1.0 | 80.1 | 2.0 | 116.1 | 9.3 | 90.1 | 6.1 | 121.2 |
| −1.2+200 | 8.2* | 175.8 | 3.7 | 111.5 | 1.4 | 110.3 | 2.6 | 116.1 | 10.7 | 90.1 | 5.2 | 103.5 |
| Ni (µM) | ||||||||||||
| 0.0+1 | 4.0 | 85.5 | 1.6 | 49.8 | 1.0 | 80.1 | 4.4 | 195.5 | 9.6 | 92.7 | 5.7 | 112.8 |
| −0.3+1 | 4.5 | 67.4 | 2.5 | 76.8 | 1.0 | 80.1 | 2.6 | 116.5 | 7.7* | 73.8 | 5.4 | 107.3 |
| −0.6+1 | 7.9* | 167.7 | 3.4 | 103.9 | 1.6 | 130.1 | 2.2 | 100.0 | 6.4* | 62.1 | 5.6 | 111.1 |
| −0.9+1 | 7.9* | 167.7 | 3.2 | 96.0 | 1.8 | 140.4 | 2.3 | 102.0 | 9.6 | 91.7 | 5.2 | 103.5 |
| −1.2+1 | 8.9* | 192.1 | 1.8* | 53.7 | 1.6 | 130.1 | 2.3 | 104.0 | 7.3* | 70.2 | 5.8 | 114.6 |
| 0.0+100 | 5.0 | 106.8 | 2.4 | 72.9 | 0.88 | 69.8 | 2.6 | 116.5 | 12.6* | 121.6 | 4.1 | 81.3 |
| −0.3+100 | 5.4 | 116.2 | 1.4* | 42.5 | 0.9 | 71.4 | 3.2 | 141.5 | 5.7* | 54.9 | 6.5* | 129.5 |
| −0.6+100 | 8.9* | 189.3 | 1.4* | 42.2 | 1.14 | 90.4 | 3.2 | 141.5 | 8.5* | 81.9 | 4.2* | 83.3 |
| −0.9+100 | 8.9* | 189.3 | 1.1* | 34.6 | 1.77 | 140.4 | 3.2 | 145.5 | 6.1* | 58.4 | 4.9 | 98.0 |
| −1.2+100 | 5.4 | 116.2 | 1.0* | 30.6 | 1.64 | 130.1 | 1.6 | 70.5 | 4.8* | 45.9 | 4.9 | 98.0 |
| LSD 0.05% | 1.4 | 1.5 | 1.0 | 1.4 | 1.2 | 1.2 | ||||||
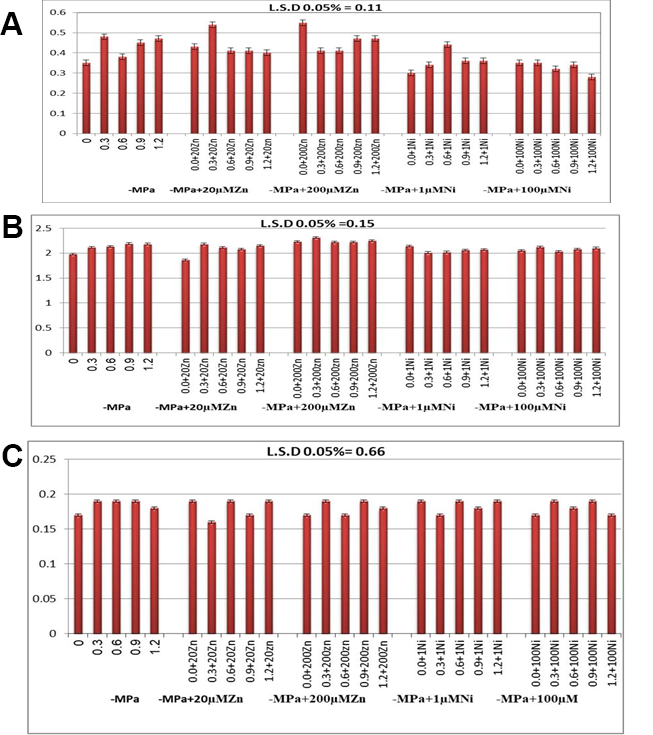
In wheat, the concentrations of anthocyanins were significantly increased at all osmotic stress levels, for example, by 134.3% at −1.2 MPa. However, their accumulation did not change significantly with increasing OSL levels in plants supplemented with Zn or Ni (Figure 2A). In turn, AsA levels were enhanced in the wheat cv. Gimiza 11 was subjected to osmotic stress, with a percentage increase of 110.1% at −12 MPa (Figure 2B). Generally, AsA accumulation did not change with either low or high concentrations of Zn or Ni, except for treatment with 200 µM Zn, when the content of AsA significantly increased. The percentage of increase at −1.2 MPa OSL plus 200 µM Zn was 113.6% compared with the corresponding OSL (110.1%). Total flavonoid concentrations were smoothly increased and provide the same percent value at −0.3 and –0.9 MPa OSL (111.7%) (Figure 2C). Additionally, they were almost of the same value in the control plants and in those grown at −0.6 MPa or −1.2 MPa OSL. The accumulation of flavonoids did not change significantly under mineral treatment with either Zn or Ni in the tested plants compared with that in the control plants (Figure 2C).
. Discussion
The mechanisms of salt tolerance in wheat plants vary, depending on their organs. The differences in osmotic stress tolerance were accompanied by distinct variations in organic and inorganic solutes, which consequently promoted differences in plant water status (conservation and utilization). This response was revealed in the production of fresh and dry matter from roots, shoots, and spikes. Fresh and dry matter were reduced with percentage values of 68.4%, 75.0%, 88.1%, 86.2%, 66.6%, and 64.9%, respectively, at −0.3 MPa OSL compared with those in the control (100%). This reduction was greater at high osmotic stress levels of −1.2 MPa OSL, with percentages of 18.4%, 20.8%, 44.0%, 35.5%, 23.3%, and 20.5%, respectively, that is, spike production at low OSL was approximately 65%, whereas at high OSL it was only 20%. The harmful effect of salinity on growth parameters can be attributed mainly to the osmotic effect of water deficits (Abd El-Samad & Mostafa, 2018; Vahid Dastjerdi et al., 2021). In addition, the reduction in yield may be attributed to the damaging effect of inorganic ions due to salinity stress and nutrient equilibrium disorder in root media (Meng et al., 2018) and/or decreased rate of novel cell formation, which may contribute to the inhibition of growth (Baek et al., 2016). The reduction in growth criteria due to water stress might be linked to disturbance of the water stream from root to shoot (Woodruff & Meinzer, 2011), decrease in osmotic potential of the cell sap (Ribaut & Pilet, 1991), or reduction in cell division (Bracale et al., 1997). However, plants under saline conditions can change their metabolism to overcome adverse changes in environmental conditions (Benabderrahim et al., 2020; Koselski et al., 2019).
Based on the presented results, it is worth noting that the roots had a lower tolerance to salt than did the shoots or spikes (i.e., the root was the most sensitive organ, the shoot was the most tolerant, and the spike was the intermediate). The sensitivity of the roots to salt stress coincided with reduced levels of soluble proteins and proline. However, the relatively high salt tolerance of shoots was related to an increase in soluble sugar, proline, and K+ concentrations. Additionally, the intermediate salinity tolerance of the spike correlated with an increase in soluble sugars, soluble proteins, free amino acids, proline, and K+ concentrations. Abd El-Samad et al. (2017) and Abd El-Samad, Shaddad, and Ragaey (2019) stated that the sensitivity of roots was related to the reduction in fresh, dry matter, length, soluble sugar, water uptake, and K+ accumulation in the cell sap. In moderately sensitive organs (spikes), the reduction in fresh and dry matter and length was associated with the accumulation of soluble sugars and a huge accumulation of soluble proteins. In turn, there was a relatively high water content in the shoot, which in turn induced an increase in soluble protein and K+ content. In addition, the present results are in agreement with the investigation of Benabderrahim et al. (2020) that concerned the genetic diversity of salt tolerance in 36 alfalfa genotypes in continental and coastal regions under salt stress of 150 mM NaCl. Twelve tolerance traits were recorded: fresh and dry matter biomass, stem length, leaf number, Na+, K+, K+/Na+ ratio, catalase and superoxide dismutase activities, and protein and reducing sugar content.
The sodium content of wheat increased with OSL intensification. The percentage increase of Na+ in roots, shoots, and spikes at −1.2 MPa OSL was 294.3%, 118.5%, and 169.81%, respectively. It is worth emphasizing that Na+ was greater accumulated in the roots of wheat plants that in other tested organs. This probably resulted from the lowering of Na+ translocation to aboveground organs, therefore providing this cultivar with the ability to tolerate osmotic stress injury. This statement is also supported by studies by Abd El-Samad and Shaddad (2016) and Zhao et al. (2021).
It was further concluded that Na+ accumulation in the three organs coincided with the increase in K+ levels in both shoots and spikes. This was confirmed by the observation that the genes responsible for Na+ uptake had a positive effect on K+ uptake, that is, although there was an increase in Na+ concentration, there was an increasing effect on K+ accumulation, which partially reversed the antagonistic effect of Na+ on K+ uptake in the tested plants. Alfocea et al. (1993), Abd El-Samad and Shaddad (2016), and Abd El-Samad, Shaddad, and Ragaey (2019) reported that K+ nutrition is not affected by excessive Na+ in salt-tolerant tomato, wheat, and broad bean. This situation was interpreted by Garcia et al. (1997), who reported that in rice, there was no correlation between K+ and Na+ transport, and concluded that the genes affecting Na+ uptake were not apparently related to those involved in K+ uptake. However, this situation contrasts with that observed in Triticeae (Gorham, 1990).
Proline levels increased at high OSL levels in the shoots of wheat and reached 180% over the control value (100%). Moreover, a significant increase in this amino acid level was noted in spikes (ninefold higher than that of control plants) under intensification of OSL, whereas proline accumulation decreased in the roots. Proline accumulation plays a role in osmoregulation and provides plants with higher osmotic stress tolerance. Correspondingly, the data showed that there was a close relationship between Na+ and proline concentrations and dry matter yield in the three tested organs. The roots had a higher ability to accumulate Na+ than did the shoots or spikes. The roots did not affect proline accumulation, and the percentage increase in proline concentrations at −1.2 MPa OSL was 69.2%, 180.0%, 916.6% in the roots, shoots, and spikes, respectively. Correspondingly, the organ that accumulates Na+ most efficiently was the root and the organ in which the increase of proline was the highest was the spike (ninefold higher than that in control plants). This can lead to a reduction in Na+ toxicity in the aboveground organs, and the osmoregulatory role of proline may be connected with the higher tolerance features of wheat. The relationship between Na+ and proline content resulted in lower root dry matter with 29.2% at −1.2 MPa OSL. This was confirmed by Abd El-Samad (2016), who reported an increase in Na+ and proline concentration in maize, wheat, broad bean, cotton, and parsley, which indicated that proline content may act as an indicator of Na+ uptake and allow the identification of tolerant plant species, which effectively excludes Na+ from plants either by exclusion or compartmentalization. In maize and cotton, while Na+ increased in the shoots and roots, proline content decreased in these organs. This was concomitant with a reduction in the dry matter of both organs of these species. Sodium can be considered as an osmotic stress marker component in these plants, especially in the shoots of cotton. The percent accumulation of proline in both organs of wheat, parsley, and shoots of broad bean was concomitant with the reduction in dry matter of these plants. This strategy of proline and dry matter accumulation is associated with an increase in the Na+ content in these plants (Babu et al., 2012; Majid et al., 2012).
Antioxidant compounds, including anthocyanin pigments, l-ascorbic acid, and flavonoids, were expressed at variable concentrations in wheat plants. Anthocyanins and l-ascorbic acid were significantly increased as the level of osmotic stress increased; the percentage increase at −1.2 MPa OSL was 134.2% and 110.1%, respectively, compared to those in the control plants. It can be concluded that the accumulation of these antioxidant compounds increased in the tested plants, allowing them to tolerate osmotic stress. The enhancement in growth parameters coincided with the increase in soluble sugar content at high OSL in the roots with Zn or Ni treatment, and at higher OSL with 20 µM or 200 µM Zn in spikes and roots.
At the vegetative and crop yield stages, the presented results in wheat suggest that mineral treatments induced, in most cases, an enhancement effect on the fresh and dry matter of roots, shoots, and spikes. This increasing trend in growth parameters under treatment with Zn or Ni mostly coincided with an increase in soluble sugar concentration in roots and shoots at high OSL and spikes at all OSL. In addition, the soluble protein accumulation in roots and spikes of plants exposed to osmotic stress plus 20 µM of Zn, as well as amino acid levels in both roots and spikes, were increased.
These enhancement effects increased the salt tolerance of wheat plants under osmotic stress or with mineral treatments. This statement was confirmed by the results obtained by Saeidnejad et al. (2016) and Tolay (2021). Moreover, Manivasagaperumal et al. (2011) reported that the amino acid and protein contents were high at low Zn concentrations (10 and 25 mg/L), after which the values decreased. This inhibition might be due to the binding of metals with the sulfhydryl group of proteins, producing deleterious effects in the normal protection form. In our experiments, proline levels were markedly decreased in shoots and spikes under OSL plus mineral nutrient application. This reduction was associated with the enhanced effect of Zn or Ni on dry matter production and the amelioration of harmful osmotic stress. Jamalomidi et al. (2006) showed that free proline accumulation was significantly lower in genotypes treated with Zn than that in non-treated genotypes. Iqbal (2018) indicated that salinity enhanced the accumulation of amino acids and proline under foliar application of Zn in Zea mays. Mahmoud et al. (2020) demonstrated that the soil application of nanoparticles (zinc, boron, silicon, and zeolite) enhanced the content of proteins, proline, carbohydrates, antioxidants, and peroxidase (POD) activity in tomato tubers and increased micronutrient uptake (N, P, Ca, Zn, and B), thereby increasing plant growth and yield by alleviating the harmful effects of salinity. Parlak (2016) and Stetsenko et al. (2017) reported that Ni application with salinity-stimulated proline and polyamine synthesis resulted in improved plant protection. The results indicated that the increase in the activities of antioxidant enzymes was not sufficient to protect the cell membranes against Ni toxicity.
Correspondingly, Zn and Ni treatments generally increased anthocyanin accumulation. Moreover, l-ascorbic acid displayed an enhancement trend under 200 µM Zn treatment. This enhancement in the concentration of antioxidant compounds can increase the efficacy of wheat plants in ameliorating osmotic stress injury and completing their life cycle. This was confirmed by Chunthaburee et al. (2016), who revealed that higher accumulation of anthocyanins may be a protective physiological trait under salt stress. Therefore, the rice cultivar with a deep purple leaf color suffered from less severe cellular damage and lower growth reduction under salt stress compared with cultivars with less intense anthocyanin accumulation. Many low molecular weight antioxidant substances, such as AsA, are also involved in ROS detoxification in halophytes (Abd El-Samad, Shaddad, & Ragaey, 2019; Chakhchar et al., 2015). Hameed et al. (2015) reported that shoot growth of Limonium stocksii plants was inhibited at high salinity and coincided with higher levels of lipid peroxidation. Additionally, leaf osmolality progressively increases to maintain cell osmobalance. Ascorbic acid-dependent antioxidant enzymes contributed to the increased salinity resistance, as evidenced by the increasing levels of AsA.
In agreement with the above results, wheat treated with either Zn or Ni under salt exposure showed the following results:
Na+ and free proline contents retarded considerably in both plant organs.
The amount of inorganic compatible solutes (K+) generally increased.
The accumulation of organic compatible solutes (soluble carbohydrates, soluble proteins, and amino acids) was markedly enhanced, which could increase the water status and consequently improve the dry matter yield when compared with that in salinized plants.
Accumulation of anthocyanins, l-ascorbic acid, and flavonoids was generally increased and contributed to osmotic tolerance of wheat plants.
