Introduction
Rice, a major food crop, is believed to be the source of more than one fifth of the calories consumed globally. India is the second largest producer of rice, and also a leading consumer of rice in the world (Lahkar & Tanti,2018). Because the cultivation of rice depends on the availability of water, farmers have to resort to various means of irrigation during dry seasons in order to maintain production. Groundwater is one of the popular means of irrigation and used widely across India (Hore et al.,2017; Nahar et al.,2016). However, the use of groundwater for irrigation exposes the crops to the danger of being contaminated by toxic heavy metals, such as arsenic (Lahkar et al.,2019; Pradhan et al.,2019; Shandilya & Tanti,2019).
Arsenic is present in soil in the form of minerals, such as realgar and arsenopyrite, where its content is mostly dependent on the parent rock (Mandal & Suzuki,2002). Natural factors such as weathering and microbial activities, and anthropogenic activities such as mining and heavy extraction of groundwater, lead to the mobilization of arsenic and its bioavailability in the soil in various organic and inorganic forms (Barringer & Reilly,2013; Bentley & Chasteen,2002; Smedley,2008; Woolson,1977). The inorganic forms of arsenic in soil are arsenite (As3+) under reducing conditions and arsenate (As5+) under oxidizing conditions, which can be converted to organic forms (e.g., monomethyl arsenate or dimethyl arsenate) by soil microbes (Mandal & Suzuki,2002). The amount of the organic forms of arsenic in soil is less significant compared with that of the inorganic forms (Smedley & Kinniburgh,2002).
As a toxic metalloid, arsenic exerts deleterious effects on rice crops (Kalita et al.,2018). Owing to water logging and the reducing nature of rice fields during important times of the agricultural cycle, As3+ is the most dominant species of arsenic affecting rice (Panaullah et al.,2009). The uptake of arsenic by rice plants depletes their chlorophyll content and thereby the rate of photosynthesis, which vigorously affects root and shoot growth as well as the grain yield (Halim et al.,2014). Straighthead, a physiological disorder characterized by floret/spikelet sterility, yield reduction, and even panicle formation retardation, results from the effects of arsenic toxicity in rice (Rahman et al.,2007).
With the groundwater arsenic content in several districts of Assam (India) increasing, the arsenic tolerance of various rice cultivars being cultivated throughout the state needs to be determined (Singh,2004). In this study, we examined various morphological and physiological responses of a few traditional rice cultivars of Assam to arsenic stress in an attempt to determine their tolerance or susceptibility to the element and to provide a basis for further biochemical and molecular investigations.
Material and Methods
Plant Material and Experimental Conditions
Seeds of 23 traditional rice cultivars were collected from the 6different agroclimatic zones of Assam (Table 1). The seeds were surface sterilized using 0.1% HgCl2 and germinated on distilled H2O-soaked cotton in Petri dishes placed under diffused light. Uniform seedlings were grown hydroponically, using Yoshida medium (25 mL of medium per seedling) at pH 5.8 (Yoshida,1976), for 7 days at 25–28 °C in a photoperiod-controlled chamber (16 hr light to 8 hr dark), with fresh medium replacement every second day. After 7 days of acclimatization, the medium was supplemented with NaAsO2, with the arsenic concentration being maintained at 0.5 mg/L (6.67 μM) or 0.8 mg/L (10.67 μM), and the seedlings were allowed to grow for another 10 days under similar growing conditions as described above. Three replicates were maintained for each arsenic concentration, and untreated plants were used as the control. After 10 days of treatment, five plants were randomly selected from each replica and used for recording the study parameters.
Table 1
Collected rice cultivars, assigned laboratory codes, and collection zones.
Screening of Rice Cultivars for Their Response to Arsenic
Growth
Plant growth was determined in terms of the root and shoot lengths, root and shoot fresh weights, and root and shoot dry weights. The lengths were measured in centimeters with the help of a metric scale. The fresh weight was measured in grams, using an electronic balance. After measurement of the fresh weights, the root and shoot tissues were heat dried in a hot air oven at 80 °C for 72 hr and then weighed again for obtaining the dry weight.
Chlorophyll Content
The chlorophyll content was determined by using a standard formula (Kapoor & Pande,2015). In brief, 300 mg of fresh leaf tissue was crushed in 5 mL of 80% acetone solution using a mortar and pestle, and the sediments were allowed to settle for a few hours. The absorbance of the supernatant was recorded at 663 and 645 nm, to measure the contents of chlorophyll a, chlorophyll b, and total chlorophyll using standard formulas.
Relative Water Content
The relative water content of the leaves was determined by using a standard formula (Smart & Bingham,1974). Fresh weight of freshly cut leaves was first measured on an electronic balance and the leaves were then kept submerged in deionized water for 4 hr under diffused light. The turgid leaves were then weighed again to obtain the turgor weight. Thereafter, the leaves were dried in a hot air oven at 80 °C for 72 hr and weighed to obtain their dry weight. The relative water content of the leaves was then calculated using the following formula:
where FW = fresh weight, DW = dry weight, and TW = turgor weight.
Arsenic Stress Response Index
The impact of the arsenic treatment on the rice seedlings was determined in terms of the percentage change in the value of the recorded parameter under the treatment relative to the value of the control, using the following formula:
where CP = percentage change in parameter value, VT = value of the parameter in the treatment, and VC = value of the parameter in the control.
In order to compare the percentage changes in the values of the different parameters recorded, the ranges of percentage change values of those parameters were homogenized to determine the “relative effect of stress on a particular parameter,” using the following formula:
where ER = relative effect of stress on a parameter and RCP = range of CP in the parameter among all cultivars.
The mean of the ER values of all parameters of a cultivar under a particular treatment was considered as the “stress response index” of the cultivar at that treatment.
Statistical Analysis
Experiments were performed in a completely randomized design with three replicates, and the results were calculated as the mean ± SE. The correlations among different growth parameters under arsenic stress were calculated and presented as a Pearson correlation matrix along with significant differences at the 0.05, 0.01, and 0.001 levels, using Microsoft Excel 2007. Cluster analysis of the 23 rice varieties, based on the stress response index at 0.8 mg/L arsenic, was carried out using the XLSTAT (ver. 2017) statistical package. Duncan’s multiple-range test was carried out on the percentage changes of the parameters upon arsenic treatment, using XLSTAT (ver. 2019) (Lahkar & Tanti,2017).
Results
Growth Parameters in Response to Arsenic Stress
Shoot and Root Lengths
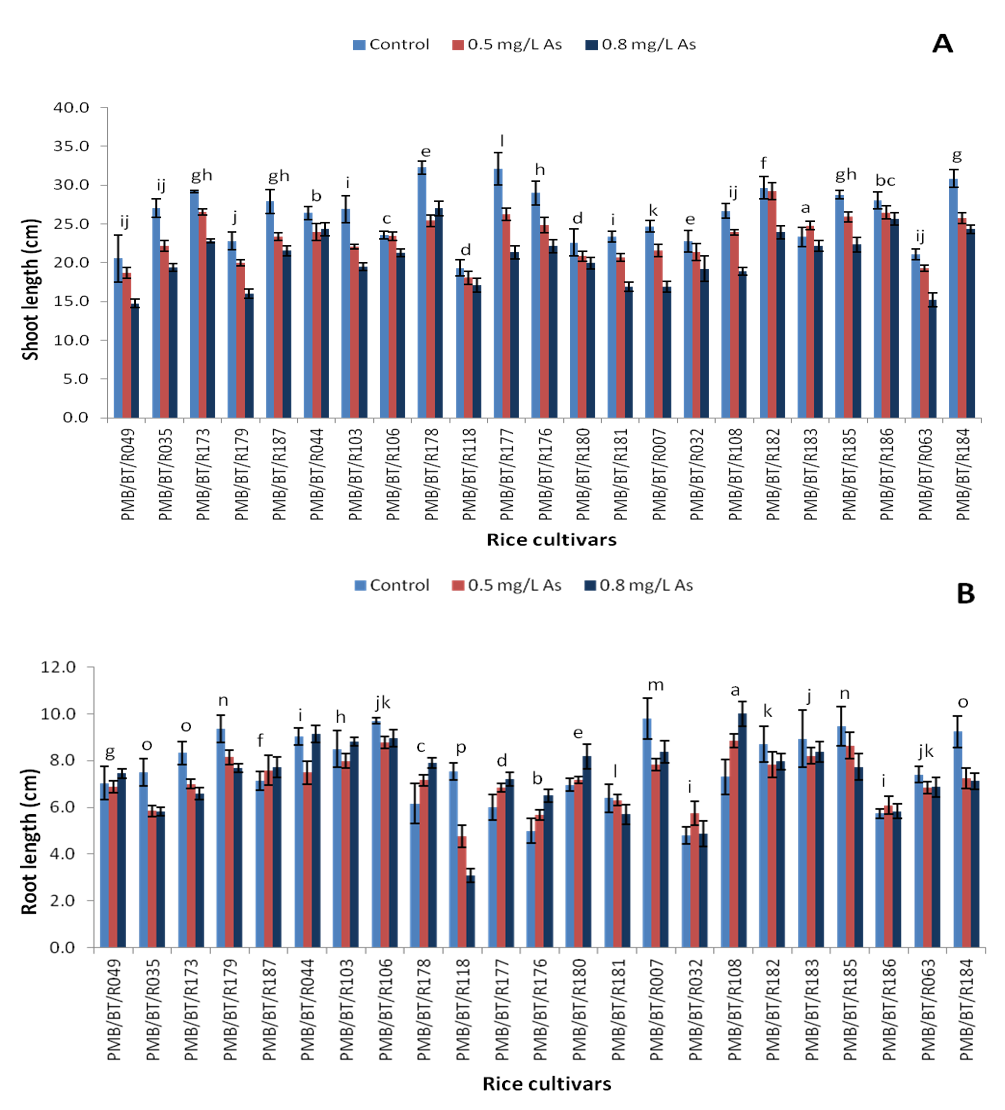
The growth of the shoots was severely affected under arsenic stress (Figure 1A). The shoot lengths of all cultivars decreased at the high arsenic concentration, whereas the change in root length (Figure 1B) varied among the cultivars under the stress. ‘Monasali’ (PMB/BT/R186) showed the longest shoot length at the high arsenic concentration, followed by ‘Maiju Hankar’ (PMB/BT/R184) and ‘Lota Sali’ (PMB/BT/R044). The shortest shoot length was exhibited by ‘Ijong’ (PMB/BT/R049). The longest root length at the high arsenic concentration was shown by ‘Ijong’ (PMB/BT/R108), followed by ‘Lota Sali’ and ‘Ranjit’ (PMB/BT/R106). ‘Biyoi Sali’ (PMB/BT/R118) showed the shortest root length at the high arsenic concentration.
The highest decrease in the shoot length at the high arsenic concentration was observed in ‘Tora Sali’ (PMB/BT/R177), whereas the lowest decrease was observed in ‘Chanmoni’ (PMB/BT/R183), followed by ‘Lota Sali’ (PMB/BT/R044) and ‘Monasali’ (PMB/BT/R186). The root length increased in many cultivars at the high arsenic concentration, where ‘Ijong’ (PMB/BT/R108) showed the highest increase, followed by ‘Birohi Dhan’ (PMB/BT/R176) and ‘Doom Sali’ (PMB/BT/R178). By contrast, ‘Biyoi Sali’ (PMB/BT/R118) showed the highest decrease in the root length at the high arsenic concentration.
Figure 1
Shoot lengths (A) and root lengths (B) (in cm) under arsenic stress. Data are presented as the mean ± SE; n = 3.
Columns topped by the same letter(s) indicate that the percentage changes in the parameter values of the represented cultivars at the 0.8 mg/L arsenic concentration do not differ significantly at the 5% level according to Duncan’s multiple-range test.
Shoot and Root Fresh and Dry Weights
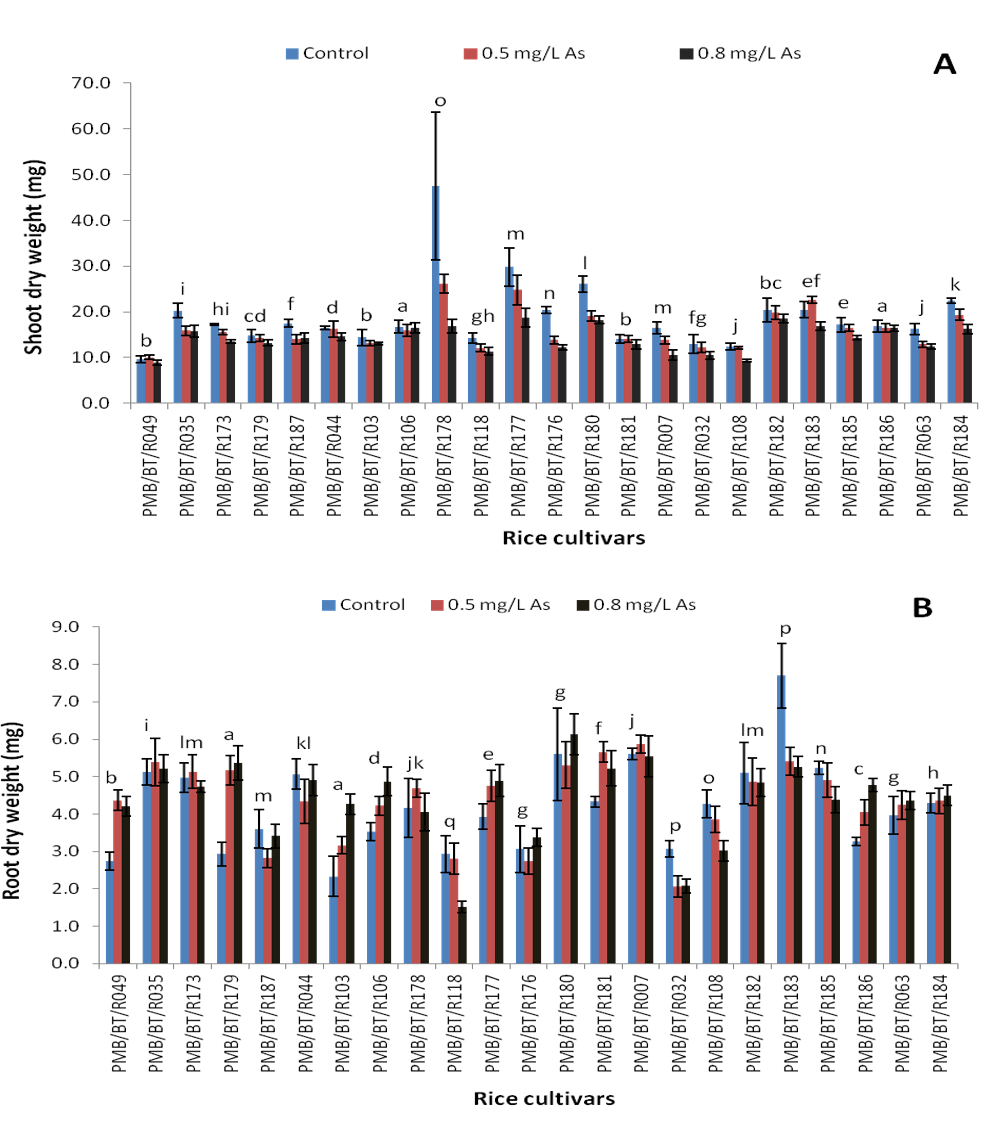
Arsenic severely affected the growth of shoots, reducing the fresh and dry weights considerably in most cultivars (Figure 2A and Figure 3A). At the high arsenic concentration, the heaviest shoot fresh weight was shown by ‘Maiju Hankar’ (PMB/BT/R184), followed by ‘Chanmoni’ (PMB/BT/R183) and ‘Doom Sali’ (PMB/BT/R178). The heaviest shoot dry weight was exhibited by ‘Doom Sali,’ ‘Tora Sali’ (PMB/BT/R177), and ‘Chanmoni. Ijong’ (PMB/BT/R049) showed the lightest shoot fresh and dry weights at the high arsenic concentration. However, different cultivars showed varying responses to arsenic in terms of root growth (Figure 2B and Figure 3B). ‘Baismuthi’ (PMB/BT/R007) showed the heaviest root fresh weight, followed by ‘Jaya’ (PMB/BT/R180) and ‘Boro’ (PMB/BT/R181). ‘Jaya,’ ‘Baismuthi,’ and ‘Kethakeni boni’ (PMB/BT/R179) showed the heaviest root dry weight under the high arsenic concentration. ‘Biyoi Sali’ (PMB/BT/R118) showed the lightest root fresh and dry weights under the high arsenic concentration.
The lowest decrease in the shoot fresh weight was observed in ‘Monasali’ (PMB/BT/R186), whereas the highest decrease was observed in ‘Birohi Dhan’ (PMB/BT/R176). The lowest decrease in the shoot dry weight was observed in ‘Ranjit’ (PMB/BT/R106), followed by ‘Monasali’ (PMB/BT/R186), whereas the highest decrease was observed in ‘Doom Sali’ (PMB/BT/R178).The root fresh and dry weights increased under the high arsenic concentration in many cultivars. ‘Masuri’ (PMB/BT/R103) and ‘Monasali’ (PMB/BT/R186) showed the highest increases in root fresh weight at the high arsenic concentration, whereas ‘Biyoi Sali’ (PMB/BT/R118) showed the highest decrease. With regard to the root dry weight, ‘Kethakeni Boni’ (PMB/BT/R179) and ‘Masuri’ (PMB/BT/R103) showed the highest increase, whereas ‘Biyoi Sali’ (PMB/BT/R118) showed the highest decrease.
Figure 2
Shoot (A) and root (B) fresh weights (mg) under arsenic stress. Data are presented as the mean ± SE; n = 3.
Columns topped by the same letter(s) indicate that the percentage changes in the parameter values of the presented cultivars under 0.8 mg/L arsenic stress do not differ significantly at the 5% level according to Duncan’s multiple-range test.
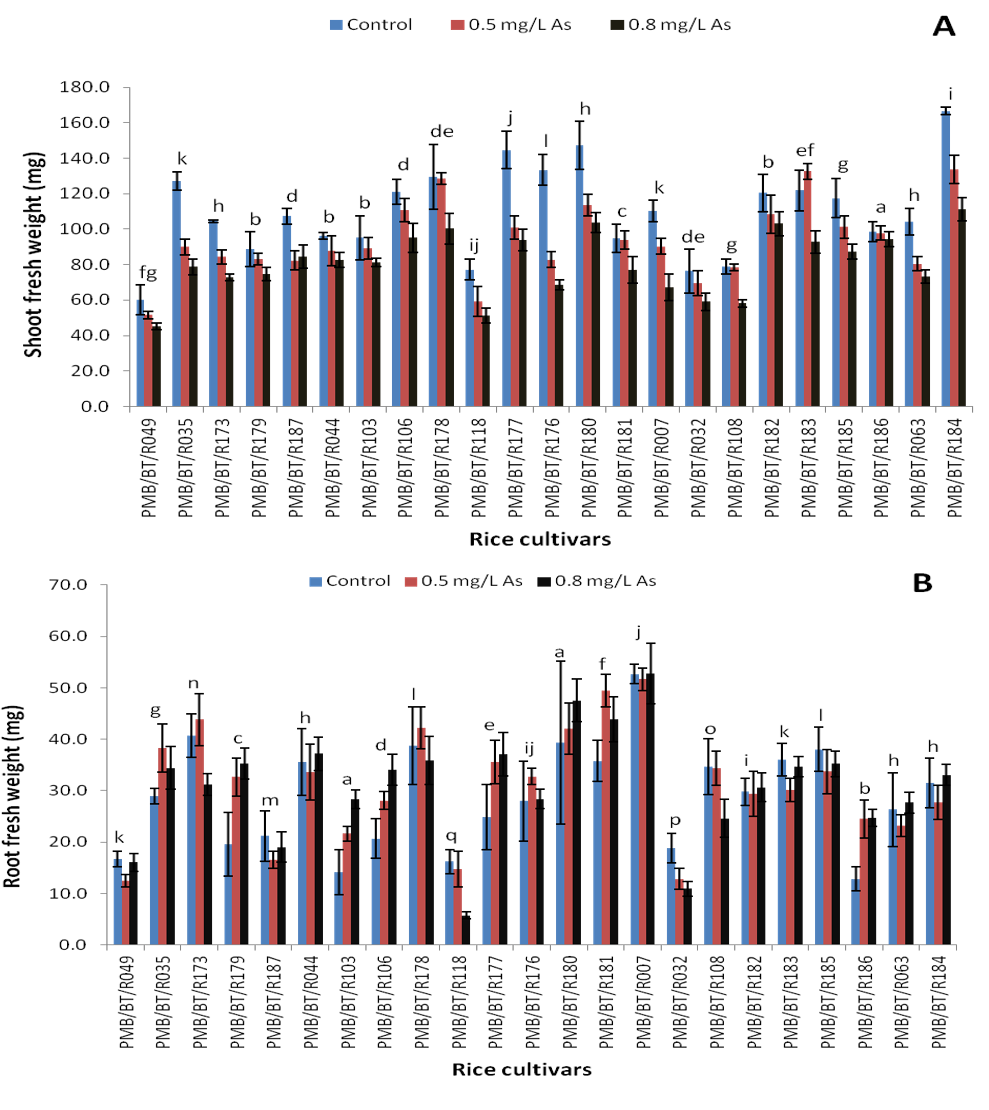
Figure 3
Shoot (A) and root (B) dry weights (mg) under arsenic stress. Data are presented as the mean ± SE; n = 3.
Columns topped by the same letter(s) indicate that the percentage changes in the parameter values of the presented cultivars under 0.8 mg/L arsenic stress do not differ significantly at the 5% level according to Duncan’s multiple-range test.
Physiological Parameters in Response to Arsenic Stress
Chlorophyll Content
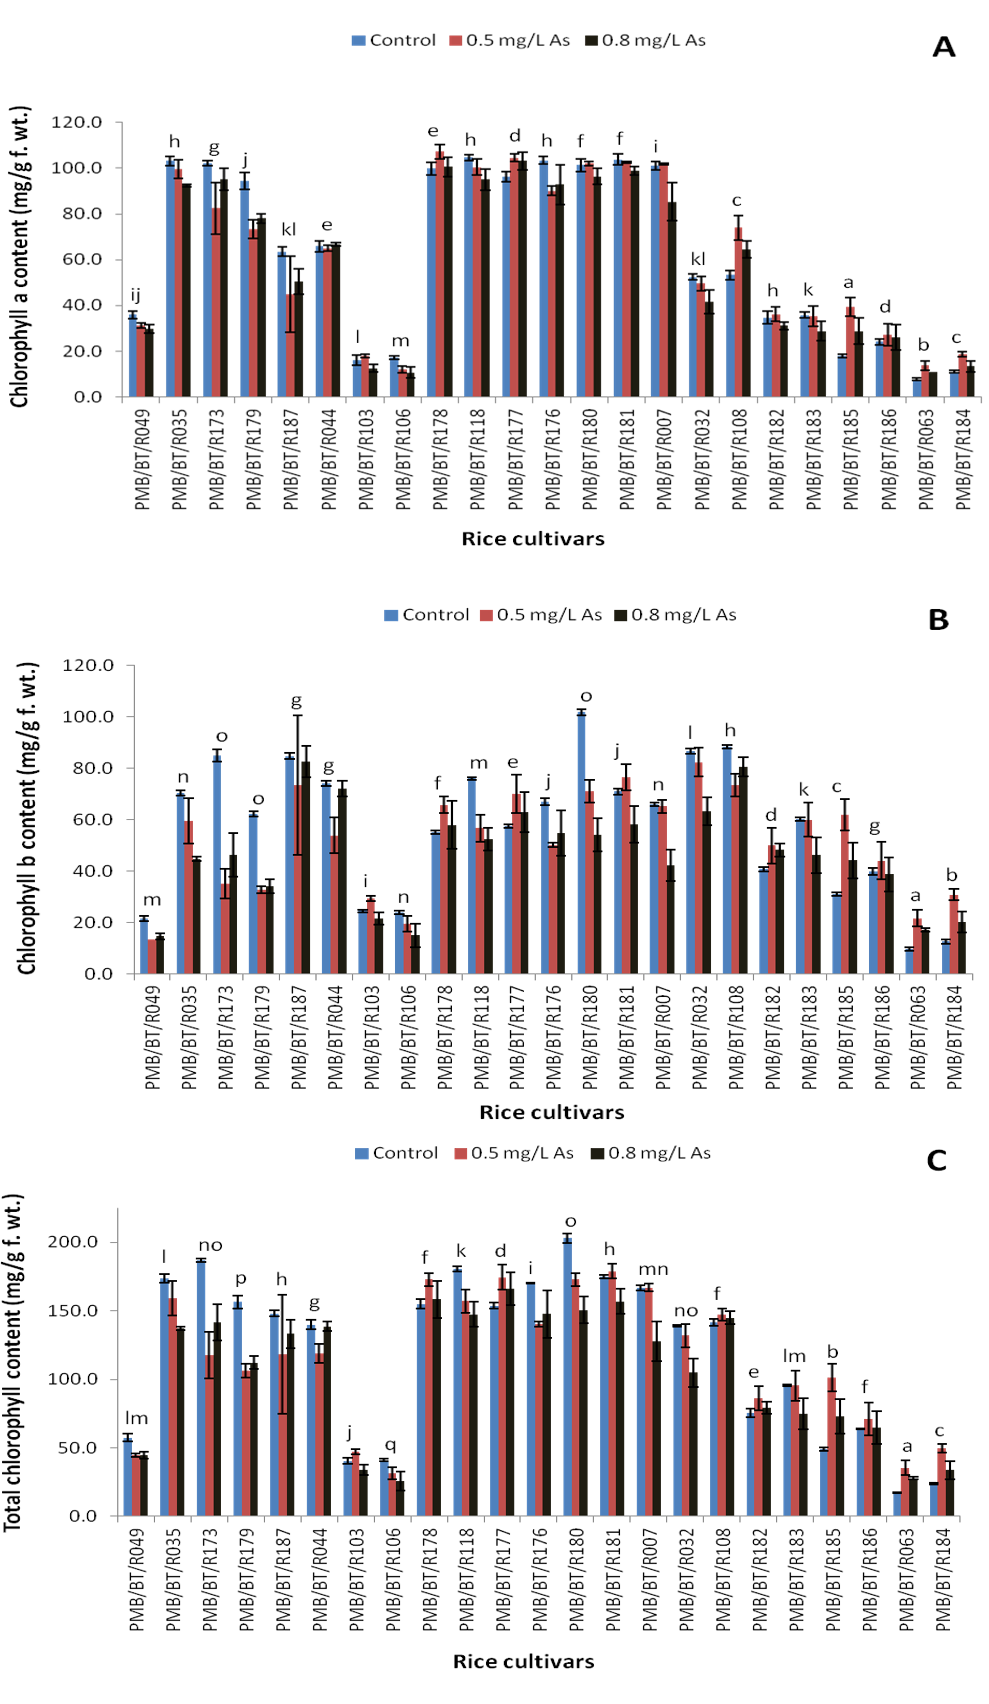
Our experimental rice cultivars differed significantly with regard to the chlorophyll a, chlorophyll b, and total chlorophyll contents under arsenic stress (Figure 4A–C). ‘Doom Sali’ (PMB/BT/R178) exhibited the highest chlorophyll a content under low arsenic stress, followed by ‘Tora Sali’ (PMB/BT/R177) and ‘Jaya’ (PMB/BT/R180), whereas ‘Tora Sali’ exhibited the highest chlorophyll a content under high arsenic stress, followed by ‘Doom Sali’ and ‘Boro’ (PMB/BT/R181). At the low arsenic concentration, ‘Moinagiri’ (PMB/BT/R032) showed the highest chlorophyll b content, followed by ‘Boro’ and ‘Ijong’ (PMB/BT/R108). In contrast, the chlorophyll b content was the highest in ‘Joha Boni’ (PMB/BT/R187), followed by ‘Ijong’ (PMB/BT/R108) and ‘Lota Sali’ (PMB/BT/R044), at the high arsenic concentration. ‘Boro’ had the highest total chlorophyll content at the low arsenic concentration, whereas ‘Tora Sali’ displayed the highest total chlorophyll content at the high arsenic concentration, followed by ‘Doom Sali’ and ‘Boro.’ The cultivar ‘Ranjit’ (PMB/BT/R106) displayed the lowest total chlorophyll content under arsenic stress, followed by ‘Sok Bonglong’ (PMB/BT/R063).
The chlorophyll contents increased in certain cultivars under arsenic treatment, but decreased in the rest. ‘Sapna’ (PMB/BT/R185) and ‘Sok Bonglong’ (PMB/BT/R063) had the highest increases in the chlorophyll a and chlorophyll b contents at 0.8 mg/L arsenic, respectively, whereas ‘Ranjit’ (PMB/BT/R106) and ‘Jaya’ (PMB/BT/R180) showed the highest decreases in the chlorophyll a and b contents, respectively. The total chlorophyll content increased the most in ‘Sok Bonglong’ (PMB/BT/R063) and decreased the most in ‘Ranjit’ (PMB/BT/R106) under 0.8 mg/L arsenic.
Figure 4
Chlorophyll contents (mg/g fresh weight) under arsenic stress. Chlorophyll a (A), chlorophyll b (B), and total chlorophyll (C). Data are presented as the mean ± SE, n = 3.
Columns topped by the same letter(s) indicate that the percentage changes in the parameter values of the presented cultivars under 0.8 mg/L arsenic stress do not differ significantly at the 5% level according to Duncan’s multiple-range test.
Leaf Relative Water Content
The leaf relative water content is a measure of the leaf hydration status and highlights the plant’s ability to retain stomatal activity and maintain the activity of the photosystem complex during stress. ‘Kethakeni Boni’ (PMB/BT/R179) showed the highest leaf relative water content at the high arsenic concentration, followed by ‘Moinagiri’ (PMB/BT/R032) and ‘Baismuthi’ (PMB/BT/R007), whereas ‘Biyoi Sali’ (PMB/BT/R118) displayed the lowest leaf relative water content (Figure 5). Under 0.8 mg/L arsenic stress, the relative water content was found to have increased the most in ‘Moinagiri’ (PMB/BT/R032) and ‘Boro’ (PMB/BT/R181), whereas the highest decrease was observed in ‘Jaya’ (PMB/BT/R180) and ‘Biyoi Sali’ (PMB/BT/R118).
Figure 5
Leaf relative water content (%) under arsenic stress. Data are presented as the mean ± SE, n = 3.
Columns topped by the same letter(s) indicate that the percentage changes in the parameter values of the presented cultivars under 0.8 mg/L arsenic stress do not differ significantly at the 5% level according to Duncan’s multiple-range test.
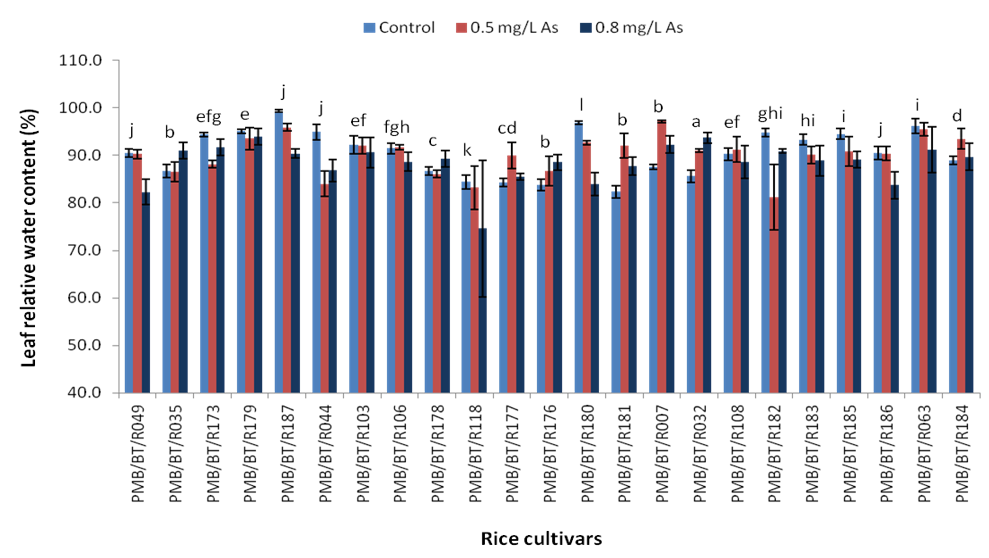
Table 2 and Table 3 present the percentage changes in the recorded parameter values observed under 0.5 and 0.8 mg/L arsenic stress, respectively, relative to the values for the corresponding controls. The growth and biomass of most cultivars were found to decrease with the addition of arsenic to the growth medium. The shoot length of ‘Tora Sali’ (PMB/BT/R177) decreased up to 18.36% and 33.51% at 0.5 and 0.8 mg/L arsenic, respectively. The shoot length increased (6.19%) in ‘Chanmoni’ (PMB/BT/R183) only at 0.5 mg/L arsenic, whereas it decreased in all cultivars at 0.8 mg/L arsenic. ‘Chanmoni’ also showed the lowest decrease (4.86%) in its shoot length at 0.8 mg/L arsenic. The only cultivar that showed an increase in shoot fresh weight at 0.5 mg/L arsenic was ‘Chanmoni’ (8.86%), whereas the highest decrease in this parameter was recorded for ‘Tora Sali’ (30.16%). At 0.8 mg/L arsenic, all cultivars showed decreased shoot fresh weights, with the lowest decrease being recorded for ‘Monasali’ (PMB/BT/R186) at 4.36% and the highest for ‘Birohi Dhan’ (PMB/BT/R176) at 48.62%. The cultivars ‘Chanmoni’ and ‘Ijong’ (PMB/BT/R049) showed 10.21% and 4.14% increases in the shoot dry weight, respectively, at 0.5 mg/L arsenic, whereas the values for this parameter decreased in the other cultivars at the same arsenic concentration, with the highest decrease (45.04%) being in ‘Doom Sali’ (PMB/BT/R178). At 0.8 mg/L arsenic, all cultivars showed decreased shoot dry weight accumulation, with ‘Ranjit’ (PMB/BT/R106) and ‘Doom Sali’ recording the lowest (1.33%) and highest (64.45%) decreases, respectively.
Table 2
Percentage* changes in the values of different parameters of cultivars under 0.5 mg/L arsenic stress.
Table 3
Percentage* changes in the values of different parameters of cultivars under 0.8 mg/L arsenic stress.
The growth response and biomass accumulation of the roots varied significantly from those of the shoots, with many cultivars showing a tendency toward increased root growth and biomass accumulation in the presence of arsenic. Of the 23 cultivars studied, eight (34.8%), 11 (47.8%), and 13 (56.5%) showed increases in their root length, fresh weight accumulation, and dry weight accumulation, respectively, at 0.5 mg/L arsenic, whereas 11 (47.8%), 14 (60.9%), and 12 (52.2%) cultivars exhibited increases in these respective parameters at 0.8 mg/L arsenic. The highest increases in the root length (21.31%), fresh weight (90.41%), and dry weight (76.52%) at 0.5 mg/L arsenic were observed in ‘Ijong’ (PMB/BT/R108), ‘Monasali’ (PMB/BT/R186), and ‘Kethakeni Boni’ (PMB/BT/R179), respectively, whereas the highest increases in the root length (36.99%), fresh weight (100.08%), and dry weight (82.95%) at 0.8 mg/L arsenic were recorded in ‘Ijong’ (PMB/BT/R108), ‘Masuri’ (PMB/BT/R103), and ‘Kethakeni Boni’, respectively. The cultivar ‘Biyoi Sali’ (PMB/BT/R118) showed the highest decrease in the root length (36.58%) at 0.5 mg/L arsenic, and also the highest decreases in the root length (59%), root fresh weight (64.61%), and root dry weight (48.48%) at 0.8 mg/L arsenic. ‘Moinagiri’ (PMB/BT/R032) showed the highest decreases in the root fresh weight (31.74%) and dry weight (32.97%) at 0.5 mg/L arsenic.
Arsenic at the 0.5 mg/L concentration decreased the chlorophyll a, chlorophyll b, and total chlorophyll contents of 12 (52.2%), 14 (60.9%), and 12 (52.2%) of the 23 cultivars, respectively, whereas at the 0.8 mg/L arsenic concentration, these chlorophyll contents were decreased in 15 (65.2%), 17 (73.9%), and 15 (65.2%) cultivars, respectively. The highest increases in the chlorophyll a content at 0.5 and 0.8 mg/L arsenic (119.48% and 60.48%, respectively) were recorded in ‘Sapna’ (PMB/BT/R185). At 0.5 mg/L arsenic, the highest increases in the chlorophyll b (144.96%) and total chlorophyll (109.24%) contents were recorded in ‘Maiju Hankar’ (PMB/BT/R184), whereas at 0.8 mg/L arsenic, the highest increases (75.22% and 59.77%, respectively) were recorded in ‘Sok Bonglong’ (PMB/BT/R063). ‘Ranjit’ (PMB/BT/R106) showed the highest decrease in the chlorophyll a content at 0.5 mg/L arsenic (30.42%) as well as the highest decreases in the chlorophyll a (37.84%) and total chlorophyll (37.57%) contents at 0.8 mg/L arsenic. At 0.5 mg/L arsenic, the highest decreases in the chlorophyll b (58.54%) and total chlorophyll (37.12%) contents were noted in ‘Boro’ (PMB/BT/R173). ‘Jaya’ (PMB/BT/R180) showed the highest decrease in the chlorophyll b (46.73%) content at the 0.8 mg/L arsenic concentration.
The leaf relative water content showed increases of up to 11.84% in ‘Boro’ (PMB/BT/R181) and 9.44% in ‘Moinagiri’ (PMB/BT/R032) at the 0.5 and 0.8 mg/L arsenic concentrations, respectively. The highest decreases in the relative water content were observed in ‘Lota Sali’ (PMB/BT/R044) (11.49%) and ‘Biyoi Sali’ (PMB/BT/R118) (11.65%) at the 0.5 and 0.8 mg/L arsenic concentrations, respectively.
Correlations Among the Different Parameters at 0.8 mg/L Arsenic
Pearson correlation coefficients for the recorded parameters are presented inTable 4. The chlorophyll a and b contents showed significant positive correlations (at p < 0.001) with each other and with the total chlorophyll content. Significant positive correlations (at p < 0.001) were also observed between the shoot fresh weight and shoot and root dry weights, the root fresh weight and root dry weight, and the shoot length and shoot fresh and dry weights. The shoot dry weight showed a significant positive correlation (at p < 0.01) with the root dry weight, whereas the root fresh weight was significantly correlated (at p < 0.01) with the shoot dry and fresh weights. The root length also showed significant positive correlations (at p < 0.01) with the root fresh and dry weights. The leaf relative water content was significantly positively correlated (at p < 0.05) with the root length.
Table 4
Pearson correlation matrix showing the correlations between growth parameters of cultivars under 0.8 mg/L arsenic stress.
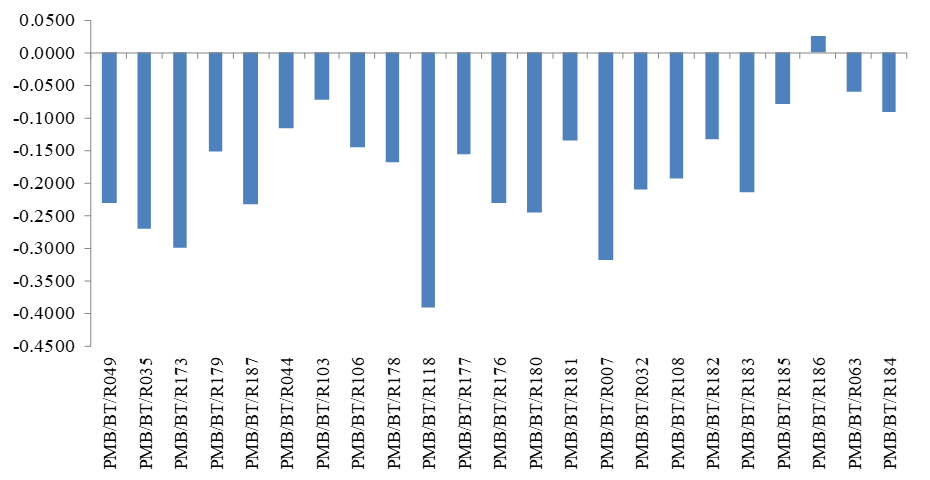
Stress Response Index at 0.8 mg/L Arsenic
Using the adopted formula, the values of the relative effects (ER) of 0.5 and 0.8 mg/L arsenic on the different parameters were determined for all the cultivars. The means of the ER values of all parameters for a particular cultivar under a certain concentration of arsenic gave its stress response index at that concentration. Using the stress response index at 0.8 mg/L arsenic, the cultivar ‘Monasali’ (PMB/BT/R186) was found to be relatively tolerant to arsenic stress, whereas the cultivars ‘Biyoi Sali’ (PMB/BT/R118), ‘Baismuthi’ (PMB/BT/R007), and ‘Bora’ (PMB/BT/R173) were the most susceptible (Figure 6).
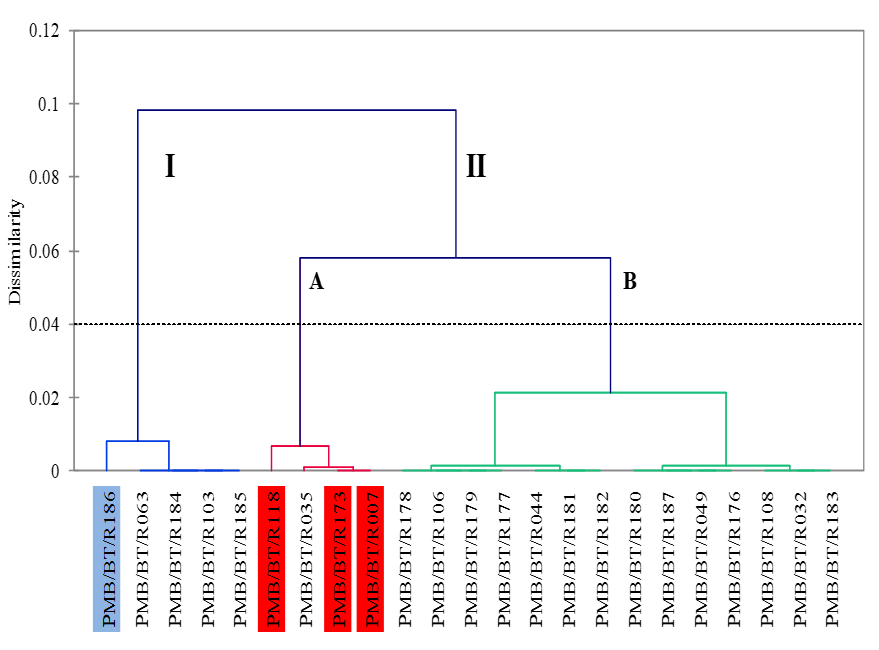
Clustering on the Basis of Morphophysiological Parameters Under Arsenic Stress
A dendrogram was prepared to determine the clustering of the different cultivars according to their responses to 0.8 mg/L arsenic. Two major clusters were revealed, namely, I and II. Cluster I comprised five cultivars, whereas Cluster II comprised 18 cultivars. Cluster II was further divided into Groups A and B, which were then subdivided into two subgroups each. The selected susceptible cultivars ‘Biyoi Sali’ (PMB/BT/R118), ‘Baismuthi’ (PMB/BT/R007), and ‘Bora’ (PMB/BT/R173) were clustered together under Group A of Cluster II, whereas the tolerant cultivar ‘Monasali’ (PMB/BT/R186) fell under Cluster I (Figure 7).
Discussion
Screening of Rice Cultivars
The extent of the tolerance of 23 rice cultivars (collected from the 6agroclimatic zones of Assam) to different levels of arsenic (0.5 and 0.8 mg/L) added to the hydroponic medium was tested, and the effects of arsenic on different growth parameters were observed. The inhibition of shoot growth parameters, such as the shoot length and shoot fresh or dry weights, was most prominent in the presence of arsenic in the growth medium. Decreases in the chlorophyll and leaf relative water contents were also observed in several cultivars in the presence of arsenic in the growth medium. The inhibition was generally greater at the higher concentration of arsenic. These results were found to agree with previous observations (Rahman et al.,2007). The shoot and root biomasses were found to show significant positive correlation with each other in the presence of arsenic in the growth medium.
The identification of the arsenic tolerance of rice crops grown in regions of Assam with high arsenic-containing groundwater is important for the successful commercial production of the cultivars. In this study, arsenic was provided in a dissolved form (As3+) in the hydroponic medium. Further soil and field trials may be necessary to validate the results.
Growth Parameters
The shoot length and shoot biomass were generally decreased in all cultivars in the presence of arsenic in the growth medium. A decrease in the rice shoot biomass caused by arsenic in susceptible varieties has also been reported (Rahman et al.,2007), who further suggested that a decrease in the chlorophyll content might cause a decrease in the rate of photosynthesis, which subsequently results in a decrease in plant growth. This could also result in a decrease in the rice yield in the stressed plants at the maturity stage (Chutia et al.,2012; Nahar, Sahoo, and Tanti,2018, Nahar, Vemireddy, et al.2018). In a previous study, the relative shoot height (calculated by dividing the shoot height under arsenic treatment by that of the control) was found to be significantly reduced with increasing concentrations of arsenic, where arsenite was found to be the inorganic species that affected shoot growth to a slightly greater extent (Abedin & Meharg,2002). In another study, the shoot and root lengths as well as biomass were also found to be significantly decreased under arsenic stress, where the concentration of arsenite used was much higher (50 μM) than that in the previous study (6.67 μM and 10.67 μM). In the same study, the use of arsenate above 500 μM led to the complete inhibition of root formation (Shri et al.,2009). Another study using the mung bean found lipid peroxidation to be a prime reason behind the inhibition of root elongation in the presence of arsenic. In that case, root elongation was more severely affected by arsenic compared with shoot elongation (Singh et al.,2007). In the present study, root length and biomass were found to increase in the presence of arsenic in the growth medium of many of the cultivars, but were decreased in others. In Arabidopsis thaliana, the H+ cation antiporter CAX4 has been identified to regulate root growth under metallic stress (Mei et al.,2009). Therefore, the increase in root growth in some cultivars in the present study might be related to the genetic variations and adaptability to arsenic.
Physiological Parameters
An understanding of the physiological changes for improvement of the photosynthetic efficiency is very important in rice research (Long et al.,2006). A reduction in the chlorophyll content under arsenic stress, as observed in most of the cultivars, agrees with previous observations (Halim et al.,2014). Variations in the chlorophyll content under the stress condition were observed among the different cultivars, which could be due to the differences in the genotypes. Cultivars that maintain high chlorophyll content during stress should have a better mechanism of tolerance to arsenic. The chlorophyll content was previously observed to be increased in the tolerant plant Pteris vittata, but decreased in the susceptible plant Pteris ensiformis, upon exposure to arsenic (Singh et al.,2006). In another study, an increase in chlorophyll content in response to arsenate treatment was also observed in Pisum sativum (Päivöke & Simola,2001). In the present study, the leaf relative water content was also found to be reduced in many cultivars in the presence of arsenic in the growth medium. The metal stress from nickel at the concentration of 10 μM was previously observed to be unable to cause much decline in the relative water content in wheat (Gajewska et al.,2006). However, in that study, a 200 μM concentration was observed to cause a decline in the relative water content in the plant. In the present study, the drop in leaf relative water content was not severe, with most of the cultivars maintaining more than 80% RWC.
Conclusions
Significant variations existed in the responses of the studied rice cultivars to arsenic stress. The stress response index values under 0.8 mg/L arsenic varied from 0.0247 in PMB/BT/R186 to −0.3906 in PMB/BT/R118. Using the index, PMB/BT/R186 (‘Monasali’) was identified as an arsenic-tolerant cultivar, whereas PMB/BT/R118 (‘Biyoi Sali’) was determined to be the most susceptible cultivar. Further biochemical and molecular investigations are required to verify the tolerance or susceptibility of the cultivars as determined from the morphological and physiological observations. The cultivar ‘Monasali’ could also be tested for its responses to arsenic in pot and soil conditions up to the stages of maturity and grain yield, and it could prove to be an important source of an arsenic-tolerant germplasm for future crop improvement programs.
Handling Editor
Małgorzata Wójcik; Maria Curie-Skłodowska University in Lublin, Poland; https://orcid.org/0000-0001-6674-0341
