. Introduction
Drought is one of the several abiotic stresses that plays a crucial role in reducing plant productivity in many agricultural fields worldwide. The plant drought responses vary and their response mechanisms are complex, which depend on the plant species and the duration of drought (Chukwuma et al., 2017; Prasad et al., 2008). Drought stress causes enormous economic losses in Thailand and elsewhere worldwide, and is predicted to increase in the future because of climate change (Felkner et al., 2009). Drought stress induces molecular and physiological changes in the entire plant, which consecutively affects plant quality and yield (Prasad et al., 2008). Thus, increased knowledge of drought tolerance mechanisms will facilitate effective strategies for crop improvement.
Rice (Oryza sativa L.) is a major staple food and economic crop worldwide; this is particularly true in Thailand. However, biotic and abiotic stresses hinder rice growth and development. In recent years, the effects of abiotic stress (specifically drought) on rice have increased mainly because of climate change. Rice production has been continually decreasing, especially in the northeastern part of Thailand, which is the leading rice-producing region in the country. In Asia, rice is mostly grown under rain-fed conditions, which is also the case in Thailand; approximately 45% of the total rice cultivation area is not irrigated (Jongdee et al., 1999, 2006; Monkham et al., 2018). Rice grown under rainfed conditions is frequently subjected to drought and is extremely vulnerable to climate change (Monkham et al., 2015), causing rice yields to decline to levels up to 57% lower than the baseline level (Monkham et al., 2015) . Consequently, physiological and biochemical changes can occur in rice plants under drought conditions, which can be investigated by various processes and screening techniques (Chukwuma et al., 2017; Ghaffari et al., 2014; Lenka et al., 2011; Sahebi et al., 2018). Therefore, to improve the economic importance of rice as a staple food source, an increased understanding is required on how rice plants tolerate stress, particularly drought stress that reduces yield. Moreover, the response mechanism of plants to drought must be investigated, which will help identify drought-tolerant rice cultivars.
Plants can defend against certain environmental conditions by altering their metabolism, and these metabolic changes can be identified and analyzed (Y. Zhao et al., 2015). Periods of abiotic stress, such as drought and heat, majorly affect plant physiological processes, resulting in the need for plants to adapt to the new conditions (Arbona et al., 2013; Wang et al., 2003). These types of abiotic conditions affect various plant metabolic activities such as photosynthesis, protein synthesis, plant growth rates, and carbohydrate levels (Hayat et al., 2010, Inuwa & Muhammad, 2018). In rice, these changes affect the metabolic activities associated with rice productivity. Information concerning biochemical modifications within rice plants subjected to environmental stress can be obtained via metabolomic analysis (Chutia & Borah, 2012; Farooq et al., 2008; Farooq et al., 2009; Lenka et al., 2011; Sahebi et al., 2018). Metabolomic (e.g., metabolic fingerprinting) studies are therefore useful, and have been applied in the characterization of different medicinal plants for efficient quality control (J. K. Kumar & Devi Prasad, 2011).
Spectroscopy is a unique technique that can be used to identify biochemical changes in plants; it provides accurate information, is non-destructive and versatile, but requires sample preparation (Afifi & Youssef, 2013; Barbin et al., 2014; McCann et al., 1992, 1997). Specifically, Fourier transform infrared (FTIR) spectroscopy can be used to detect conventional changes in compounds related to the agricultural and food industries (Gholizadeh et al., 2014). In plants, initial responses to stress can be evaluated because functional groups within molecules have characteristic absorption frequencies in the infrared (IR) spectrum, which can be measured (J. K. Kumar & Devi Prasad, 2011; X. Zhao et al., 2013). FTIR involves measuring the wavelength and intensity of the absorbed IR light by a sample. The primary function of FTIR is to detect and measure changes in the molecular vibrations of the chemical components within a sample (S. Kumar et al., 2016; Lan et al., 2015; McCann et al., 1992). Absorption wavebands observed in the mid-IR region of the electromagnetic spectrum (between 4,000 and 400 cm−1) are usually associated with the fundamental vibrational modes of a particular functional group or bonds within a molecule. This technique is based on the changes occurring in the dipole moment as a bond vibrates, and can be used as an analytical tool in various fields for the rapid classification and differentiation of various biological species, including plants (Abdelkader et al., 2010; McCann et al., 1997; Thanh et al., 2017; Thumanu et al., 2015), and has specifically been used for characterizing the biochemical components within plant cells (Türker-Kaya & Huck, 2017). FTIR spectroscopy is a powerful tool that can potentially be used in characterizing the drought stress response of rice plants. However, to extract the information from wavebands, a multivariate analysis approach, that is, principal component analysis (PCA), is needed (De Luca et al., 2011; Griesser et al., 2015; Sanchez et al., 2018; Yu, 2012). The IR wavebands of rice plant samples under drought stress conditions compared with that at control conditions exhibited highly specific patterns associated with their chemical components, including lipids, proteins, lignin, pectin, and polysaccharides. The dominant absorption features in the lipid spectrum were found in the 2,800–3,000 cm−1 region, which corresponded to the asymmetric and symmetric properties of CH3 and CH2. The waveband at 1,739 cm−1 represents the C=O esters in pectin. The waveband at 1,700–1,500 corresponds to C=O and N–H from protein amides I and II, respectively. The band at 1,515 cm−1 is ascribed to the stretching vibration of the C=C aromatic skeleton vibrations from lignin, and the area from 1,200 to 900 cm−1 corresponds to the functional groups of C–O–C glycosides, mainly in hemicellulose and polysaccharides. The presence of these biochemical components changes under different conditions; their differences during drought stress conditions and well-watered conditions might help understand plant adaptability under stress conditions (Luz, 2006).
The aim of this study was to characterize the ability and strategy of rice plants to respond to drought stress by analyzing their IR spectral wavebands. Specifically, we compared the variations in the highly specific spectral patterns of chemical components (lipids, proteins, lignin, pectin, and polysaccharides) of rice plants cultivated under drought stress and normal conditions. Moreover, we investigated the physiological responses and biochemical changes in rice using FTIR. Thus, we used FTIR to detect the change in metabolites associated with drought responses and to identify drought-tolerant cultivars, which could be used and employed in rice breeding programs in the future.
. Material and Methods
. Plant Material
The seeds of 80 rice cultivars collected from different provinces in northeastern Thailand were used in this study. Seeds were collected from rice landraces, which are commonly grown in the northeastern region of Thailand. CT9993, a drought-tolerant cultivar obtained from Kasetsart University, Kamphaeng Saen Campus, Nakhon Pathom, Thailand, and KDML105, a drought-susceptible Thai jasmine rice cultivar obtained from the Nakhon Ratchasima Rice Seed Center, were included as reference cultivars for comparison. The cultivar names and their collection locations are listed in Table 1.
Table 1
List of 80 rice cultivars collected from the northeastern region of Thailand (Phansak et al., 2021).
. Plant Cultivation and Drought Treatment
All the rice seeds used were cleaned with 0.5% sodium hypochlorite (NaOCl) taken in a 50-mL plastic tube and shaken for 10 min. The seeds were washed with distilled water five times and subsequently soaked in sterilized water overnight. Thereafter, the seeds were placed in plastic boxes covered with moistened paper and allowed to germinate for 3 days until the radicle emerged. After germination, the seeds were transferred to a custom-made seedling float system with nylon mesh, and each seedling was grown in Yoshida’s nutrient solution medium (Yoshida et al., 1976) contained in plastic tubs; the dimensions of the plastic tub were 29 × 41 × 10 cm. Fifteen rice plants were planted per container. The seedlings were divided into two groups: drought and well-watered (control). The experiment was conducted using a randomized complete block design (RCBD). The treatment for each rice cultivar was replicated thrice, with one plant per replicate, and the rice seedlings were maintained in water at 28 °C for 3 days. Yoshida’s nutrient solution medium (Yoshida et al., 1976), which provides nutrients required for proper plant growth and development, was added 4 days after the seedling transplantation into each plastic trayand the nutrient solution was changed every 4 days. Treatments were initiated during the vegetative stage of development, and drought stress conditions were imposed using 20% polyethylene glycol (PEG) 6000. The control plants received only Yoshida’s nutrient solution without PEG 6000 (well-watered conditions) throughout the experimental period, and a pH of 5.0 was maintained in both the control and drought stress treatments. The rice plants were grown for 21 days under greenhouse conditions, during which PEG 6000 was applied to the treatment plants to induce drought for 10 days. After 10 days, all plants under drought and control (well-watered) conditions were scored for their tolerance, after which they were harvested (the third leaf from the top down) to evaluate their physiological characteristics [i.e., total chlorophyll content, relative water content (RWC), electrolyte leakage (EL)] and metabolic biochemical changes.
. Measurement of Chlorophyll Concentration
After 10 days of treatment, all plants from both the drought and control conditions were collected and placed on ice. Total chlorophyll content was estimated according to the method proposed by Aron (1949), with slight modifications. Leaf sample (1 g) was cut into small pieces and soaked in 10 mL of 80% acetone for 3 days under dark conditions, after which their final volume was recorded. The absorbance of each extract was recorded at 645 and 663 nm using a spectrophotometer (Halo RB-10; Dynamica Scientific; Livingston, UK), with 80% acetone used as a blank control. The chlorophyll concentration was expressed as milligrams per gram of tissue fresh weight (FW) and calculated as follows:
where A645 and A663 represent the absorbance of the chlorophyll extract at 645 and 663 nm, respectively, V is the total extract volume (mL), and W is the fresh leaf weight (g).
. Measurement of Electrolyte Leakage
EL was measured in the second uppermost fully expanded leaf of all rice cultivars. For this method, 100 mg fresh rice leaf samples were cut into pieces of 5 mm in length and transferred to a test tube containing 10 mL distilled deionized water. The tubes were covered with plastic caps and placed in a water bath at 32 °C for 2 hr. The initial electrical conductivity of the sample (EC1) was measured after 2 hr of incubation using an electrical conductivity meter (InLab 741; Mettler-Toledo, Analytical; Schwerzenbach, Switzerland). The samples were then incubated in a 100 °C water bath for 45 min to completely kill the tissues and release all electrolytes. The samples were subsequently incubated at room temperature, and the final electrical conductivity (EC2) was measured. EL was ultimately expressed using the formula:
as described by Dionisio-Sese and Tobita (1998).
. Calculations of Relative Water Content
To calculate the RWC, flag leaves of rice plants subjected to drought and control conditions were used. After they were cut at the base of the lamina, the leaf samples were immediately sealed in plastic bags and transferred to the laboratory. The leaf samples were then cut in the middle (approximately 3 cm in length); to determine the FW, leaf samples were weighed within 2 hr after excision. Turgid weights were obtained after the leaf samples were submerged in distilled water at room temperature (approximately 25 °C) for 16 to 18 hr. After being submerged, the leaf samples were carefully and quickly blotted dry with tissue paper prior to obtaining their turgid weight. Finally, the leaf samples were oven-dried at 65 °C for 24 hr, after which their dry weights were obtained. The RWC was calculated according to the equation provided by Schonfeld et al. (1988):
where FW is the fresh weight, DW is the dry weight, and TW is the turgid weight of a leaf sample.
. FTIR Spectroscopy Analysis
All rice leaf samples subjected to FTIR spectroscopy were prepared according to the methods described by Thanh et al. (2017), with slight modifications. Leaf samples of both drought-treated and untreated rice plants were collected 10 days after imposing drought conditions. The leaf samples were first hot-air oven-dried at 60 °C for 72 hr to remove water. The dried leaf samples were then ground to a fine powder using a mortar and pestle for analysis, with three replicates. FTIR spectroscopy was subsequently performed via single-reflection attenuated total reflectance (ATR) using a diamond crystal (Buensanteai et al., 2012). FTIR (Tensor 27, Bruker Optics; Ettlingen, Germany) spectroscopy measurements were conducted at the Suranaree University of Technology (Nakhon Ratchasima, Thailand). A background spectrum of air was collected before scanning each sample to check the cleanness of the crystal and to ensure no interference from the surface residues. FTIR analyses were performed in the mid-IR range of 4,000–800 cm−1, with a spectral resolution of 4 cm−1 and 64 scans.
The spectra of each sample was analyzed using PCA to identify the different biochemical components present within each sample. The FTIR spectra were preprocessed by calculating the second derivative, followed by vector normalization with extended multiplicative signal correction (EMSC). The second derivative was subsequently corrected for baseline effects and linear wavenumber-dependent effects, after which vector normalization was performed for standardization based on the total amount of biomass. Preprocessing analysis was performed to increase the accuracy of the determined waveband positions. PCA was performed for the spectral ranges of 3,000–2,800 cm−1 and 1,800–900 cm−1, which together covered the regions of lipids, proteins, and polysaccharides, and the “true” fingerprint region. The waveband assignments are presented in Table 2. The results were presented as score plots using the Unscrambler X 10.5 software (Camo Analytics; Oslo, Norway). Hierarchical cluster analysis (HCA) was performed using OPUS 7.2 software (Bruker Optics), with second-derivative calculations and vector normalization corresponding to the fingerprint region of each spectral data. A dendrogram was generated using Ward’s algorithm, with interspectral distances and spectral distances calculated as D values (Thanh et al., 2017; Thumanu et al., 2017).
Table 2
. Statistical Analysis
The means and standard deviations were computed for three replicates per treatment group. The data were analyzed using the least significant difference (LSD) test at p = 0.05, and the t test was performed using SPSS software (version 16.0; SPSS; Chicago, USA). Error bars expressing ± standard deviations were computed, and significant differences were based on comparisons of the means via Duncan’s multiple range test (DMRT) at p = 0.05.
. Results
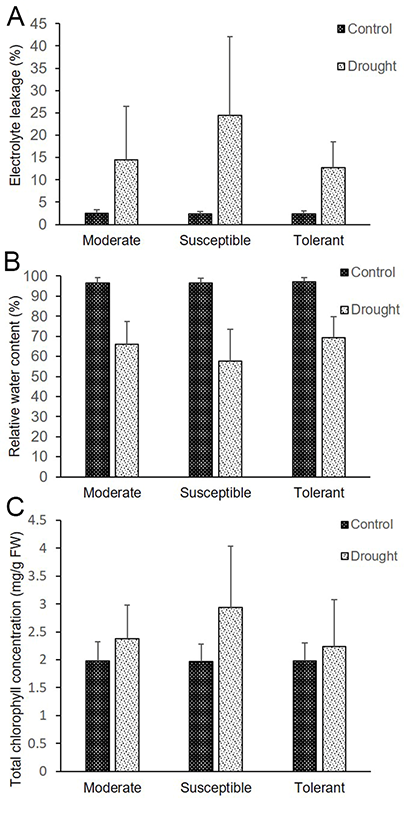
. Effects of Drought on the Total Chlorophyll Concentration
The results showed that the total chlorophyll concentration of the rice plants subjected to drought stress either increased or decreased depending on the cultivar and the level of tolerance. The effect of drought stress on total leaf chlorophyll concentration was significant (p < 0.05; Table 3 and Figure 1C). Based on the results, all 80 rice cultivars were divided into three groups: susceptible, moderately tolerant, and tolerant. The tolerant cultivars, such as cultivar No. 14, 17, 18, and 49, presented the highest chlorophyll concentration (3.51 mg g−1 FW) under drought conditions, which is in agreement with the results of the drought-tolerant of reference cultivar CT9993, and were therefore classified as tolerant. Cultivars such as No. 55, which is classified as susceptible, had significantly lowest total chlorophyll concentration (1.24 mg g−1 FW).
. Effects of Drought on Electrolyte Leakage
EL in the leaves of the drought stress-treated plants did not decrease significantly. However, based on their degree of tolerance, the 80 rice cultivars were divided into three groups: susceptible, moderately tolerant, and tolerant (Table 3 and Figure 1A). The highest EL occurred in cultivar Nos. 61 and 62 (EL of 57.44% and 52.03%, respectively); these cultivars were thus categorized as susceptible. Cultivar Nos. 32 and 49 presented the lowest EL (6.49% and 4.97%, respectively), and thus were designated as tolerant.
. Effects of Drought on the Relative Water Content
The RWC did not change significantly in every cultivar in response to drought stress during the seedling stage (Table 3 and Figure 1B). However, for some cultivars, the effects of drought significantly (p < 0.05) affected RWC. Compared with that of the control plants, the leaf RWC of drought-stressed plants decreased significantly. For example, cultivar Nos. 14 and 17 presented substantial reductions in RWC under drought stress conditions at the seedling stage, with values of 67.41% and 45.32%, respectively. Cultivar Nos. 22 and 26 presented the greatest RWC values of 74.18% and 71.22%, respectively. The leaf RWC results were in accordance with the biochemical indices under drought stress conditions. The RWC of plants that are highly tolerant to drought stress is relatively high.
Table 3
Comparisons of the means of measured physiological traits, i.e., electrolyte leakage, relative water content, and total chlorophyll content, of plants under control conditions and drought stress conditions.
[i] Means with different asterisks and letters within the same column are significantly different at p < 0.05. The asterisks (**) indicate significant differences between the control and drought treatments for all cultivars, as determined by the Student’s t test. Means with different letters indicate significant differences between drought tolerance groups (moderately tolerant, susceptible, tolerant) and cultivars within each tolerance group (p < 0.05) according to DMRT.
. FTIR Spectroscopy of the Biochemical Changes in Rice
The PCA revealed distinct separation between the control and drought stress treatment groups, which corresponded to the biochemical variation and intensity between the rice samples in the different treatments (Figure 2A, Figure 3A, Figure 4A). The first principal component (PC1) was used to characterize the maximum percentage of spectral variation. PC1 from the three drought stress treatment groups (susceptible, moderately tolerant, and tolerant) accounted for 84%, 85%, and 80% of the total variation, respectively. The spectral features of the loading plot corresponded to the differences between the drought stress treatment group and the control group, as revealed by PCA. The spectral features that separated the control group from the drought stress treatment group were associated with the CH2 and CH3 stretching of lipids, the C=O stretching of pectin, and the C–O stretching of lignin (Figure 2B, Figure 3B, Figure 4B). The second-derivative FTIR spectra of the control and drought stress treatment groups are shown in Figure 2C, Figure 3C, Figure 4C.
Figure 2
(A) Representative PCA score plot of susceptible plants under drought stress conditions and control conditions. (B) Loading plot of PC1 from the PCA. (C) Second-derivative-transformed spectra. The obtained spectra were analyzed in the regions of 3,000–2,800 cm−1 and 1,800–900 cm−1.
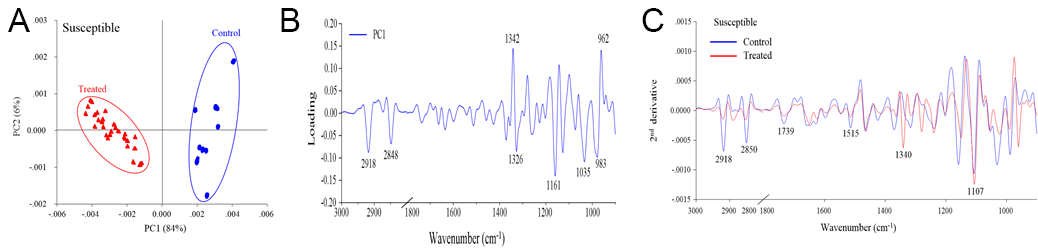
Figure 3
(A) Representative PCA score plot of moderately tolerant plants under drought stress conditions and control conditions. (B) Loading plot of PC1 from the PCA. (C) Second-derivative-transformed spectra. The obtained spectra were analyzed in the regions of 3,000–2,800 cm−1 and 1,800–900 cm−1.
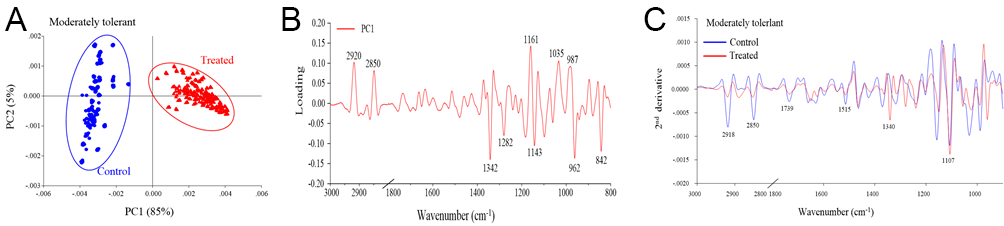
Figure 4
(A) Representative PCA score plot of tolerant plants under drought stress conditions and control conditions. (B) Loading plot of PC1 from the PCA. (C) Second-derivative-transformed spectra. The obtained spectra were analyzed in the regions of 3,000–2,800 cm−1 and 1,800–900 cm−1.
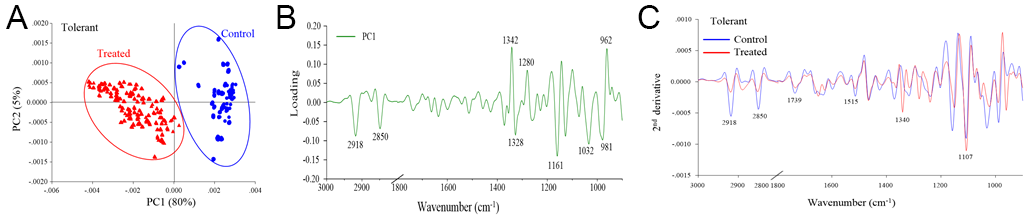
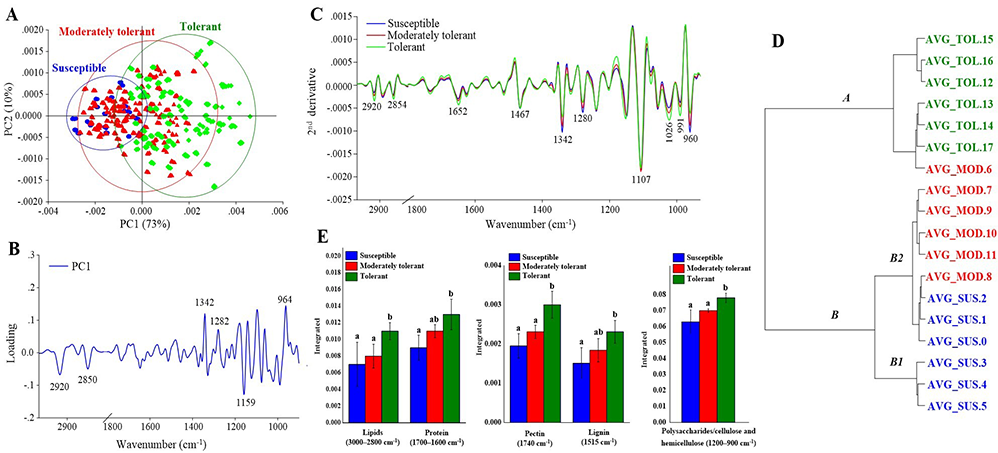
All drought stress treatment groups presented reductions in biochemical components based on CH2 and CH3 stretching from lipids (3,000–2,800 cm−1), C=O stretching from pectin (1,740 cm−1), and C=C stretching from lignin (1,515 cm−1). Moreover, all drought stress treatment groups presented high spectral intensity at wavebands 1,340, 1,280, 1,107, and 962 cm−1, which are associated with the OH and CH stretching of cellulose or hemicellulose, and the CH2 stretching of lignin. To evaluate the changes in the plant biochemical components with different levels of tolerant response to drought stress, plants in the susceptible, moderately tolerant, and tolerant groups were compared and analyzed. PCA revealed separation of each treatment group, with a total variance of 83% (PC1 = 73%, PC2 = 10%), which indicated distinct division between the susceptible, moderately tolerant, and tolerant groups of plants (Figure 5A). PCA also revealed a clear separation between the tolerant and susceptible groups according to the loading plot (Figure 5B), which was attributed to the spectral features of the tolerant group associated with the CH2 and CH3 stretching of lipids, the C=O stretching of amide I protein, and the C=C stretching of lignin. Figure 5C shows the average second-derivative spectra by comparing the intensity of spectral features associated with each biochemical component that changed under drought conditions compared with the control conditions. Compared with the moderately tolerant and tolerant groups, the susceptible group exhibited high-intensity absorption at wavebands 1,342, 1,280, and 960 cm−1, which are associated with cellulose and hemicellulose. However, compared with the moderately tolerant and susceptible groups, the tolerant group exhibited higher intensity of CH2 stretching of lipids (2,920 and 2,854 cm−1), C=C stretching of lignin (1,515 cm−1), and C=O stretching of amide I protein (1,650 cm−1). The integrated area under the peaks can be used to compare quantitative differences in peak height; thus, the peak areas of the different drought stress groups were compared to detect significant differences (Figure 5D). The biochemical responses of the plants depend on the level of drought stress tolerance. In addition, HCA was used to classify the similarities between groups of samples. Therefore, an HCA dendrogram was constructed using averaged spectra of the susceptible, moderately tolerant, and tolerant treatment groups. HCA was performed using Ward’s algorithm, second-derivative transformation (9-point smoothing), and vector normalization for the regions of 3,000–2,800 and 1,800–900 cm−1. HCA resulted in the division of the spectra into three groups, similar to the results shown in the PCA score plot (Figure 5E). In the dendrogram, the tolerance frequencies were the most distant within branch A, corresponding to waveband assigned at 2,920, 2,850, and 1,159 cm−1 from the loading plot of PC1, whereas the spectra from the susceptible and moderately tolerant groups clustered closely together and resulted from the wavebands at 1,342, 1,282, and 964 cm−1, which are shown on branches B1 and B2.
Figure 5
(A) Representative PCA score plot of susceptible, moderately tolerant and tolerant plants under drought stress conditions. (B) Loading plot of PC1 from the PCA. (C) second-derivative-transformed spectra. (D) Comparisons of the integrated areas of the biochemical components of plants from each drought stress condition. (E) HCA (via Ward’s algorithm) results after second-derivative transformation and vector normalization of the spectra. The obtained spectra were analyzed in the regions of 3,000–2,800 cm−1 and 1,800–900 cm−1.
. Discussion
This study investigated the response of different rice cultivars to drought stress based on their physiological and biochemical traits, that is, total chlorophyll, EL, RWC, and FTIR absorption data. PEG was used to evaluate cell membrane permeability and stability, and to evaluate drought tolerance (Amini et al., 2014; Hellal et al., 2018; Sultan et al., 2014). The electroconductivity of aqueous media containing rice leaf discs that were previously water-stressed by exposing to a PEG solution was measured. The results of PEG experiments have been shown to be affected by various factors based on membrane permeability, such as osmotic adjustment, wax content, changes in cytoplasmic lipids, EL, RWC, leaf surface, and thickness of the cuticular layer and cell walls (Bayoumi et al., 2008; Fraser et al., 1990; Premachandra et al., 1992).
Leaf tissue parameters, including RWC, EL, and total chlorophyll concentration, were used as indicators of drought stress in different rice cultivars (Cha-um et al., 2010; Chutia & Borah, 2012; Kanawapee et al., 2012; Shereen et al., 2019; Sovannarun et al., 2019). The RWC and chlorophyll concentrations were comparable to those of the control during drought stress at the seedling stage. Studies have shown that EL within plant leaf tissue increases with increased leaf water deficit (Khan et al., 2017; S. Kumar et al., 2014; Larkunthod et al., 2018). Drought stress strongly affects both plant function and membrane structure, severely hindering various cellular functions, such as adjusting from the liquid-crystalline phase to the gel phase and fusion, and increasing cell permeability (Ferrari-Iliou et al., 1984; Vaezi et al., 2010; Zare et al., 2011). Our results indicate that EL reflects drought stress-induced changes in cellular metabolism and cell membrane permeability. Overall, the results showed that the EL within rice tissue can reflect the membrane leakage caused by drought stress, and thus, this technique can be used to provide useful information to describe the behavior of rice plant tissues in response to drought stress and other abiotic stresses (Carpita et al., 1979; Lu & Neumann, 1998).
We used FTIR spectroscopy to analyze the changes in the biochemical components in the leaves of rice plants under drought stress. Thus, we analyzed the differences in macromolecules in 80 different rice landraces at a high spatial resolution. According to the methods of Thumanu et al. (2015) and Nikalje et al. (2019), we combined FTIR and PCA to evaluate the chemical nature of the leaves of different varieties. The FTIR technique can classify plant species based on their biochemical contents (Legner et al., 2018; Qiu et al., 2014) and can also be used to determine plant responses to chemicals or the environment (Fan et al., 2016; Westworth et al., 2019). Thus, the FTIR technique can be used to classify plants as susceptible, moderately tolerant, or tolerant to drought. Moreover, FTIR could be used to identify and differentiate the biochemical compounds among the three groups, and calculate the correlations between the biochemical contents and drought stress tolerance. In a previous study, PCA revealed that leaf treatment with bacterial strain D604 caused spectral changes in epidermal and mesophyll tissue; treatment with D604 caused spectral differences from epidermal and mesophyll tissue, and altered both cell wall thickness and protein structure. Species of the plant growth-promoting genus Bacillus produce elicitor molecules that affect chili plants, altering their structure, and eliciting physiological changes in plant growth and development (Thumanu et al., 2017).
FTIR spectroscopy is a useful tool for determining the structure of known components, their spectral intensity, and their chemical constituent groups (McCann et al., 1992). Previous studies have shown that the protein-based wavebands are often localized between 1,800 and 1,500 cm−1 (Surewicz et al., 1993); the wavebands adjacent to 3,370 cm−1 are associated with the O–H group of alcohols, whereas the 2,800–3,000 cm−1 region corresponds to lipids. Polysaccharide wavebands are located at 438–709 cm−1, and C=O groups can be detected at 1,744 cm−1, which represent lipids and fatty acid esters. In the present study, the FTIR data revealed significant shifts and crucial differences in reflectance intensity in the spectra of rice leaves.
Water stress can induce physiological and biochemical responses in plants. In the present study, rice plants under well-watered and drought stress conditions presented differences in the biochemical components associated with metabolites and metabolic responses. Metabolite levels can increase under drought stress because of the increased degradation of other metabolites. Increase in sugar content (corresponding to wavebands 1,342, 1,280, and 960 cm−1) and decrease in lipids and protein (corresponding to wavebands 2,920 and 2,854 cm−1) were detected in rice plants under drought stress conditions. These results are similar to those of other studies that investigated plant response to stress conditions caused by membrane injury, protein degradation, and enzyme inactivation, resulting in the induction of oxidative stress. Under drought stress conditions, plants can synthesize sugars, sugar alcohols, and other carbohydrates; therefore, soluble carbohydrates may play a role in osmotic regulation (Asaf et al., 2017).
However, in plants under drought and heat stress conditions, the expression of genes involved in the defense pathway is activated, and sucrose and other sugars such as maltose and glucose accumulate (Rizhsky et al., 2004). Moreover, drought stress can affect plant cell membranes. Lipids are an important component of plant membranes and are affected by drought stress. In plants, oxidative stress caused by water stress can produce reactive oxygen species (ROS) such as O2, H2O2, and OH radicals. Increased ROS levels result in increased levels of malondialdehyde (MDA). MDA can attack membrane lipids, leading to increased lipid peroxidation, which can act as a marker for membrane lipid peroxidation, resulting in decreased membrane stability (Abid et al., 2018; Fathi & Tari, 2016). Additionally, overproduction of MDA due to increased lipid peroxidation can result in protein degradation and DNA fragmentation, which can cause plant cell death (Hussain et al., 2018; Sharma et al., 2012; Xie et al., 2019).
. Conclusion
The results of our experiments can provide meaningful data for genetic studies on rice. After drought stress was imposed on all 80 cultivars, they were assigned to one of the following three groups based on their chlorophyll content, EL, and RWC: susceptible, moderately tolerant, and tolerant groups. Additionally, our results suggest that the biochemical components of rice plants varied after imposing drought stress conditions. Differences in the biochemical components of the rice leaves were detected when the susceptible, moderately tolerant, and tolerant cultivars were compared. This variation may be associated with the adaptive response of plants to severe environmental disturbances. Additionally, we demonstrated that FTIR spectroscopy can be used to explain the primary mechanisms governing the adaptive response via intensities of spectral peaks that correspond to specific biochemical components within plant leaves. Thus, these attributes can be used as screening tools for drought tolerance in rice plants and for identifying tolerant rice cultivars for parental selection in rice breeding programs.
