. Introduction
Wheat (Triticum aestivum L.) is an important crop, serving as a major source of calories and protein in human diets worldwide (Arzani & Ashraf, 2017). It is consumed in various foods, including pasta, noodles, chapati, naan, bread, and biscuits. Wheat flour has various health-promoting nutritional compounds, such as B vitamins, phytochemicals, proteins, and dietary fiber (Shewry & Hey, 2015). Global wheat production amounts to 759.9 million tons with a total utilization of 738.9 million tons for food, feed, and other purposes (Food and Agriculture Organization of the United Nations, 2019a). Pakistan is an agricultural country and ranks seventh among the world’s top wheat-producing countries (FAOSTAT, 2019). Wheat is a staple food (Hossain et al., 2019) and the leading cereal crop of Pakistan, followed by rice and maize. It is cultivated on 8,740 million hectares, producing 25.2 million tons and contributing 1.6% of the country’s total GDP (Government of Pakistan, 2019).
Pakistan has been severely affected by two major drought spells: first from 1998 to 2002, which was considered the worst in 72 years (Hussain, 2020), and the second was in 2018. This resulted in serious water shortages and drought stress conditions throughout the country (Food and Agriculture Organization of the United Nations, 2019b; Pakistan Meteorological Department, 2018). Extreme weather conditions are likely to increase in Pakistan throughout the twenty-first century (Arshad et al., 2016) and this will result in an increase in various stress conditions, including drought. Pakistan has the largest canal irrigation system in the world, which is mostly fed by the Indus River and its allied tributaries (Yu et al., 2013). Nevertheless, the water level and flow rate in this irrigation network depend mostly on the annual precipitation rate. Thus, annual precipitation below the average would make this large irrigation network fail to provide enough water to agricultural lands, especially in the Kotri, downstream of Sindh Province. Baig et al. (2013), reported that Pakistan’s total land area is 79.61 m/ha, including 23 m/ha cultivated area (28.8% of total land area), 17.2 m/ha irrigated area (74.7% of cultivated), and 5.75 m/ha (25% of cultivated) of rainfed area. Drought conditions culminate in a decreased grain yield of cereal crops, including wheat. The drastic impacts of prolonged dry spells and marginal rainfall could be reduced by planting drought-tolerant wheat genotypes with the relevant drought-adaptive agronomic traits (Mwadzingeni et al., 2016). To keep pace with the nutritional requirements of the growing population will require the evolution of resilient wheat genotypes adapted to moisture stress conditions and capable of producing a sustainable grain yield.
Drought is a multifaceted and unpredictable process; however, losses in plant growth and yield are determined by the extent of severity and time of occurrence (Martiniello & Teixeira da Silva, 2011). Variability of plant responses during drought depends on several factors, including genotype, growth conditions, drought severity, duration, physiology, and developmental stage (Budak et al., 2015). Drought stress results in major grain yield losses by deteriorating plant growth and disrupting various ongoing physiological mechanisms, including photosynthesis (Moumita et al., 2019) and various morphological traits. Two types of drought condition can be defined for agricultural land: either the agricultural fields are rainfed (hence, the only available source of irrigation is rain) or agricultural lands with a limited amount of water for irrigation. However, plants grown in rainfed areas face serious drought stress conditions because soil moisture is the only source of water available to plants during their growth. In both scenarios, the adaptation of a genotype is of utmost importance in the pursuit of yield outputs. Each genotype within the limits of their genetic constitution confers adaptive physiological, biochemical, and morphological changes to mitigate the effects of moisture stress conditions. The potential of a cultivar to achieve satisfactory and high yield over a wide range of environments, including nonstressed and stressed, is essential (Rashid et al., 2003).
Assessing the genetic diversity in an array of wheat developed by CIMMYT wheat breeders will increase drought tolerance in wheat (Moghaddam et al., 2005). Grain yield is the principle selection index in water stress conditions (Arzani & Lonbani, 2011), and grain yield and yield-contributing traits are widely used to evaluate the genetic variability and adaptability of wheat genotypes in response to moisture stress conditions. Given the complex polygenic nature of yield, genetic progress for the highest yield could be achieved by yield-associated agronomic traits as a simpler alternative for yield prediction (Arzani & Ashraf, 2016). Yield-associated traits in water-scarce conditions play a central role in grain yield intensification in any of the breeding programs (Ahmadizadeh et al., 2011). Agronomic traits, including plant height, spike length, tillers per plant, days to heading, biological yield, grain yield, and harvest index of the genotypes are highly decreased in drought conditions (Bayoumi et al., 2008; Khakwani et al., 2012) and affect the tolerance of wheat to moisture deficiency in the soil (Passioura, 1977). Selection of resilient genotypes based on their agronomic traits is a useful strategy that has been successfully applied in national and international wheat breeding programs. Evaluation of yield components may provide additional information regarding the expression of drought tolerance in terms of productivity (Blum, 2011). Phenotyping of yield and yield-associated morpho-physiological traits plays a key role in evaluating the breeding material in moisture stress conditions (Monneveux et al., 2012; Passioura, 2012).
Drought tolerance is a quantitative trait that is controlled by many contributing genes (Kebede et al., 2019), hence it is a complex trait that involves various interlinked biological processes within the plant. In optimal conditions, the wheat crop requires three–four irrigations at various critical vegetative growth stages, such as root initiation, tillering, preanthesis (booting and heading), and postanthesis (milky to the dough) stages in optimum conditions (Sial et al., 2007) and moisture stress at any critical growth stage reduces the plant’s growth and yield (Pradhan et al., 2012). Crop growth and performance in field drought stress conditions are also affected by the detrimental effects of various other environmental factors, such as temperature, wind, and angle of light. Moreover, wheat genotypes have evolved and have been selected for specific environmental conditions. Therefore, growing crops in fields with natural environmental conditions can provide detailed insights into growth and yield performance in both well-watered (Memon et al., 2020) and water-scarce conditions.
In this study, wheat genotypes were screened for drought-adaptive yield-allied traits, along with yield performance in moisture stress (MS) conditions, i.e., grown in residual moisture in fallow rice land on the succession of rice crops, without any irrigation during the growing season, as well as in well-watered (WW) conditions, i.e., applying two rounds of irrigation. Promising high-yielding wheat genotypes identified in this experiment could be subjected to further screening using divergent experimental strategies. The objectives of this study were (i) to screen the genetic diversity of wheat genotypes for yield and associated agronomic trait variability in moisture stress and well-watered conditions, (ii) selection of drought-tolerant wheat genotypes based on their grain yield performance in water-stress conditions, and (iii) analyze the mean performance and correlation of the wheat genotypes for various agronomics pertaining to their relationship with grain yield performance.
. Material and Methods
. Genetic Materials
A total of 36 wheat genotypes, comprised of 34 new advanced wheat genotypes (Triticum aestivum L.) and two locally adapted commercial check varieties, Khirman (drought tolerant) and TD-1 (drought susceptible), were obtained in order to assess their genetic diversity for grain yield and grain yield-associated agronomic traits in MS and WW conditions. Advanced wheat genotypes have diversified genetic backgrounds and have evolved through conventional, mutational breeding and biotechnological techniques by the International Maize and Wheat Improvement Center (CIMMYT) and Nuclear Institute of Agriculture (NIA), Tando Jam, Sindh, Pakistan.
. Soil Analysis
Soil samples from the experimental field were analyzed for chemical and physiological properties, such as electrical conductivity (EC), pH, total organic matter (TOC), soil texture, and nitrogen, phosphorus, and potassium (NPK) levels, following the methods of Estefan et al. (2013). Soil samples were randomly collected at depths of 0–15 cm and 16–30 cm using an auger. Soils were nonsaline, enriched with adequate organic matter and clay, and the pH was ideal for crop production (Table 1).
Table 1
Physicochemical properties of the experimental field soil including particle size distribution, texture class, pH, electroconductivity (EC), total organic matter (OM) and nitrogen, phosphorous, potassium (NPK).
| Soil depth (cm) | Particle size distribution (%) | Texture class | pH | EC (µ/cm) | OM (%) | Available (ppm) | ||||
|---|---|---|---|---|---|---|---|---|---|---|
| Sand | Silt | Clay | N | P | K | |||||
| 0–15 | 7.0 | 36.0 | 57.0 | Clay | 7.4 | 413 | 1.624 | 0.1 | 2.16 | 250 |
| 15–30 | 11.5 | 28.5 | 60.0 | Clay | 7.4 | 349 | 1.48 | 0.1 | 1.58 | 220 |
. Growth Conditions
Meteorological data, including temperature and humidity during the experiment, were collected from the Pakistan Meteorological Department, Karachi. A mean rainfall of 0.03 mm was observed during November, which is within the crop growing season. No rainfall was recorded in the rest of the crop growth period. The highest average temperature of 41.8 °C was recorded in July, while the lowest temperature of 7.76 °C was recorded in January (Figure 1). A maximum humidity of 76.0% was noted during January, while the lowest humidity of 60.2% was recorded during November (Table 2).
Figure 1
Weather conditions, including minimum–maximum temperature and humidity of the experimental field during the evaluation of 36 wheat genotypes in moisture stress (MS) and well-watered (WW) conditions.
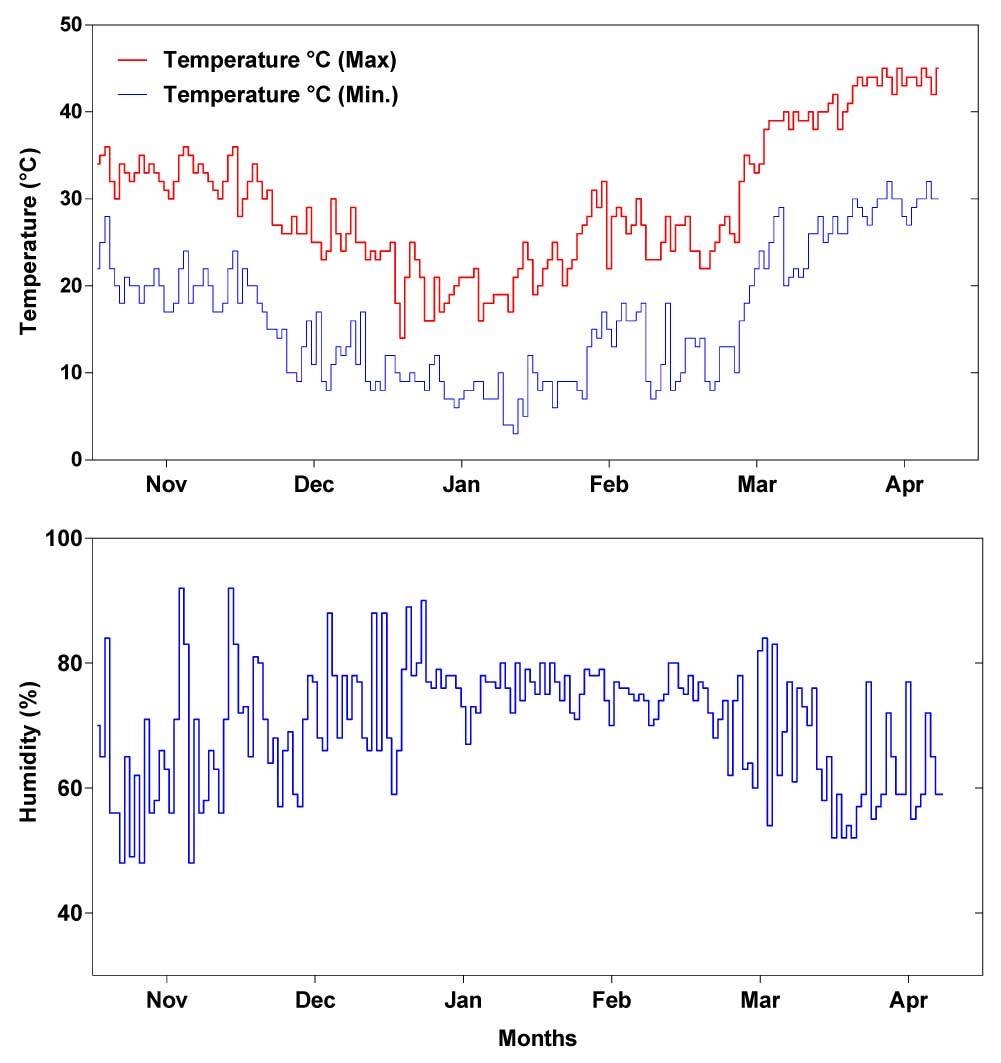
Table 2
Weather conditions including minimum (Min), and maximum (Max) temperature (Temp.) and humidity followed by standard error (SE) recorded during the field study.
. Experimental Design and Treatments
The study was conducted in field conditions in the experimental field of the Nuclear Institute of Agriculture (NIA), Tando Jam, Sindh, Pakistan. The experiment was laid out in a randomized complete block design (RCBD) with two treatments: moisture stress (MS) and well-watered (WW) conditions. Seeds were sown in rice fallow land in the succession of rice crops using a single coulter hand drill into two rows of 2 m length each spaced by 30 cm and replicated three times. In MS conditions, plants were grown in the available soil moisture; hence, the only available source of moisture was the residual moisture of the soil, which was recorded as 14.5% and 15.9% at depth of 1–15 cm and 16–30 cm, respectively. Rainfall data during the crop growing period are provided in Table 2. Meanwhile, two rounds of irrigations were applied to the plants grown in WW conditions at the tillering stage: Zadok’s growth scale (GS; 23–25) (Zadoks et al., 1974) and booting stage; Zadok’s growth scale (GS; 41–47). Three border rows of the plant were made to prevent the effect of inground water logging in MS conditions.
. Primary Data
Primary data were recorded for the traits including second leaf area (SLA), flag leaf area (FLA), plant height (PH), peduncle length (PL), days to booting (DB), days to heading (DH), days to maturity (DM), grain filling period (GFP), fertile tillers per plant (TP) and fertile tillers per square meter (Tm2). FLA (cm2) and SLA (cm2) were obtained using a LICOR leaf area meter (LI3100-C; Nebraska, USA). PL (cm) is expressed as the length between the internode and the main spike. TP was counted as productive tillers on a plant, while Tm2 was counted as the number of tillers of a genotype in a meter multiplied by 4. Phenological traits, including DB, DH, DM, and GFP, of the wheat genotypes were calculated during various plant growth stages. DB were recorded as the days from sowing to the booting of the plants, while DH was evaluated as the number of days from sowing to heading when half of the spikes emerged from the flag leaves of the genotype in a plot. DM was expressed as the number of days from sowing to 80% of the plant chlorosis in a genotype. GFP was calculated as the number of days from heading to grain formation. PH (cm) was expressed as the height of the plant from the base to the spike tip, leaving awns.
. Secondary Data
Secondary data for main spike length (SL), spikelets per spike (SS), grains per spike (GS), main spike yield (MSY), biological yield per plot (BYP), grain yield per plot (GYP), and harvest index (HI) were collected after harvesting the plots. Data pertaining to spike traits, including SL (cm) SS, GS, and MSY (g) were obtained from the main spike of the plants. BYP (g/plot) was recorded by weighing the plants in a plot, whereas GYP (g/plot) was recorded by weighing the grains after threshing the plants in each plot.
. Results
. Analysis of Variance
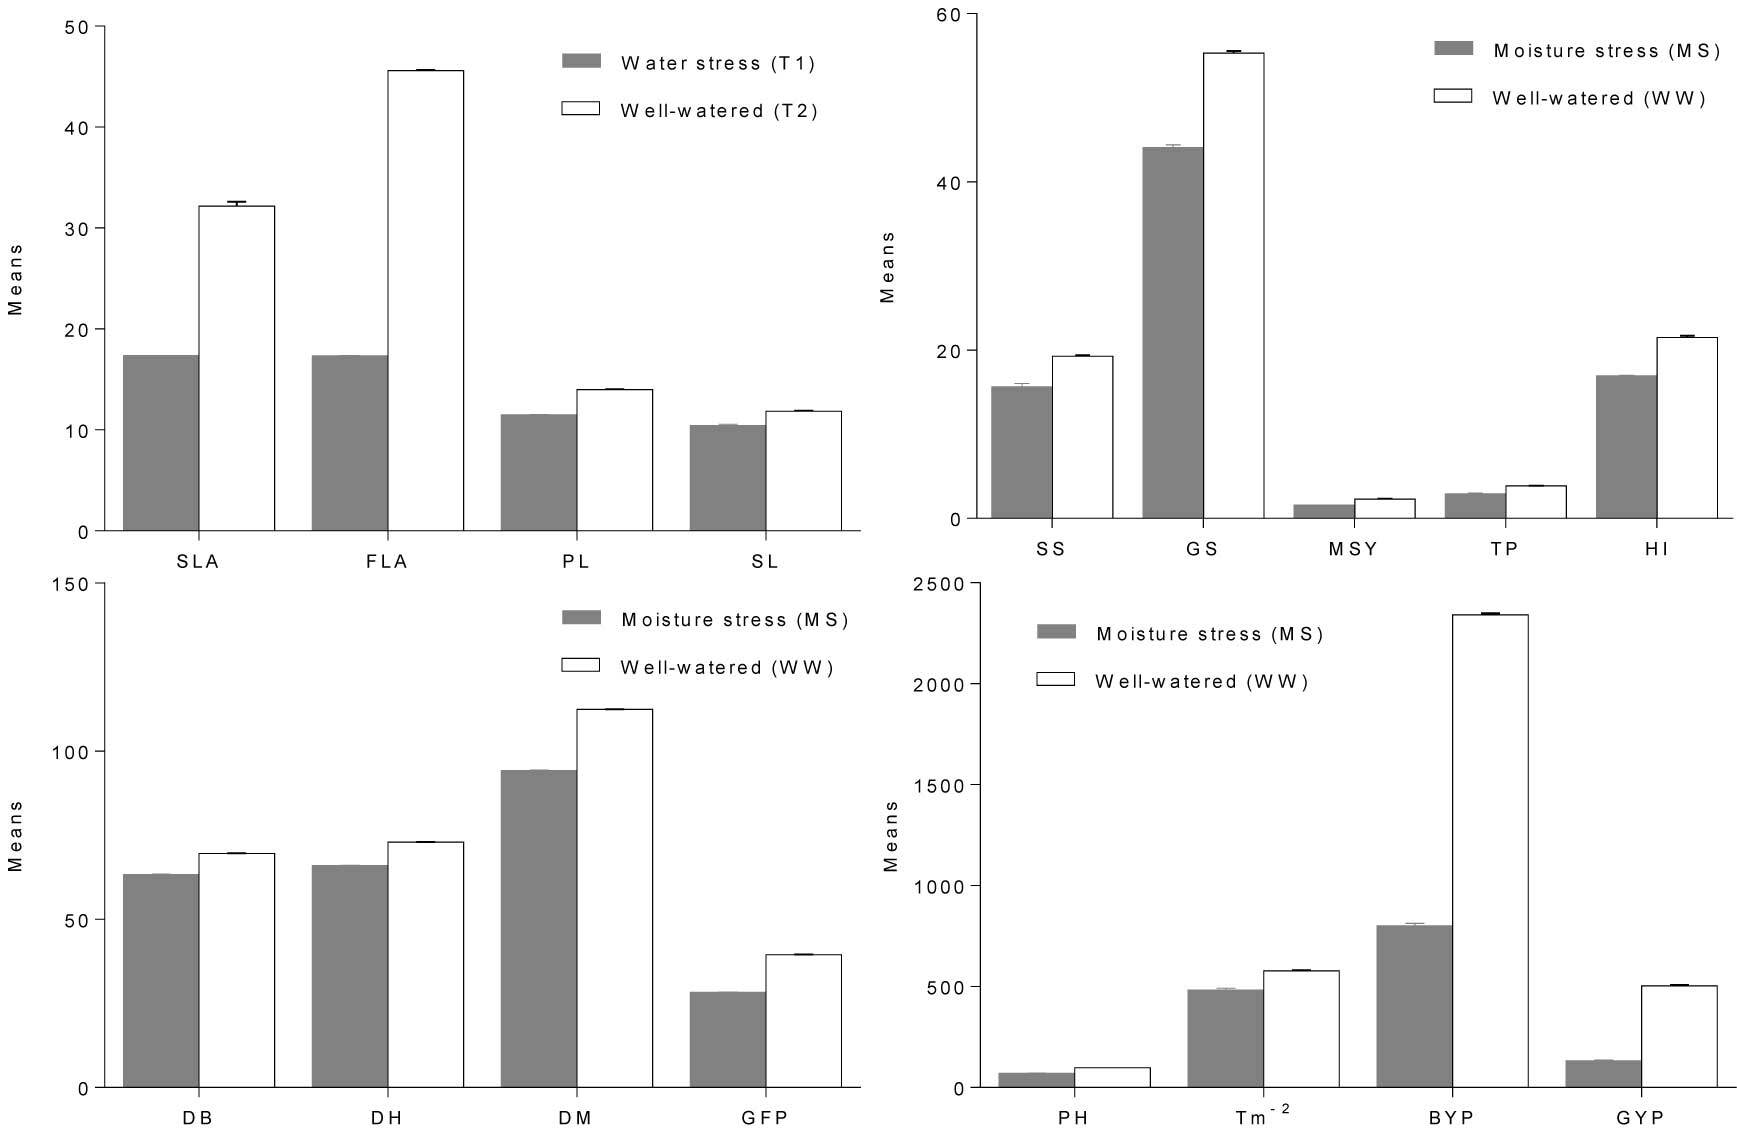
The combined analysis of variance (ANOVA) showed significant differences among the genotypes for all observed traits (Table 3). Furthermore, there were significant differences in each measured trait according to treatment, as well as interactions therein. The results showed the detrimental effects of moisture stress on grain yield and yield-associated agronomic traits of the wheat genotypes (Figure 2).
Table 3
Mean squares from combined analysis of variance (ANOVA) for agronomic traits of wheat genotypes in moisture stress (MS) and well-watered (WW) conditions.
[i] Highly significant (**) at p < 0.01.
SLA – second leaf area; FLA – flag leaf area; PH – plant height; PL – peduncle length; TP – tillers per plant; SS – spikelets per spike; SL – spike length; MSY – main spike yield; GS – grains per spike; DB – days to booting; DH – days to heading; DM – days to maturity; GFP – grain filling period; BYP – biological yield per plot; GYP – grain yield per plot; HI – harvest index; Tm2 – tillers per square meter; df – degrees of freedom.
Figure 2
Mean performance of the wheat genotypes for yield and its associated traits, including second leaf area (SLA), flag leaf area (FLA), peduncle length (PL), spike length (SL), spikelets per spike (SS), grains per spike (GS), main spike yield (MSY), tillers per plant (TP), harvest index (HI), days to booting (DB), days to heading (DH), days to maturity (DM), grain filling period (GFP), plant height (PH), tillers per square meter (Tm2), and grain yield per plot (GYP) in moisture stress (MS) and well-watered (WW) conditions.
. Effects of Drought on Agronomic Traits
The overall mean performance of the wheat genotypes for the investigated agronomic traits in the two moisture regimes is summarized in Table 4. The results of this study elucidated the significant effects of water stress on yield and allied agronomic traits. However, some of the promising drought-tolerant wheat genotypes produced increased grain yields in moisture stress conditions.
Table 4
Mean, range, and standard deviation (SD) of the observed agronomic traits of 36 wheat genotypes in moisture stress (MS) and well-watered (WW) conditions.
. Leaf Area
The second leaf area (SLA) of the wheat genotypes was reduced by 46.0% in moisture stress (MS) conditions as compared to well-watered (WW) conditions. SLA means ranged between 7.61 and 24.0 cm2 in MS and between 24.7 and 44.4 cm2 in WW conditions. Wheat genotypes IBWSN-1165 and MASR-08 expressed the highest SLA means (24.1 and 23.7 cm2, respectively) in MS conditions, while the lowest SLA means were assigned to IBWSN-1171, IBWSN-1170, and TD-1. Furthermore, IBWSN-1171, IBWSN-1170, IBWSN-1010, and IBWSN-1042 had the highest SLA (by a significant margin), while MASR-13 and Khirman had the lowest SLA means in WW conditions.
Flag leaf area (FLA) had a range of 8.04–30.3 cm2 and 33.8–54.7 cm2 in MS and WW conditions, respectively (Table 4). MS reduced the FLA of plants by 62.1% compared to WW. IBWSN-1042, IBWSN-1161, and MASR-64 had decreased FLAs of 11.9, 8.68, and 8.11 cm2, respectively, while the mutant line MASR-13 and DH-12/31 showed increased FLA means (30.9 and 27.5 cm2) in MS conditions.
. Peduncle Length and Plant Height
The mean peduncle length (PL) of the plants exhibited significant variation (p < 0.05) in MS and WW conditions. PL means ranged from 5.24 to 18.1 cm and 6.98 to 24.3 cm in MS and WW conditions, respectively (Table 4). MASR-08 (17.8 cm) had the longest peduncles, including the drought-tolerant check variety Khirman (15.7 cm) in MS conditions.
The mean plant height (PH) of all the genotypes were in the range of 55.1–79.2 cm and 68.5–109.6 cm in the MS and WW treatments, respectively (Table 4). The PH of the wheat genotypes was highly affected by MS conditions and showed a reduction of 27.7% compared to WW conditions. DH-9/6 and MASR-08 showed the tallest height (78.9 and 77.8 cm) in MS. On the other hand, IBWSN-1010, DH-9/6, and DH-9/1 showed the tallest heights of 109.5, 109.3, and 107.1 cm, respectively in WW.
. Main Spike Attributes
The mean spike lengths (SL) of the wheat genotypes ranged between 7.7 and 11.9 cm in MS and between 8.0 and 14.1 cm in WW treatments. MS effectively decreased the SL of the wheat genotypes by 12.6% compared to that of the wheat genotypes grown in WW conditions. IBWSN-1149 and DH-9/1 had the longest spikes (11.8 and 11.6 cm) as compared to all others, including drought-tolerant check Khirman (10.3 cm). IBWSN-1162 (13.6 cm), IBWSN-1155 (13.4 cm), and MASR-64 (13.1 cm) which all showed an increase in SL in WW conditions.
The results showed that the mean range for spikelets per spike (SS) of the wheat genotypes was 13.0 to 19.0 in MS and 16.0 to 25.0 in WW conditions. MS significantly reduced SS (19.2%) compared to WW. IBWSN-1055 and IBWSN-1033, each with a mean of 17.9, exhibited excelled SS in MS. The grains per spike (GS) means were in the range of 29.4–58.6 and 40.0–70.8 in MS and WW conditions, respectively. Highly stressed conditions (MS) caused a decrease (20.3%) in the GS of the plants compared to those grown in WW conditions. IBWSN-1033 and IBWSN-1170 expressed increased means of 55.6% and 54.5%, respectively, for GS in MS conditions. In addition, IBWSN-1149 and MASR-64 had higher means for GS than all the test entries in WW conditions.
. Fertile Tillers
The mean number of tillers per plant (TP) of all wheat genotypes ranged from 1.4 to 4.2 and from 2.6 to 6.8 in the MS and WW treatments, respectively. Water stress inhibited the development of TP among the wheat genotypes by 23.7% compared to WW conditions. IBWSN-117 and MASR-13 produced the highest TP in MS, while a reduced number of TPs was developed in genotypes IBWSN-1033 and IBWSN-1144. In contrast, TP showed an increase in IBWSN-1132 and IBWSN-1055 in the WW treatment. Tillers per square meter (Tm2) of the plants showed a decrease of 16.1% in MS compared to plants grown in WW conditions. Tm2 in MS and WW conditions ranged between 224.0 and 844.0, and between 420.0 and 780.0, respectively. In severe stress conditions (MS), Tm2 was comparatively higher among MASR-64 and DH-9/6.
. Phenological Traits
MS conditions resulted in early booting of wheat genotypes, showing a reduction of 9.1% in days as compared to the WW. The mean days to booting ranged from 58.0 to 68.0 days in MS and between 66.0 and 75.0 days in WW conditions. The wheat genotypes IBWSN-1010 and DH-9/1 took more days to boot, while DH-9/6 and MASR-08 were earlier with respect to booting time in MS conditions.
The heading period (DH) of wheat genotypes was significantly decreased (9.46%) in MS compared to WW conditions. The average days to heading of all genotypes ranged from 62.0 to 71.0 days and from 69.0 to 78.0 days in the MS and WW treatments, respectively. IBWSN-1010 and DH-9/1 showed late heading in MS; in contrast, early heading was expressed in DH-12/31 and TD-1.
The maturity period among the wheat genotypes ranged from 92.0 to 97.0 days in MS and 107.0 to 121.0 days in WW conditions. MS conditions reduced the maturity period of the wheat genotypes by 16.2%. Early maturity in MS was recorded among IBWSN-1033, MASR-08, MASR-22, and Khirman, while IBWSN-1010 was a late-maturing wheat genotype. Wheat genotypes IBWSN-1010, IBWSN-1025, DH-9/1, and IBWSN-1042 were categorized as late maturing, whereas Khirman, DH-9/6, and TD-1 wheat genotypes were designated as early maturing in WW conditions.
The grain filling period (GFP) of wheat genotypes was significantly reduced (p < 0.05) in MS conditions. GFP means ranged from 25.0 to 31.0 days and 36.0 to 43.0 days respectively in MS and WW conditions. More days taken to GFP were observed in MS conditions in DH-12/31, drought susceptible check TD-1, and IBWSN-1149, while GFP was decreased in IBWSN-1147 and DH-9/1 wheat genotypes. Wheat genotypes IBWSN-1147 and IBWSN-1033 possessed reduced GFP, while the four test genotypes had longer GFP than the check variety Khirman.
. Yield Potential
The main spike yield (MSY) of all wheat genotypes grown in MS conditions was significantly decreased in WW conditions. Means ranges for MSY were 1.1–2.17 g in MS and 1.5–2.98 g in WW conditions. IBWSN-1149 and IBWSN-1033 had the highest MSY (2.17 and 1.95 g) than all the contesting wheat genotypes in MS conditions. Meanwhile, IBWSN-1165, IBWSN-1147, and MASR-64 produced the highest MSY (2.86, 2.86, and 2.74 g, respectively) in WW or control conditions by a significant margin.
Biological yield or dry matter weight is the most important trait in drought evaluation of wheat genotypes. A reduction of 65.8% in the overall mean biological yield (BYP) was recorded in MS compared to WW conditions. Wheat genotypes IBWSN-1164 and DH-9/1 increased BYP in MS; hence, they could be more suitable or tolerant to stressful conditions, whereas IBWSN-1010 and IBWSN-1156 showed an increase in their BYP in WW conditions. The results also showed an increase in the BYP of IBWSN-1164, DH-9/1, DH-12/7, and IBWSN-1132 in MS conditions. In WW conditions, IBWSN-1010, IBWSN-1156, and IBWSN-1148 produced the highest biological yield, whereas TD-1 and IBWSN-1164 had the lowest BYP. The mean range for BYP of all wheat genotypes in MS and WW conditions were recorded as 400.0–1,200.0 g and 1,900.0–2,700.0 g, respectively, which demonstrates the effects of water stress on this important yield-contributing trait.
The results showed considerable losses in grain yield of wheat genotypes in MS compared to WW conditions. Overall, the GYP means were in the range of 74.0–202.0 g in MS and 330.0–670.0 g in WW conditions. MS conditions showed a reduction of 73.5% in the GYP of the wheat genotypes and exhibited major grain yield losses due to water-scarce conditions (MS) during the cropping season. IBWSN-1010, MASR-64, and DH-12/7 had an increase in GYP in MS conditions, whereas the exotic line IBWSN-1155 and drought susceptible check variety TD-1 showed a decrease in GYP. IBWSN-1156 and IBWSN-1142 showed the highest GYP in WW conditions.
Eight test entries had better mean harvest indexes (HI) than the drought-tolerant check Khirman. Drought conditions decreased HI (21.4%) of the wheat genotypes. HI means ranged between 10.0 and 23.0 in MS and between 15.9 and 26.1 in WW conditions. In MS conditions, increased HI means were recorded for MASR-22 and IBWSN-1042. On the other hand, wheat genotypes IBWSN-1042, IBWSN-1151, and IBWSN-1156 had increased HI, while DH-9/6 and IBWSN-1162 had the lowest HI than all the experimental genotypes.
. Pearson’s Correlation
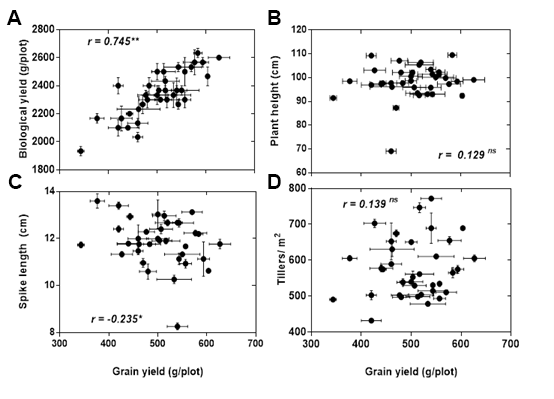
The degree of correlation among the observed agronomic traits in MS and WW conditions is summarized in Table 5. SLA had a strong positive correlation with PH (r = 0.43) in MS conditions. There was a negative correlation between SLA and GFP (r = −0.21) in water stress conditions. In MS conditions, MSY was highly significant and positively correlated with SL (r = 0.56) and GS (r = 0.74). Statistically nonsignificant and negative correlations for GYP were established with GFP (r = −0.20) in MS conditions. Moreover, GYP had a significantly positive correlation (p < 0.01) with BYP (r = 0.93) and a nonsignificant positive correlation with the other agronomic yield and associated traits, including SLA, FLA, DB, DH, DM, PH, SL, SS, GS, and MSY in MS conditions. Tm2 showed a nonsignificant negative correlation with SLA, FLA, DB, DH, DM, PH, SL, SS, and MSY in MS conditions. TP showed a negative but nonsignificant correlation with BYP and GYP (r = −0.17).
Table 5
Pearson’s correlation coefficients (r) among agronomic traits of the wheat genotypes observed in moisture stress (MS) (upper diagonal) and well-watered (WW) conditions (lower diagonal).
[i] Significant (*) at p < 0.05, and highly significant (**) at p < 0.01 (2-tailed).
SLA – second leaf area; FLA – flag leaf area; DB – days to booting; DH – days to heading; DM – days to maturity; GFP – grain filling period; PL – peduncle length; PH – plant height; SL – spike length; SS – spikelets per spike; GS – grains per spike; MSY – main spike yield; BYP – biological yield per plot; GYP – grain yield per plot; TP – tillers per plant; Tm2 – tillers per square meter; HI – harvest index.
. Principal Component Analysis
PCA was performed using a rotated component matrix, also referred to as loadings, which indicates the correlation between the observed traits and the principal components estimating total variance. The total variation in PC-1, PC-2, and PC-3 in MS conditions were 21.9%, 20.4%, and 10.1%, respectively, whereas in WW conditions PC-1, PC-2, and PC-3 showed variations of 22.9%, 14.8%, and 12.1%, respectively. PC-1 was important in both MS and WW conditions, contributing 21.9% (MS) and 22.9% (WW) of the total observed variation (Table 6). PC1 and PC2 for all observed traits in MS and WW conditions are shown in Figure 3.
Table 6
Rotated component matrix of 17 agronomic traits of the wheat genotypes characterized in moisture stress (MS) and well-watered (WW) conditions.
[i] SLA – second leaf area; FLA – flag leaf area; PH – plant height; PL – peduncle length; TP – tillers per plant; SS – spikelets per spike; SL – spike length; MSY – main spike yield; GS – grains per spike; DB – days to booting; DH – days to heading; DM – days to maturity; GFP – grain filling period; BYP – biological yield per plot; GYP – grain yield per plot; HI – harvest index; Tm2 – tillers per square meter.
Figure 3
PCA analysis of agronomic traits of different wheat genotypes in (A) moisture stress (MS) or (B) well-watered (WW) conditions.
SLA – second leaf area; FLA – flag leaf area; PH – plant height; PL – peduncle length; SL – spike length; SS – spikelets per spike; GS – grains per spike; MSY – main spike yield; BYP – biological yield per plot; GYP – grain yield per plot; HI – harvest index; TP – tillers per plant; Tm2 – tillers per m2.
. Discussion
In this study, we assessed wheat genotypes for grain yield and other agronomic traits in water-scarce (MS) conditions. Water stress had detrimental effects on the grain yield and yield-associated agronomic traits of wheat genotypes. This is in agreement with the findings of Boussakouran et al. (2019). In addition, the tested wheat genotypes showed significant variability for all agronomic traits in both moisture regimes. Variability in genotypic expression is the primary stage for selecting potential genotypes for drought tolerance (Baenziger, 2016). More importantly, the variable performance of the wheat genotypes in different moisture regimes could be necessary for performance-based selection for drought tolerance and yield potential.
The results show that drought-tolerant wheat genotypes can produce better grain yield even with just residual moisture when the plants are grown as a crop rotation in fallow rice land, i.e., without any irrigation throughout the crop growing period. Rainfall at any of the critical growth stages of the crop can intensify the grain yield in water-scarce conditions. In this study, a very short rainfall was observed during the first month of crop growth. We observed some of the wheat genotypes evolved through each of the techniques such as IBWSN-1010 (exotic line), MASR-64 (mutant line), and DH-12/7 (doubled haploid line) with superior grain yield (197.7 g/plot, 177.1 g/plot, and 166.3 g/plot) and yield associated traits performance than drought-tolerant check Khirman (162.6 g/plot). Newly evolved wheat genotypes are more tolerant to drought stress conditions than older wheat genotypes in terms of increased biomass (Xue et al., 2014). Wheat genotypes with the highest agronomic and yield potential could be subjected to conventional breeding programs to incorporate the desired traits into their progenies (Sallam et al., 2019). The selection of wheat genotypes based on our findings could produce higher yields and provide nutritional benefits, especially for people living in drought-prone rainfed areas.
Among the agronomic traits, leaves are the most important for the morpho-physiological mechanisms that are essential for the growth and development of plants, such as photosynthesis, the ascent of sap, gaseous exchange, and osmoregulation. Reduced leaf area is considered an advantage in moisture stress conditions because of decreased water loss through transpiration. Water stress significantly decreased FLA (62.1%) compared with SLA (46.0%). This suggests that plants adapted themselves to highly stressed conditions by reducing FLA to prevent excessive transpiration, resulting from the direct effect of sunlight, in order to conserve soil moisture. Moisture deficiency imposing overstressed conditions on plants might result in wheat yield losses due to increased leaf senescence and decreased photosynthetic rate (H. Wang et al., 2001). However, the results of this study showed that drought-tolerant wheat genotypes develop a balanced medium-sized leaf area as an important strategy to increase grain yield, even in MS conditions. In this study, SLA had a statistically significant correlation with main spike yield and grain yield in MS, indicating its important role in carbohydrate synthesis during photosynthesis, resulting in an increase in and MSY and BYP.
The plant height of the wheat genotypes was significantly decreased in MS conditions. Plant height affects the photosynthetic activity of plants, which can change the grain yield (Jamali & Syed, 2008). In drought stress conditions, plant height is associated with the translocation of carbohydrates (Blum et al., 1989). The results in this study showed a significant positive correlation between PH and BYP in both MS and WW treatments, whereas a significant positive correlation with GYP was observed in MS conditions. Moreover, PH was not significantly correlated with GYP in WW conditions. Taller genotypes have some advantages in semiarid regions (Ismail & Hall, 2000), whereas semidwarf genotypes are the highest producers with intensive irrigation (Donmez et al., 2001). The results suggest that in water stress conditions, PH can withstand the stress by obtaining water from deep within the soil through extensive root development, thus increasing the leaf area to regulate the water supply and ascent of sap. In this study, the wheat genotype IBWSN-1010 had the highest PH and PL, with improved GYP and HI.
It has been reported that wheat genotypes with reduced tillering capacity produce higher grain yields than high-tillering genotypes in water-limited conditions (Houshmandfar et al., 2019; Naruoka et al., 2011; Z. Wang et al., 2016) because of the formation of fertile spikelets (Gaju et al., 2014). Nevertheless, in this study, we observed wheat genotypes MASR-64 and DH-9/6 had the highest grain yield and a comparatively high number of tillers per square meter (Tm2) in severe stress conditions.
Water stress reduces heading, maturity, and grain filling periods (Kiliç & Tacettin, 2010). This study showed that water stress increases senescence, triggers maturity, lessens GFP, and decreases the net assimilates necessary for GYP increase in wheat genotypes. In our findings, wheat genotypes had a short phenological period, including DB, DH, DM, and GFP, in water stress conditions. Reduction in DH and DM allows for drought tolerance; hence, it is considered important when breeding for terminal drought stress tolerance (Lopes et al., 2012). Blum (2011) also reported early anthesis in plants in moisture stress conditions. In contrast, this study indicated an exotic wheat genotype IBWSN-1010 that exhibited a long time towards booting, heading, and maturity, but maintained increased GYP in both MS and WW conditions. In addition, a nonsignificant positive correlation between DM and GYP was demonstrated in MS conditions (Table 5). This trend suggests that not all late-maturing wheat genotypes succumb to drought stress. The extent of yield losses is revealed through the grain-filling period and shortening of the life cycle affected by the severity and duration of drought stress conditions (Farooq et al., 2014). Wortmann (1998) pointed out that drought escape has high heritability but is associated with lower yields. Furthermore, we observed a negative correlation (r = −0.20) between GFP and GYP in MS conditions. This suggests that GFP in water-scarce conditions hampered the grain yield of wheat genotypes.
Grain yield is a complex trait that is interlinked with various intrinsic and extrinsic factors of the wheat genotypes, including genome, environmental conditions, and adaptability. Moreover, crop yield in moisture stress conditions is predicted by the biomass and harvest index (Blum, 2009; Richards et al., 2002). In this study, MS caused a significant reduction in the BYP, GYP, and HI of each wheat genotype. This reduction in yield is primarily due to the decrease in biomass and harvest index in water deficit conditions imposed at critical growth stages, such as joining, anthesis, and grain filling (Thapa et al., 2019). Mathew et al. (2018) reported a decrease in grain yield among wheat genotypes in moisture stress conditions. We found a strong positive correlation between GYP and BYP in MS conditions. In this study, we selected wheat genotypes as drought-tolerant according to their highest means for both grain yield and agronomic traits or the highest performance for any of the grain yield or its associated traits. Selected wheat genotypes, such as doubled haploid line DH-9/1, had increased SL, DB, DH, TP, BYP, and earlier GFP in MS conditions. Doubled haploid line DH-12/7 expressed the highest PL, GYP, and BYP in MS conditions. Doubled haploid line DH-12/31 had increased FLA, and earlier booting and heading in MS conditions. Mutant line MASR-64 had increased GYP, Tm2, PL, MSY, and reduced SLA in MS conditions, and simultaneously improved mean FLA, MSY, SL, SS, and GS in WW conditions. Exotic entry IBWSN-1156 possessed the highest means for GYP, BYP, and HI in MS conditions. The identification of wheat genotypes performing well across various water stress conditions indicates the possibility of developing widely adopted drought tolerant wheat genotypes. Selection of the drought-tolerant wheat genotypes in this study could provide nutritional benefits, especially to people living in drought-prone rainfed areas.
. Conclusion
Moisture stress reduced grain yield and allied agronomic trait performance of various wheat genotypes. We found some of the elite wheat lines that could withstand moisture stress conditions with different combinations of drought adaptive traits. In this study, 17 promising elite wheat genotypes were selected as drought-tolerant with increased grain yield and agronomic trait performance in water-scarce conditions. The drought-tolerant wheat genotypes selected in this study can provide better grain yield in highly water-scarce agricultural fields. This study recommends further evaluation of the selected wheat genotypes for morpho-physiological and biochemical traits to confirm the drought tolerance of these wheat genotypes.
