Introduction
Melon (Cucumis melo L.) is an annual plant from the Cucurbitaceae family. For optimal growth, this plant needs warm and sunny weather as well as fertile soil of relatively light texture and pH between 5.5 and 7.5 (Hassandokht,2012). Iran has an arid and semiarid climate and water shortage is one of the main problems in agriculture. Therefore, the occurrence of drought stress is an inevitable matter during the plant growth period. The response to drought stress varies with crop species and even between different cultivars within a species (Vieira et al.,1992). Damage due to drought stress, salinity, and high temperature to crops is more widespread and significant compared to other abiotic stresses worldwid (Akrami & Arzani,2019). Today, with the development of organic agriculture, reduction in the use of chemical fertilizers has been considered. The most important organic compounds used to improve soil properties include plant debris, agricultural waste, animal manure, sewage, green manure, and biochar. Biochar is a carbon (C)-rich product produced through the thermal decomposition of biomass including wood, fertilizers, leaves, straw, and agricultural waste in anaerobic or low aerobic conditions; this process is called pyrolysis (Lehmann & Joseph,2009). Biochar increases plant yield and soil fertility through direct and indirect effects. Due to the porous structure, high specific surface area, and ability to absorb soluble organic matter, gases, and inorganic nutrients, biochar is considered to be a suitable habitat for soil microorganisms (Lawrinenko & Larid,2015). The direct effects of biochar include increasing the supply and availability of elements such as nitrogen (N) and phosphorus (P) in the soil, which in turn increase the growth of plants (Lawrinenko & Larid,2015). In addition to directly releasing soluble P and some essential nutrients, biochar can increase the ion exchange capacity of the soil (Lehmann et al.,2003) and may alter the accessibility of P through providing anion exchange capacity or affecting the activity of cations that interact with P. Recent studies have reported that biochar can increase soil water holding capacity (Basso et al.,2013; Mendez et al.,2012), by changing the distribution of particle size and soil porosity because of its high specific surface area (Sun et al.,2014). Adding 10, 50, and 100 tons of biochar per hectare increased soil CEC, pH, C, sodium (Na), potassium (K), calcium (Ca), and magnesium (Mg) and also N, P, K, Ca, and Mg in radish plants, with the highest effect being associated with the biochar rate of 100 tons per hectare (Chan et al.,2008). An increase in plant height, stem thickness, root length, total absorbable N, and dry biomass was reported in corn by using 60 tons of biochar per hectare (Widowati & Soehono,2012). Another study examined the rates of 0%, 5%, 10%, 15%, 20%, and 30% biochar by soil dry weight in bell pepper. Results indicated that 10% biochar treatment had the highest effect on increasing plant height, root length, leaf number and area, plant dry weight, and yield compared to other treatments (Jalali,2006). Most of the agricultural land in Fars Province in Southern Iran is poor in organic matter, which has adverse effects on maintaining soil moisture content and plant absorption of essential nutrients, and farmers have to apply significant amounts of animal manure annually. Therefore, the aim of this study was to investigate the effects of the use of palm leaf biochar on the soil organic matter, availability of soil nutrients, and absorption of the nutrients in melon plants under drought stress.
Material and Methods
This experiment was carried out in 2016 and 2017 in an agricultural farm in Zarrindasht region of Fars Province, Iran, with an altitude of 1,021 m above sea level. In the year before planting, the farm was fallow plowed and leveled. Before planting, soil was sampled and some its chemical properties were evaluated (Table 1). The palm remains were air dried, crushed, and then packed in aluminum sheets to limit the aeration and were placed in oven for 4 hr at 560 °C to produce biochar (Mendez et al.,2012). Table 2 shows some chemical properties of biochar used in the experiment. This experiment was conducted in a split plot form based on randomized complete block design with three replicates. The main plot was drought stressed at three levels (60%, 85%, and 100% water requirement) and the subplot had biochar in four levels (0, 150, 300, and 450 g biochar per plant) (Table 3). Biochar was mixed with soil at 10 cm depth and seed were sown at an appropriate depth on the rows at distance of 2.5 m and 0.5 m on the row. Drip irrigation was applied by placing a dripper beside each plant in order to measure the amount of water consumed by the plant. At the four to five leaf stage, 50 kg ha−1 of N, 40 kg ha−1 of P, and 40 kg ha−1 of K was added to the soil in the form of urea, potassium sulfate, and triple super phosphate, respectively. To estimate the amount of plant water requirement, meteorological data including minimum and maximum temperature, minimum and maximum humidity, solar radiation, and wind speed were obtained from the Zarrindasht Meteorological Office. The amount of evapotranspiration of melon plants was measured and the daily water requirement of the plant was calculated using the appropriate formulas for 2 years.
Table 2
Some chemical properties of biochar used in the experiment.
| pH | EC(dS m−1) | N(%) | P(%) | K(%) | Ca(%) | Mg(%) | Fe(ppm) | Zn(ppm) | Cu(ppm) | Mn(ppm) |
|---|---|---|---|---|---|---|---|---|---|---|
| 9 | 7.5 | 0.74 | 0.122 | 0.83 | 0.05 | 0.02 | 983.2 | 32.4 | 2 | 139.3 |
Table 3
Treatments of the experiment.
Before the fruit harvest, five young fully expanded leaves from each plant were sampled and chlorophyll a, b, total chlorophyl (Arnon,1949), and proline content (Bates et al.,1973) was determined. Leaf samples were washed with distilled water, dried at 65 °C for 48 hr in an oven, and ground. Total leaf N was determined by micro-Kjeldahl method (Bremner,1996). The ground leaf samples were ashed at 550 °C and digested with 2 N hydrochloric acid. Phosphorus concentration in the extracts was determined by the yellow color method (Jackson,2005) and K – using flame photometer (Helmke & Sparks,1996). Concentrations of Fe, Zn, Mn, and Cu were determined by an atomic absorption spectrophotometer (PG 990; PG Instrument, UK).
At the end of the experiment, one soil sample was collected from each treatment (depth of 0–30 cm), air-dried, and sieved (<2 mm) for laboratory analyses. Particle size distribution including sand, silt, and clay content was determined by the method of Rowell (1994). Soil pH and EC were determined in saturated soil paste and in saturated extract, respectively (Richards,1954, pp. 83–100). Percentage of organic C was determined by the method of Nelson and Sommers (1982). Total N of soil sample was determined by Kjeldahl method (Bremner,1996). Soil P content was measured by blue color method (Olsen,1954). Available K content was extracted with 1 N ammonium acetate according to the method of Helmke and Sparks (1996) and K concentration was measured by flame photometer (Corning 405; ELE, UK). Statistical analysis was performed using the SAS software (V9) (SAS Institute, USA). Differences between the mean values were detected by least significant differences (LSD) test at 5% level.
Results
Proline and Chlorophyll Content
Results indicated that effects of drought stress, biochar, and their interactions on leaf proline, chlorophyll a, b, and total chlorophyll content were significant (Table 4). The lowest rate of proline was associated with Wr3B3 treatment, and it was not significantly different from Wr3B4 treatment. The highest proline content was related to the biochar-free treatment with 60% water requirement and was significantly different from other treatments (Table 5). Wr3B3 treatment increased total chlorophyll content by 131% compared to the biochar-free treatment and 60% water requirement and there were no significant differences between Wr3B4, Wr2B3, and Wr2B4 treatments (Table 5). The highest chlorophyll a and b content was related to Wr3B4; these characteristics increased by 169% and 127%, respectively, compared to Wr1B1 treatment (Table 5). Among all characteristics, the lowest concentration was associated with biochar-free treatment and 60% water requirement.
Table 4
Analysis of variance (ANOVA) for the effect of biochar on some properties of melon plants under drought stress.
Table 5
The effects of biocharand drought stress on biochemical properties of melon plants under drought stress.
Leaf Macro and Micro Element Content
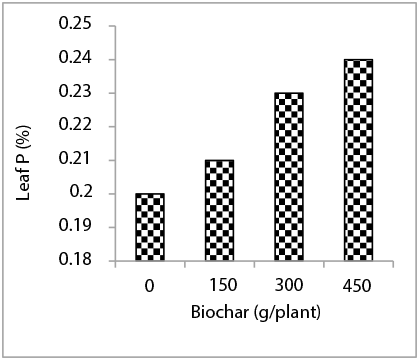
Results indicated that drought stress, biochar, and their interaction significantly affected leaf nutrient concentration, except for the interactive effects for P and Mg (Table 6). Treatment of Wr4B4 increased leaf N (Figure 1), K (Figure 2), Ca (Table 6), and Mn concentration (Table 6) by 58%, 65%, 44%, and 48% compared to the biochar-free treatment and 60% water requirement, respectively. Leaf N content in Wr4B4 treatment was not significantly different from Wr4B2, Wr4B3, Wr4B2, and Wr4B3 treatments (Figure 2). Wr4B3 and Wr3B4 treatments increased leaf Ca content by 30% and 20%, respectively, compared to the Wr1B1 treatment (Table 7). In addition, the Wr4B4 treatment was not significantly different from Wr3B3 and Wr3B4 treatments in terms of Mn (Table 7). The treatment of 450 g biochar per plant increased P (Figure 3) and Mg by 20% and 31%, respectively, compared to the biochar-free treatment and accounted for the highest values. The comparison of drought stress treatments revealed that the treatment of 100% water requirement increased leaf P and Mn by 36% and 31%, respectively, compared to the treatment of 60% water requirement. The interaction between drought stress and biochar showed that the Wr1B4 treatment increased leaf Fe, Zn, and Cu content by 60%, 44%, and 66%, respectively, compared to the Wr1B1 treatment (Table 7), and the lowest concentration was in Wr4B1. The highest content of Fe was obtained in the Wr1B4 treatment and was not significantly different from Wr1B1, Wr1B2, Wr2B3, Wr2B4, and Wr4B3 treatments (Table 7). Leaf Zn content in the Wr1B4 treatment was not significantly different from Wr1B3 and Wr2B3 treatments (Table 7). In terms of Cu, the Wr1B4 treatment was not significantly different from Wr1B3 and Wr2B4 treatments (Table 7).
Table 6
Analysis of variance (ANOVA) for the effect of biochar on leaf nutrient content of melon plants under drought stress.
Figure 1
The effects of the interaction of drought stress and biochar on N content of melon leaf. Mean values with the same letters are not significantly different at p ≤ 0.05 according to LSD test.
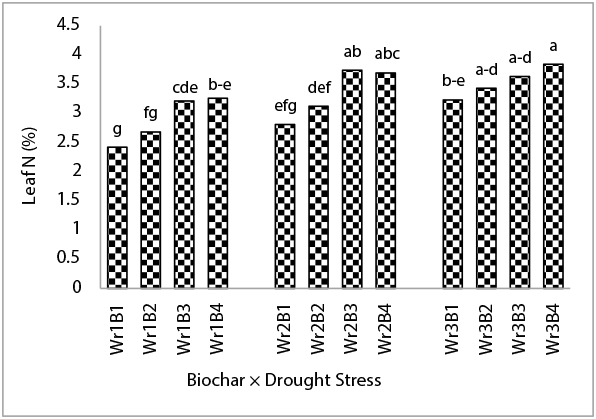
Figure 2
The effects of the interaction of drought stress and biochar on K content of melon leaf. Mean values with the same letters are not significantly different at p ≤ 0.05 according to LSD test.
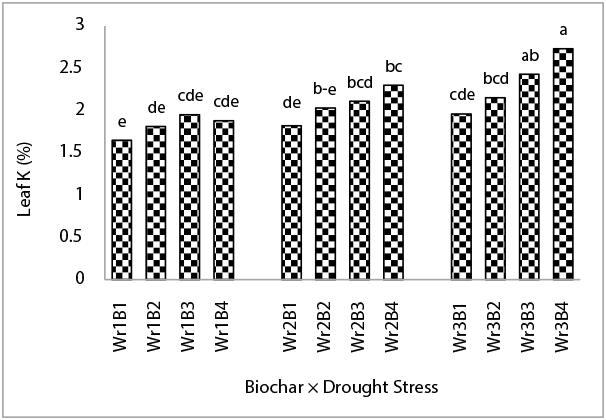
Table 7
Leaf nutrient concentrations of melon plants in different levels of biochar and drought stress.
Soil Organic Matter, pH, EC, and Macroelements
Results indicated that drought stress, biochar, and their interaction was significant on EC, soil N and K concentration. However, the interaction of drought stress and biochar was not significant on pH, soil P, and organic matter content (Table 8).
Table 8
Analysis of variance (ANOVA) for the effects of biochar on some soil properties under drought stress.
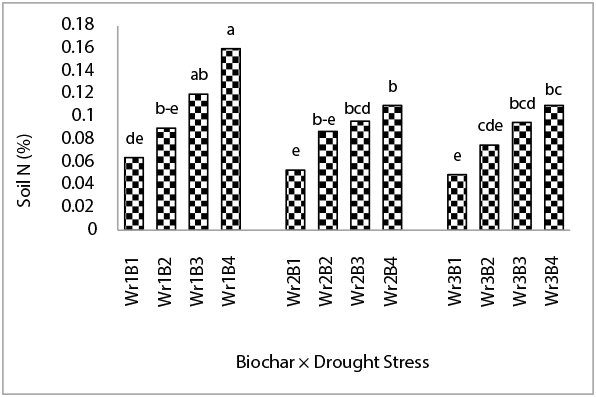
The Wr1B4 treatment increased soil N content by 150% compared to Wr1B1. The lowest concentration was related to the Wr4B1 treatment as well (Figure 4).
Figure 4
The effects of the interaction of drought stress and biochar on soil N concentration. Mean values with the same letters are not significantly different at p ≤ 0.05 according to LSD test.
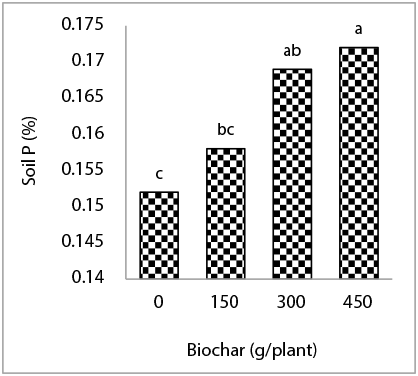
The highest concentration of soil P was observed in the treatment of 450 g biochar per plant and the lowest soil P content was related to the biochar-free treatment. Soil P content in treatment with 60% water requirement was 38% higher than that of the treatment with 100% water requirement. In addition, the treatment with 100% water requirement reduced soil P content by 16% compared to the treatment with 85% water requirement (Figure 5).
Figure 5
The effects of the interaction of drought stress and biochar on soil P content. Mean values with the same letters are not significantly different at p ≤ 0.05 according to LSD test.
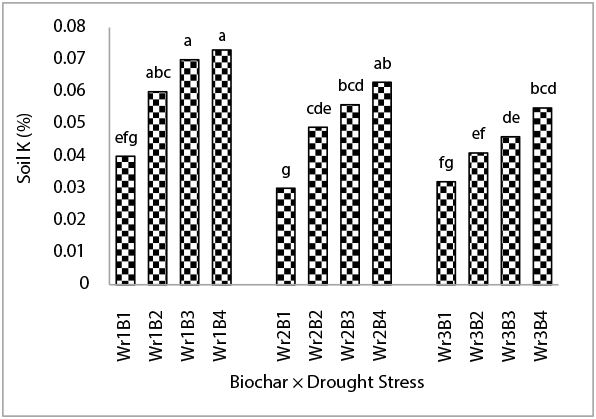
Wr1B3 and Wr1B4 treatments increased soil K content by 80% and 75%, respectively, in comparison to the Wr1B1 treatment. The highest and the lowest soil K content were related to Wr1B4 and Wr3B1 treatments, respectively (Figure 6).
Figure 6
The effects of the interaction of drought stress and biochar on soil K content. Mean values with the same letters are not significantly different at p ≤ 0.05 according to LSD test.
The treatment of 450 g biochar per plant increased the soil organic matter by 130% compared to without biochar, however it was not significantly different from the treatments of 300 g and 150 g biochar per plant (Table 9).
Treatment of 450 g biochar per plant increased soil pH by 3%, however there was no significant difference compared to the treatment of 300 g biochar. In addition, the lowest pH was related to the treatment without biochar (Table 9).
Table 9
The effects of biochar levels on organic matter content and soil pH.
| Treatment (g plant−1) | Soil properties | |
| Organic matter content (%) | pH | |
| 0 | 1.0 c | 8.12 c |
| 150 | 1.4 bc | 8.15 bc |
| 300 | 2.1 ab | 8.26 ab |
| 450 | 2.3 a | 8.35 a |
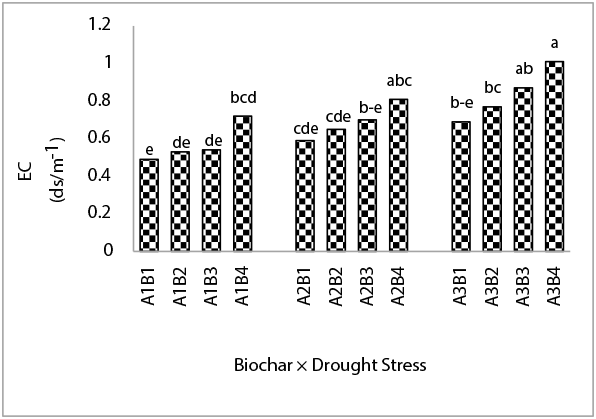
The Wr3B4 treatment increased soil EC by 106% compared to the Wr1B1 treatment and was not significantly different from Wr3B3 and Wr2B4. The lowest EC was also associated with the Wr1B1 treatment (Figure 7).
Discussion
Results showed that increasing the amount of biochar from 150 to 450 g per plant and the water requirement from 60% to 100%, decreased leaf proline content, consequently the lowest proline concentration was associated with Wr3B3 and Wr3B4 treatments.
Similarly, it was observed that drought stress caused reduction in leaf water capacity of grape and, thus, increased proline through the use of biochar in in vitro media (Rasouli & Golmohammadi,2009).
Reduced chlorophyll content was reported to indicate drought stress in various crops such as Silybum marianum (Keshavarz Afshar et al.,2016) and sunflower (Ghobadi et al.,2013), because it prevents chlorophyll synthesis or exacerbates chlorophyll decomposition. The use of biochar increases leaf chlorophyll content due to its direct effect on the absorption of Mg, which is an important component of the chlorophyll pigment (Hashem et al.,2016).
Moreover, Akhtar et al. (2015) indicated that the use of biochar produced from rice husk and flaxseed significantly increased N content and thus the vegetation index in wheat. These results are in agreement with the results of our experiment, which showed that Wr2B3 and Wr2B4 treatments decreased the effect of drought stress and also increased the chlorophyll content by increasing N and Mg levels in the leaves (Table 6). Nitrogen is a mobile element in the soil, therefore, addition of biochar to the soil by increasing water retention decreases the nitrate leaching and increases N availability, and this effect is stable for at least 5 months (Clough et al.,2013). Generally, there are different reports on the effect of drought stress on the concentrations of nutrients in plant species. Nitrogen reduction in water stress conditions (Alam,1999; Ram et al.,1995) and its increase under drought stress (Rahman et al.,1971) have been reported. In this experiment, Wr2B3, Wr2B4, Wr3B3, and Wr3B4 treatments increased leaf N content by 54%, 52%, 50%, and 58%, respectively, while soil N content was the highest in Wr1B3 and Wr1B4 treatments. These results showed that by increasing biochar and decreasing drought stress, soil N content could be maximized. The 85% water requirement treatment could compensate for its water deficit and increase N uptake through using biochar; however, for the 60% water requirement, N uptake was reduced due to the lack of water even with the use of biochar.
Increasing dissolved K by the use of biochar is related to its source, especially the amount of available K, the rate of K release, and the effect of organic molecules on K release (Jalali,2006; Laird et al.,2010; Najafi-Ghiri,2015). In drought stress conditions, the overall growth of the plant decreases as well as the absorption capacity of the roots and thus it is not able to absorb K from the surface of clay colloids and, thus, the rate of absorption of these elements decreases. Based on this hypothesis, addition of biochar reduces drought stress and, hence, increases K in the soil (Radin & Eidenbock,1984). In this study, soil K content in Wr1B2, Wr1B3, and Wr1B4 treatments was higher by 50%, 75%, and 82%, respectively, than in the Wr1B1 treatment, and had the highest rates compared to other treatments. However, K rate increased with decreasing stress, so that the Wr3B3 and Wr3B4 treatments increased leaf K content by 47% and 65%, respectively, compared to the Wr1B1 treatment.
The stabilization of P and K in the soil in water deficit conditions is another cause of deficiency of these elements in the plant (Heidari Sharifabad,2000). The effect of organic matter on increasing P availability in the soil relies on P content in the organic matter. Due to the low amount of the absorbable P of the palm leaf biochar, this increase can be attributed to acids released from organic matter. These acids reduce P stabilization in the soil and transform it into the form which is absorbable by the plant. The absorption of available nutrients and water absorption by the plant roots are closely related. Water relations affect all physiological processes associated with the solubility and availability of nutrients (Alam,1999). Drought stress severely restricts P transfer to the branches (Resnik,1970). However, due to high exchange capacity and water holding capacity, the use of biochar maintains this element in the soil and thus increases its absorption by plants. In this experiment, the addition of 150, 300, and 450 g biochar per plant increased both soil P content (by 3%, 11%, and 13%, respectively) and plant P content (by 5%, 15%, and 20%, respectively). Results of this experiment showed that with increasing drought stress soil P and K availability decreased, but leaf P content increased with increasing biochar in the soil.
In this experiment, the application of Wr3B2, Wr3B3, and Wr3B4 treatments increased leaf Ca content as 8%, 30%, and 44%, respectively, compared to the Wr1B1 treatment. Some researchers (Heidari & Rezapor,2011) also reported that the movement of Ca from soil to root surface decreased with the decrease in soil moisture. They also found that the absorption of Ca by the plant depends to a great extent on the speed of transpiration, and the decrease of transpiration rate in drought stress conditions reduces the absorption of Ca.
The treatment of 450 g biochar per plant increased leaf Mg content by 31% compared to the treatment without biochar and did not show any significant difference with treatments of 300 g biochar per plant. Results also showed that the 100% water requirement treatment increased plant Mg concentration by 31% compared to the treatment with 60% water requirement. Mg absorption increased with decreasing drought stress. The use of biochar results in an increase of soil water storage capacity and release of high levels of alkaline cations such as Ca and Mg in the soil, resulting in an increase of soil pH (Yuan & Xu,2011). Some studies reported increased Ca and Mg content in some vegetables such as spinach and wild cabbage due to the application of biochar (Gartler et al.,2013). In addition, the increase in Ca availability due to the use of 40 tons of walnut shell biochar in a coastal soil has been reported (Novak et al.,2009). Moreover, reported that biochar application increases the absorption of P, K, Ca, Zn, and Cu and thus improves plant growth (Lehmann et al.,2003).
In this study, treatments of 60% and 85% of water requirement increased the amount of Fe (76% and 107%, respectively), Zn (74% and 13%), and Cu (13% and 18%), compared to the control (stress-free). In addition, with the use of biochar, especially in Wr1B3, Wr2B3, Wr1B4, and Wr2B4 treatments, Fe absorption increased by 33%, 48%, 60%, and 32%, respectively, Zn absorption increased by 24%, 16%, 44%, and 3%, and Cu absorption increased by 51%, 25%, 65%, and 47%, compared to the Wr1B1 treatment. Furthermore, leaf Mn content increased by using biochar and decreasing drought stress, so that the application of 150, 300, and 450 g of biochar per plant and 60% of water requirement increased the leaf Mn rates by 7%, 17%, and 18%, respectively. Results showed that water deficit stress increased leaf Fe, Zn, Cu, and Mn content and adding biochar from 150 to 450 g per plant increased the amount of these elements by the same rates. Changes in the availability of micronutrients in the soil are affected by the soil organic matter content, as its decomposition releases nutrients (van Herwijnen et al.,2007). However, several mechanisms are responsible for increasing (or decreasing) of soil nutrients (Sposito,1984). Studies have shown that adding biochar to the soil is effective on the availability of nutrient ions due to its ion exchange capacity and microbial activity (Atkinson et al.,2010). Soil organic matter content increased by adding biochar so that the treatment of 450 g biochar per plant increased the soil organic matter by 130% compared to the biochar-free treatment, however, there was no significant difference with the treatment of 300 g biochar per plant. The treatment of 150 g biochar per plant with 40% increase was also significantly different compared to the biochar free treatment. Addition of biochar to the soil increases C reserves and improves soil properties. Another part of the biochar C is oxidized after being added to the soil, and this oxidation results in the formation of negatively charged functional groups (Lawrinenko & Larid,2015). In addition, application of 5 and 10 tons of biochar per ha in the soil of lettuce increased organic C by 31% and 33%, respectively (Nigussie et al.,2012). Although, water drought stress had no effect on soil pH, the effect of biochar treatments was significant, so that the addition of 150, 300, and 450 g biochar per plant increased soil pH by 1%, 2%, and 3%, respectively. Biochar is commonly used in acidic soils to increase pH, thereby increasing the bioavailability of the elements and improving the microbial activity of the soil. Therefore, soil organic matter decomposition and organic matter mineralization may increase through increasing soil microbial activity (Lehmann & Joseph,2009). Yuan and Xu (2011) converted various plant debris into biochar and showed that all of them had alkaline pH, with the highest pH in soybean residue. The results of another study showed that the application of 5 and 10 tons of biochar per ha in the soil increased pH by 3% and 9%, respectively (Nigussie et al.,2012). In this study, adding biochar to the soil in all treatments significantly increased soil EC. By increasing biochar from 150 to 450 g per plant, the soil EC increased in the same rate. The increasing soil EC due to the use of biochar was probably due to the presence of soluble salts in the biochar and its higher EC than the soil EC (Chintala et al.,2013).
Conclusions
Drought stress increased leaf proline content; however, by using biochar, especially 300 and 450 g per plant, the effect of drought stress decreased and thus leaf proline content decreased as well. Addition of 450 g biochar per plant increased leaf P and N content compared to the treatment without biochar. Biochar also increased leaf Fe, Zn, and Cu as the concentration of these nutrients was the highest in the treatments of 300 and 450 g biochar per plant with 60% water requirement. Based on these findings, it can be concluded that the highest absorption of the elements was in the treatments of 300 and 450 g biochar per plant in conditions without drought stress. However, with increasing drought stress up to 85% of water requirement, no effect was observed regarding the reduction of absorption due to the application of biochar. The drought stress of 60% of water requirement decreased the absorption of elements due to excessive water deficiency, except for Zn and Cu, which had increased absorption rates under stress conditions. Since there was no significant difference between treatments of 300 and 450 g of biochar per plant in terms of the absorption of elements, and the use of these treatments in 85% water requirement could also compensate for water shortage, thus using 300 g of biochar per plant could be time- and cost-efficient.
