Introduction
Wheat is the second-most important cereal crop (after rice) in Bangladesh, where more than 50% of the wheat consumed is imported (Hossain & Teixeira da Silva,2013). During the 2014–2015 growing season, approximately 1.4 million tons of wheat were grown across 0.44 million hectares, resulting in an average yield of 3.2 t ha−1 (Uddin et al.,1981). Increasing cropping intensity (143% in 1971–1972 and 191% in 2014–2015) coupled with increasing cultivation of modern high yielding varieties (HYVs) has decreased soil fertility and increased micronutrient deficiencies in Bangladesh (Uddin et al.,1981), where more than 70% of cultivated soils are now zinc (Zn) deficient. Zn deficiency is the most common micronutrient deficiency in Bangladeshi crops, which was first identified in the late 1970s (CIP,2011) and remains a cause of concern today (Food and Agriculture Organization of the United Nations,2019). Wheat grains are typically low in Zn (Cakmak,2010; Cakmak & Kutman,2018), and consumption of low-Zn wheat-based products can lead to Zn deficiency (Ozturk et al.,2006).
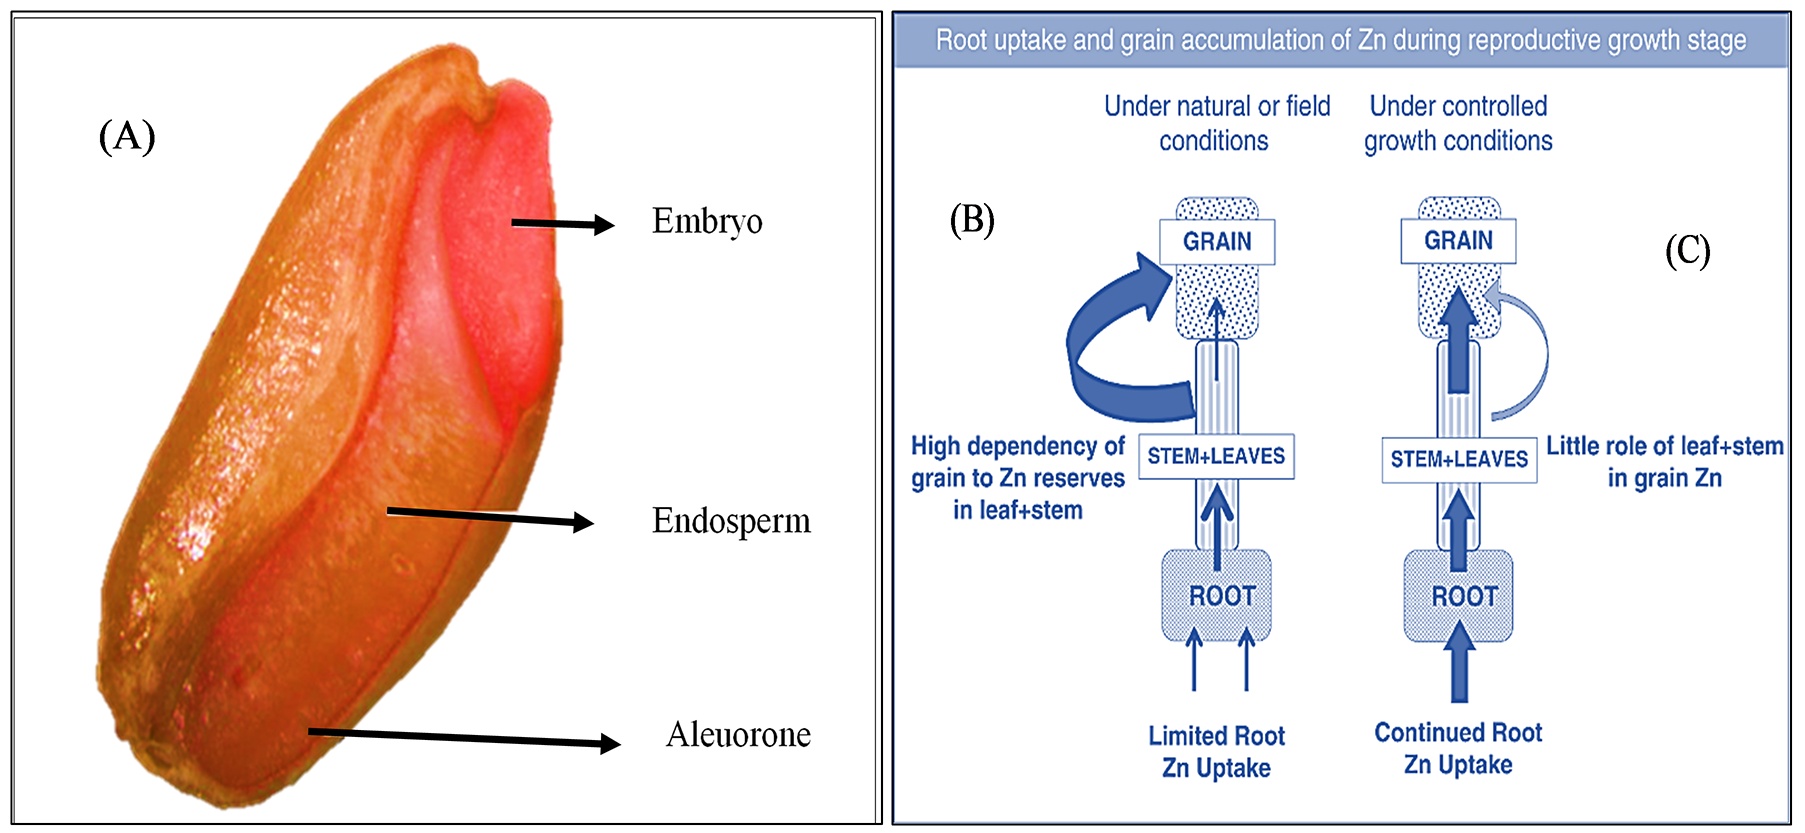
Ozturk et al. (2006) (Figure 1) observed that in wheat grains, Zn is concentrated in the aleurone and embryo (100 mg Zn kg−1), and highly processed white flour contains only 5–10 mg Zn kg−1. During milling, most Zn-rich parts of the wheat grain are removed, and only the Zn-poor endosperm remains (Cakmak,2000,2010; Cakmak & Kutman,2018). Micronutrient research is a promising area for improving the nutritive quality of wheat grains. The role of Zn as an important micronutrient has been well established, and it is crucial for enzymatic activity and assists in metabolism (Bai Bourdi & Malakouti,2003). Previous research has demonstrated the possibility of overcoming Zn deficiency by externally applying Zn to growing crops, which can also improve crop productivity (i.e., yield) (Cakmak,2008,2010; Cakmak & Kutman,2018). Zn is taken up by the roots of wheat plants and is then transported to the grains (Sperotto,2013). The amount of Zn in wheat grains depends on plant and soil factors, such as Zn and water availability in the root zone of plants during grain-filling (Cakmak & Kutman,2018) (Figure 1). Therefore, for the Zn-biofortification of wheat grains, it is necessary to maintain a satisfactory level of Zn and water in the soil during the reproductive stage of wheat, particularly at the grain-filling stage.
Figure 1
(A) Localization of Zn in wheat grains, visualized with dithizone as a Zn‐sensing dye that develops a red complex with Zn. The intensity of the red color is associated with the Zn concentration [see Ozturk et al.2006]. (B) Zn uptake and retranslocation from root to vegetative organs and then to grains in wheat plants under limited water or Zn availability or both during seed‐filling and (C) under controlled growth conditions with adequate water and Zn supply. Source: Cakmak & Kutman (2018)
Biofortification is the process of adding essential microelements to food crops through breeding or agronomic tools, to reduce malnutrition of rural populations (Bouis,2013). An important global challenge is to use biofortification to ensure a better quality of crop production, and thus, improve human health (Hotz & Brown,2004). Zn deficiency is ranked as the fifth leading risk factor for diseases in developing countries (World Health Organization,2002). In many low and middle-income countries, including Bangladesh, the micronutrient levels in food are below the minimum thresholds to prevent malnutrition. Preliminary studies indicate that Zn fortification of cereal seeds is possible through Zn fertilization, and the magnitude of fortification depends on the crops and varieties used. In addition, the protein concentration of wheat grains increases with increasing Zn concentration (Cakmak,2000,2010; Cakmak & Kutman,2018; Ozturk et al.2006). However, further studies are needed to confirm these observations and to quantify the likely effects of biofortification of local wheat varieties in Bangladesh. Biofortification through breeding (including genetic modification) and agronomic management (e.g., fertilizer application) are the two important agricultural tools for improving Zn concentration in cereal grains (Cakmak,2008; Cakmak & Kutman,2018). However, yield factor, interactions between genotype and environment, insufficient genetic diversity, consumer sentiment, and safety concerns about genetically modified crops have resulted in limited efforts to genetically bio-fortify wheat (Cakmak,2008; Cakmak & Kutman,2018). Instead, agronomic biofortification through Zn fertilization has the potential to increase Zn concentration in wheat grains as well as the yield productivity of wheat crops (Singh & Prasad,2014). Furthermore, cultivars developed by genetic biofortification still require Zn fertilization. Therefore, agronomic Zn biofortification could be a promising and cost-effective approach to enhance Zn concentration in wheat grains.
We hypothesized that Zn fertilization of appropriate wheat HYVs will increase both the Zn concentration in the grains and the wheat yield. This would subsequently increase food grain production, and aid in reducing the malnutrition prevalent in the Bangladeshi population. The aim of the present study was to examine the effects of Zn fertilization and the variety used on the yield and biofortification of wheat grains.
Material and Methods
Location
The study was conducted at the Soil Science Field Laboratory, at the Bangladesh Agricultural University (BAU) farm, Mymensingh, Bangladesh (24.75′ N, 90.50′ E, 18 m above mean sea level), between November 2015 and March 2016, over one wheat growing season.
Agro-Climatic Conditions
The land was medium high. The soil was classified as inceptisol, with the following soil parameters: Sand content, 20%; silt content, 64%, clay content, 16%; pH, 6.73 (1:5 soil:water); organic matter content, 3.23%; total N content, 0.179%; exch. K (me%) content; 0.196%; available status (mg kg−1) of P, S, Zn, Fe, and B were 7.35, 11.7, 0.780, 55.4, and 0.240, respectively (Table S1, Table S2). The experimental area had a subtropical climate. Details of the climate observed during the experiment are shown in Table S3.
Experimental Treatments and Design
Two wheat varieties and five Zn rates were used in the experiment. The wheat varieties were ‘BARI Gom 25’ (V1) and ‘BARI Gom 26’ (V2), and the Zn rates were T1: Zn0 (control, no Zn applied); T2: Zn1.5 (1.5 kg Zn ha−1); T3: Zn3.0 (3.0 kg Zn ha−1); T4: Zn4.5 (4.5 kg Zn ha−1); T5: Zn6.0 (6.0 kg Zn ha−1). The two wheat varieties were provided by the Bangladesh Agricultural Research Institute (BARI), Gazipur, Bangladesh. The experiment was conducted in a split-plot design with three replicates, where the Zn treatments were distributed to the sub-plots and the wheat varieties were in the main plots. To ensure that no other nutrients were limiting, 120 kg N (as urea), 30 kg P (as triple superphosphate), 60 kg K (as muriate of potash), 10 kg S (as gypsum), and 1.5 kg B (as boric acid) were applied per hectare. The plot size for each treatment was 5 m × 2.5 m. The plots were separated by 0.5-m bunds, and the treatment block-to-block distance was 1 m.
Experimental Procedure
Before sowing, the land was prepared by repeated ploughing with a power-tiller (two-wheeled tractor) and country plough. Weeds and stubbles of the previous crop were removed from the field. One-third of urea and the full dose of all other fertilizers were applied during final land preparation. The second third of urea was applied immediately after first irrigation [25 days after sowing (DAS), at the crown root stage] and the final third was applied 55 DAS (at the late booting stage). Zn fertilizer, in the form of zinc sulphate (ZnSO4·7H2O) containing 23% Zn, was applied to the experimental plots and incorporated into the soil by hand. Wheat seeds were sown at a rate of 125 kg ha−1. Seeds were sown continuously along lines 20 cm apart. Plots were irrigated twice; the first irrigation was at 25 DAS and the second was at 55 DAS. Weeding was conducted two times during the growth period, first at 21 DAS and then at 50 DAS.
The crop was harvested at maturity. Harvested crops from each plot were bundled separately and dried in situ. Grains were threshed, cleaned, and processed, and the weight of both grain and wheat straw was recorded for every plot.
Data Collection
Data on plant height, tillers m−2, spike length, spikelets spike−1, grains spike−1, 1,000-grain weight, and grain and straw yields were recorded for each plot. Plant height (cm) was measured from the ground level to the top of the spike. From each plot, the height of 10 plants was measured and averaged. The number of tillers per plant was counted for 10 plants from each plot. Spike length (cm) was measured from the basal node of the rachis to the apex, for 10 spikes. The number of spikelets spike−1, grains spike−1, and 1,000-grain weight were recorded from 10 randomly selected spikes. Grain yield (t ha−1) and 1,000-grain weight (g) were adjusted for 12% moisture. After harvesting, straws from each unit plot were dried in an oven at 70 °C for 72 hr and weighed.
Analysis of Soil Samples
Soils were collected from a depth of 0–15 cm at five locations and aggregated into a composite sample. The samples were air-dried, ground, and sieved. Soil texture was determined by the hydrometer method, and Marshall’s triangular coordinate USDA system was followed for soil textural classification. Soil pH was determined by a glass electrode pH meter. Soil organic carbon content was determined by the wet oxidation method (Page et al.,1982). The amount of organic matter was estimated by multiplying the organic carbon percentage with the van Bemmelen factor, i.e., 1.73.
Total N concentration in the soil was estimated by the Kjeldahl method. The soil was digested with 30% H2O2, H2SO4, and a catalyst mixture (K2SO4:CuSO4·5H2O:Se; 10:1:0.1). Nitrogen in the digest was determined by distillation with 40% NaOH followed by titration of the distillate trapped in H3BO3 with 0.005 M H2SO4 (Page et al.,1982). Available P in the soil was determined using 0.5 M NaHCO3 solution with a pH of 8.5. The P in the extract was then determined through the development of blue color by the reduction of phosphomolybdate complex using SnCl2 and measuring the color by a spectrophotometer at 660 nm wavelength (Page et al.,1982). Exchangeable K content in the soil sample was determined by extraction with 1 M NH4OAc solution at pH 7.0, followed by the determination of extractable K by a flame photometer (Page et al.,1982). Available S content of the soil was determined by extracting soil samples with CaCl2 (0.15%) solution, as described by Olsen and Sommers (Page et al.,1982). The available S content in the extract was determined turbidimetrically, and the turbidity was measured using a spectrophotometer at 420 nm wavelength. For the determination of available Zn and Fe contents in the soil, the DTPA (diethylenetriaminepentaacetic acid) extraction method was used (Hunter,1984). The concentrations of Zn and Fe in the extract were estimated using an atomic absorption spectrophotometer (AAS). Available B content was determined by extracting the soil sample in hot water, followed by determining the extractable B by the azomethine-H method (Hunter,1984).
Plant Analysis
Preparation of Samples
To determine the N, Zn, and Fe concentrations in wheat grains, grain samples were dried at 65 °C for 48 hr and then ground using a mortar and pestle. The ground grains were stored in paper bags in a desiccator prior to analysis.
Digestion of Plant Samples With Nitric-Perchloric Acid
A 0.5-g subsample of the ground grain was added to 10 mL of diacid mixture (HNO3:HClO4 in the ratio of 2:1), which was then heated to 180 °C. Heating was momentarily stopped when dense white fumes of HClO4 were observed, and the mixture was then boiled until it became clear and colorless. Zn and Fe concentrations were then determined using the single digestion method (Yoshida et al.,1971).
Digestion of Plant Samples With Sulfuric Acid
The N concentration of wheat grains was analyzed following the Kjeldahl method, as described in section 2.6.
Determination of Elements
N Concentration
The N concentration in the digest was determined by distillation with 40% NaOH followed by titration of the distillate trapped in H3BO3 with 0.005 M H2SO4, following the method described by Page et al. (1982).
Zn and Fe Concentrations
The concentrations of Zn and Fe in the extract were estimated using an atomic absorption spectrophotometer (AAS), following the method described by David (1958).
Statistical Analysis
The analysis of variance (ANOVA) and mean separation test for various crop characteristics and nutrient concentrations in plants and soils were performed using the statistical package STAR version 2.0.1, developed by International Rice Research Institute (IRRI) (2014). Mean comparisons of the treatments were adjudged by Duncan's multiple range test (Gomez & Gomez,1984). Correlation statistics were performed to examine the relationship between nutrient (N, Zn, and Fe) concentrations and Zn rates used in the study.
Results
Effects of Zn Fertilization on the Growth- and Yield-Contributing Characteristics of Wheat
Zn fertilization significantly affected all growth- and yield-contributing characteristics of wheat, except plant height and 1,000-grain weight (Table 1). Overall, better performance was observed in the Zn3.0 treatment (Table 1). For the tested varieties, significant differences were observed only in spikelets spike−1, grains spike−1, and 1,000-grain weight (Table 2). ‘BARI Gom 26’ produced a higher number of spikelets spike−1 and grains spike−1, whereas ‘BARI Gom 25’ produced the maximum 1,000-grain weight (Table 2). However, there was no significant effect of Zn treatment on the growth- and yield-contributing characteristics of wheat when Variety × Zn Rate interaction was considered (Table 3).
Table 1
Growth- and yield-contributing characteristics of wheat influenced by Zn rates.
Table 2
Growth- and yield-contributing characteristics of wheat influenced by the varieties.
Table 3
Growth- and yield-contributing characteristics of wheat influenced by Variety × Zn Rate interaction.
Effects of Zn Fertilization on the Yield of Wheat
The grain yield of wheat was significantly influenced by the Zn application (Table 4). On comparing the performances of the five rates of Zn application, Zn3.0, Zn4.5, and Zn6.0 were equally effective in correcting Zn deficiency and producing grain yield. The highest grain yield (3.90 t ha−1) was obtained in the Zn3.0 treatment, which was significantly higher than that obtained for all other treatments, except Zn4.5 and Zn6.0 (Table 4). The Zn0 treatment produced the lowest grain yield, which was statistically similar to the Zn1.5 treatment. The Zn3.0 treatment produced 30% higher yield than the control Zn0. The crop varieties did not vary significantly based on this parameter (Table 5). There was no significant interaction between variety and zinc application on the grain yield of wheat (Table 6).
The straw yield of wheat was not significantly affected by the Zn rate, variety, and the interaction of Variety × Zn Rate (Table 4–Table 6). The harvest index of wheat was influenced by Zn application (Table 4). It was observed that the Zn3.0 treatment resulted in the highest harvest index (45.3%), whereas the Zn control treatment (Zn0) had the lowest harvest index (38.4%). The crop varieties did not vary significantly in terms of this parameter (Table 5). There was no significant interaction between variety and zinc application on the harvest index of wheat (Table 6).
Table 4
Grain and straw yields of wheat influenced by Zn rates.
Table 5
Grain and straw yields of wheat influenced by the wheat varieties.
| Variety | Grain yield (t ha−1) | Straw yield (t ha−1) | Harvest index (%) |
| V1 | 3.48 | 5.22 | 40.0 |
| V2 | 3.52 | 4.74 | 42.8 |
| CV (%) | 5.30 | 16.82 | 8.2 |
| F test | NS | NS | NS |
Table 6
Grain and straw yields of wheat influenced by Variety × Zn Rate interaction.
Effects of Zn Fertilization on Nutrient Concentrations in Wheat Grain
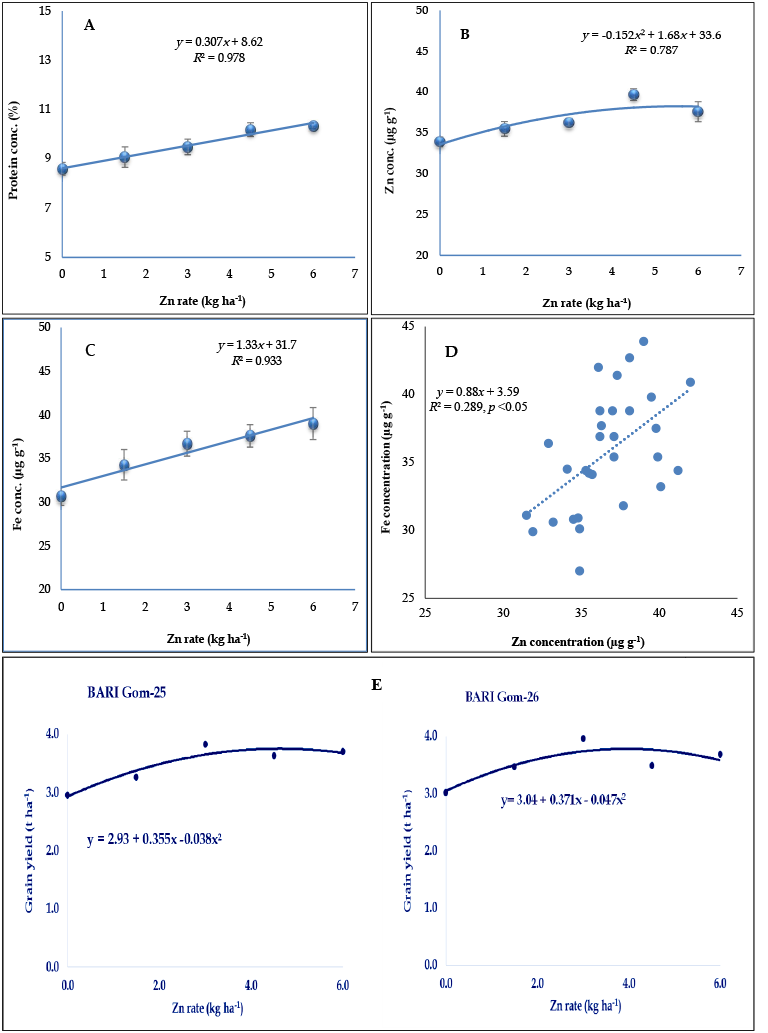
Wheat grains were analyzed for N, Zn, and Fe concentrations (Table 7–Table 9). The N concentration of wheat grains was significantly influenced by the rate of Zn application (Table 7). The highest grain N concentration (1.77%) was recorded in the Zn6.0 treatment, which was statistically different from that observed in all other treatments, except Zn4.5. The control treatment had the lowest grain N concentration (1.47%) (Table 7). The grain N concentration was slightly higher in ‘BARI Gom 26’ (1.65%) than in ‘BARI Gom-25’ (1.61%) (Table 8). There was no significant interaction between variety and zinc application rate in case of grain N concentration (Table 9). The protein concentration of wheat grains was calculated as %N × 5.85; thus, Zn treatments had a similar influence on grain protein concentration as on grain N concentration (Table 7). These results clearly indicate that Zn is involved in protein synthesis. Zinc activates glutamic dehydrogenase and promotes the synthesis of RNA and DNA, subsequently enhancing the content of gliadin and glutenin, which are the main protein components of gluten accumulated in the later stage of grain filling.
The grain Zn concentration was markedly influenced by Zn fertilization (Table 7). The comparison of the five rates of Zn application showed that Zn4.5 had the highest Zn concentration (39.7 µg g−1), which was statistically different from all other treatments. The control treatment had the lowest Zn concentration (33.9 µg g−1). Zn concentrations of wheat grains under Zn4.5 and Zn6.0 treatments were 17.1% and 10.9% higher than in the control treatment, respectively (Table 7). The highest Zn fortification of wheat grains was achieved in the Zn4.5 treatment. The grain Zn concentration increased with the Zn application rate in a quadratic line (Figure 2), indicating that the grain Zn concentration peaked in the Zn4.5 treatment and then declined. The grain Zn concentration was not affected by variety (Table 8). Furthermore, the interaction effect of variety and zinc application rate on grain Zn concentration was not significant, showing that the influence of zinc application on grain Zn concentration was unaffected by the wheat variety (Table 9).
Table 7
Nitrogen, protein, Zn, and Fe concentrations of wheat grains influenced by zinc rates.
Table 8
Nitrogen, protein, Zn, and Fe concentrations of wheat grains influenced by varieties.
| Variety | N (%) | Protein (%) | Fe (µg g−1) | Zn (µg g−1) |
| V1 | 1.61 | 9.42 | 33.3 b | 36.1 |
| V2 | 1.65 | 9.65 | 38.1 a | 37.1 |
| CV (%) | 1.80 | 1.82 | 4.72 | 5.88 |
| F test | NS | NS | ** | NS |
Table 9
Nitrogen, protein, Zn, and Fe concentrations of wheat grains influenced by Variety × Zn Rate interaction.
Similar to N and Zn concentrations, the Fe concentration of wheat grain responded significantly to Zn application (Table 7). The highest grain Fe concentration (39.0 µg g−1) was observed in the Zn6.0 treatment. The control treatment produced the lowest grain Fe concentration (30.7 µg g−1) (Table 7). Zinc application linearly increased the grain Fe concentration, and the application of Zn at the rate of 1 kg ha−1 increased the Fe concentration in wheat grain by 1.32 µg g−1 (Figure 2C). The wheat varieties differed significantly in the grain Fe concentration, in the order of ‘BARI Gom 26’ (38.1 µg g−1) > ‘BARI Gom 25’ (33.3 µg g−1) (Table 8). Furthermore, the interaction effect of variety and zinc application rate on grain Fe concentration was also significant (Table 9). The grain Fe concentration was the highest in V2 × Zn6.0 (42.7 µg g−1), which was statistically similar to V2 × Zn4.5 (39.8 µg g−1), whereas it was the lowest in V1 × Zn0 (30.6 µg g−1) (Table 9). The Zn and Fe concentrations of wheat grain were weakly positively correlated (Figure 2D).
Figure 2
The influence of Zn rates on the yield and quality of wheat grains. (A–C) The effect of Zn application on protein, Zn, and Fe concentrations in wheat grains. (D) The relationship between Zn and Fe concentrations in wheat grains. (E) The Zn response curves of two wheat varieties under different levels of Zn.
Crop Response Curve
We used quadratic equations to describe the relationship between grain yield and Zn rates. From these equations, we determined optimum rates of Zn for the two varieties in this soil during this cropping season, following the procedure outlined by Gomez and Gomez (1984). Rate of nutrient (Ny) that maximizes yield was calculated as:
where b and c are the estimates of the coefficients in the equation. The equations thus obtained for Zn were
The optimum rate of Zn application to ensure it is nonlimiting to wheat yield was first identified with statistical analyses (F test – Fisher test and DMRT – Duncan’s multiple range test) and was then refined by applying the crop response curves described in Figure 2E. The optimum Zn rates varied for the two BARI varieties: For the conditions under the present experiment, it was 4.62 kg ha−1 for ‘BARI Gom 25’ (V1) and 3.94 kg ha−1 for ‘BARI Gom 26’ (V2).
Discussion
As the intensity and productivity of wheat crops have increased, soil fertility has declined and deficiencies of some micronutrients, including Zn, have emerged in Bangladeshi soils (CIP,2011; Food and Agriculture Organization of the United Nations,2019; Uddin et al.,1981). Most research has focused on increasing wheat yields rather than grain Zn concentrations. The aim of the present study was to determine the potential of Zn biofortification of wheat grains by fertilizer management.
Application of Zn fertilizer significantly influenced the wheat crop, which was assessed in terms of yield components (viz., tillers plant−1, spikes m−2, spike length, spikelets spike−1, and grains spike−1), grain yield, and nutrient concentrations (N %, Zn %, and Fe %) in wheat grain. Parameters like spikelets spike−1, grains spike−1, and 1,000-grain weight were markedly different for the two crop varieties. The interaction effects of zinc application rate and variety on the yield contributing characteristics were not significant. Application of Zn at 3.0 kg ha−1 coupled with the ‘BARI Gom 26’ (V2) variety demonstrated the best positive effect on the yield of wheat.
This result indicates that (i) the experimental field was clearly deficient in Zn and (ii) continuous application of Zn is required to increase the wheat yield. The increase in wheat grain yield due to the application of Zn may be because Zn plays an important role in the biosynthesis of IAA and the initiation of primordia for propagative parts. As a result, Zn has a favorable effect on metabolic reactions within the plant. Singh and Kumar (2012) have previously reported that increasing Zn fertilizer application rate increased wheat yield.
The N concentration of wheat grain was significantly influenced by Zn treatments (Table 7). The highest grain N concentration (1.77%) was recorded in the Zn6.0 treatment, which was statistically different from all other treatments, except Zn4.5. These results are in accordance with the findings of Singh and Kumar (2012) and Soleymani and Shahrajabian (2009). Zn application linearly increased the grain protein concentration, with the application of Zn at a rate of 1 kg ha−1 increasing the grain protein concentration by 0.30% (Figure 2A). As reported by Cakmak (2000), Zn promotes protein synthesis.
The grain Zn concentration, which was the main target in this study, was markedly influenced by Zn fertilization. The grain Zn concentration increased with Zn application rate in a quadratic line, indicating that grain Zn concentration could be enhanced by Zn fertilization up to Zn4.5, i.e., up to a 17.1% increase compared to the control, before declining (Figure 2B). Similar findings were reported by Cakmak (2008,2010) and Cakmak & Kutman (2018), who showed that wheat grain Zn concentration was increased from 11.7 (control) to 26.9 µg g−1 with Zn fertilization. Similar to the grain N concentration, the grain Fe concentration increased with Zn rates, and every increment of 1 kg ha−1 resulted in an increase of 1.32 µg g−1 Fe.
The significant effects of Zn treatment can be attributed to the low levels of Zn in the experimental field, demonstrated by the low level of (DTPA) extractable soil Zn (0.78 mg kg−1). As described in the Fertilizer Recommendation Guide (FRG,2012), the critical lower limit of (DTPA) extractable soil Zn is 0.60 mg kg−1. Crop response to an added nutrient is expected when the soil status of that nutrient lies below critical levels. Yilmaz et al. (1997) observed that Zn fertilization increased the grain yield as well as the grain Zn content. It is particularly important for Zn deficient soil (Cakmak,2010). There is evidence that supplementary applications of Zn, Cu, and Mo in crops can increase the levels of these micronutrients in rice and wheat grains (Duxbury et al.,2005, pp. 30–31).
There was no significant difference between the varieties in the accumulation of N and Zn in wheat grains. This might be due to similar genetic makeup or little genetic variation of the tested wheat varieties. Compared to cultivated wheat, wild and primitive wheat represent a better and more promising genetic resource for high Zn concentrations (Cakmak,2008). However, little information is available about the genetic control and molecular physiological mechanisms contributing to high accumulation of Zn and other micronutrients in grains with different genetic materials (Ghandilyan et al.,2006; Lucca et al.,2006; White & Broadley,2005). The present study demonstrates that several wheat varieties (landraces and modern varieties) need to be tested in order to screen out varieties with the ability to accumulate more Zn in the grain.
The response curve showed that 4.62 kg ha−1 for ‘BARI Gom 25’ and 3.94 kg ha−1 for ‘BARI Gom 26’ were the optimum Zn rates for achieving the maximum grain yield (Figure 2). However, 5.5 kg ha−1 was the optimum Zn rate for obtaining higher Zn fortification in wheat grains.
Conclusions
Our research shows that the experimental field was deficient in Zn and the application of Zn at a rate of 3.0 kg ha−1 gave the best results in terms of wheat grain yield. In the case of Zn concentration, Zn application at 4.5 kg ha−1 resulted in the highest grain Zn concentration (39.7 µg g−1), which was 17.1% higher than in the control treatment. Although not significant, ‘BARI Gom 26’ exhibited a better response in terms of yield and nutrient concentration. The response curve showed that 4.62 kg ha−1 for ‘BARI Gom 25’ and 3.94 kg ha−1 for ‘BARI Gom 26’ were the optimum Zn rates for achieving higher wheat grain yield. However, 5.5 kg ha−1 was the optimum Zn rate for obtaining higher Zn fortification in wheat grains.
Supporting Material
The following supporting material is available for this article:
Table S1: Morphological, physical, and chemical characteristics of the soil under the study.
Table S2: Initial soil analyses results and fertility class of the experimental site.
Table S3: Monthly record of air temperature, relative humidity, and rainfall during the period from November 2015 to March 2016.
Handling Editor
Małgorzata Wójcik; Maria Curie-Skłodowska University in Lublin, Poland; https://orcid.org/0000-0001-6674-0341
