. Introduction
In Bangladesh, wheat is the second-most important food source after rice. Among plant nutrients, zinc (Zn) is an essential trace element for the growth and development of plants (Broadley et al., 2007). Zn deficiency in soil has been found to be one of the major obstacles leading to yield loss in crops, particularly for wheat (Triticum aestivum L.), followed by nitrogen and phosphorus (Hotz & Braun, 2004). It is estimated that nearly 50% of the cereal-growing regions on the globe have soils with insufficient Zn availability. The problem is especially severe in regions with high soil pH, high soil CaCO3 content, and low soil organic matter content (Mirzapour & Khoshgoftar, 2006).
Among cereals, wheat provides nearly 20% of calories and protein per capita worldwide (Long, 2019; Wang et al., 2020). However, malnutrition is a worldwide issue because a quarter of the world’s population has one or more micronutrient deficiency problems (Kumssa et al., 2015). The issue is more severe in underdeveloped nations, where cereal grains account for between 50 and 70% of daily calories (Cakmak, 2008). In more than 40 nations, soil and plant Zn insufficiency is a severe micronutrient problem that affects about one-third of all agricultural soils worldwide (Alloway, 2008; Graham, 2008). Immune system performance, neurotransmission, intestinal signaling, and body growth are just a few of the many crucial roles of Zn (Herschfinkel et al., 2007; Wessels & Rink, 2020). Zn deficiency is also connected with several health problems, including sluggish physical growth, distorted immune systems, learning difficulties, and an elevated risk of infection (Gibson, 2006; Prasad, 2007; Wessels & Rink, 2020). Improving the daily Zn intake through wheat-derived processed foods is an important way to resolve Zn deficiency (Wang et al., 2020). Zn nutritional deficiency can be reduced by increasing the bioavailability of Zn in edible plant parts using biofortification (Abd El-Samad & Taha, 2022; Farooq et al., 2018; Ojeda-Barrios et al., 2023; Ullah et al., 2020). Genetic (conventional or molecular breeding and transgenic techniques) or agronomic approaches, including adequate soil and plant fertilizer administration, are the main interventions for Zn biofortification of food crops (Arsenault et al., 2015; Cakmak & Kutman, 2018).
Agronomic biofortification boosts the ability of crops to mobilize and use micronutrients as well as crop growth (Cakmak & Kutman, 2018; Hussain et al., 2012; Rehman et al., 2018a,b,c; Zuo & Zhang, 2009). The agronomic biofortification technique (such as using Zn fertilizers) provides a short-term remedy to the issue. In addition to Zn biofortification in grains, the rate, timing, and method of delivering Zn fertilizer to wheat crops affect plant development and production (Dawar et al., 2022; Jalal et al., 2022; Khattab et al., 2016). At the same time, breeding requires a more extended period to achieve success at the mark (Cakmak, 2008). The biofortification of grains in developing nations has been covered in numerous review publications (Cakmak, 2008; Rehman et al., 2018d; Ullah et al., 2020). Additionally, it highlights the advantages and financial aspects of agronomic biofortification with regard to crop productivity in field conditions and the status of genetic and agronomic biofortification. It also draws attention to the challenges facing Bangladesh’s efforts at agronomic biofortification. Considering the importance of Zn-biofortification in the grains of wheat, the current study was undertaken to assess Zn enrichment in a few common wheat cultivars using different Zn delivery techniques.
. Material and methods
. Experimental site
The experiment was carried out on the research farm of the Bangladesh Institute of Nuclear Agriculture in Jamalpur, Bangladesh, which is located at 24°56′04″N, 90°25′31″E. The Old Brahmaputra Floodplain is the agroecological zone 9 (AEZ-9) (FRG, 2018). The physical and chemical characteristics of the soil at the experiment site are presented in Table 1.
. Treatments and design
The treatments included three Zn application techniques with a control i.e., T1: control (without Zn), T2: Soil application of 4 kg Zn ha−1 at final land preparation, T3: Foliar application of a 0.5% Zn solution (ZnSO4 ⋅ 7H2O) at both tillering and booting stages, and T4: Soil application of 2 kg Zn ha−1 at final land preparation + foliar application of a 0.2% Zn solution (ZnSO4 ⋅ 7H2O) at both tillering and booting stages. All treatments were arranged in a split-plot design and repeated three times. All additional fertilizers, including N, P, K, S, and B, were administered to all plots at a rate of N120P30K50S12B1.5 kg ha−1 during final land preparation (immediately before sowing of wheat seeds).
. Crop and soil management
Grain yield and Zn concentrations were investigated for seven different wheat (Triticum aestivum L.) genotypes. The wheat varieties were Binagom-1, BARI Gom 25, BARI Gom 26, BARI Gom 27, BARI Gom 28, BARI Gom 29, and BARI Gom 30. Wheat was planted on November 16, 2019 and harvested on March 12, 2020. Threshed, washed, and processed plant samples for chemical analysis were the mature harvested crops.
. Chemical analysis
. Soil chemical properties
Following the protocol, soil samples (0–15 cm) from the experimentation location were collected, air-dried, crushed, and sieved using a 2 mm sieve. Following accepted procedures, measurements of the soil texture, pH, organic matter, total nitrogen, exchangeable potassium, accessible phosphorus, sulfur, and Zn were made.
. Estimation of N, Zn, and grain protein (%)
Grain samples from each plot were collected for analysis of N and Zn concentrations in the grain. The collected samples were dried in an oven at 65 °C for roughly 48 hours and a uniform powder that could pass through a 20-mesh sieve was produced by a grinder. The processed samples were placed into desiccators for additional examination to determine the N and Zn content. The total N content in the soil was determined with the micro-Kjeldahl method (Bremner & Mulvaney, 1982). The Zn content in the soil was extracted with a 0.005M DTPA solution (pH 7.3) and the concentrations of Zn in the extract were measured directly by atomic absorption spectrophotometer at a 214 ηm wavelength (Lindsay & Norvell, 1978).
. Estimation of Zn-use efficiency (%)
The Zn-use efficiency (ZnUE) (%) was calculated according to the formula described by Saha et al. (2015) and Zulfiqar et al. (2020):
as Zn uptake in the Zn treated plot subtracted from the control plot per unit amount of the Zn applied.
. Statistical analysis
According to the fundamental recommendations proposed by Gomez and Gomez (1984), the statistical analysis of the numerous parameters and the data from the soil and plant studies were carried out using a computer-based application (Statistics 10). The analysis of variance (ANOVA) of the significant effects of treatments (DMRT) was determined using Duncan’s Multiple Range Test, which was used to investigate the varieties and their interaction at the 5% significance level.
. Results
. Grain Zn concentrations are influenced by foliar and soil Zn levels
The combination of treatments and differences amongst the studied wheat varieties were noted. The various Zn application techniques showed substantial differences in the grain Zn content, protein, total grain yield, and straw yield. The treatment T1 (control plots) cultivars had a wide range of Zn concentrations in their grains, ranging from 23.9 to 32.2 µg g−1. The highest Zn concentration was found in BARI Gom 30 (32.2 µg g−1), while variety BARI Gom 25 had the lowest Zn value (23.9 µg g−1). The mean grain Zn content was recorded at 28.2 µg g−1 among the 7 varieties (Table 2).
Table 2
Effect of different methods of Zn application on grain Zn concentration and protein (%) in different varieties of wheat.
[i] T1: Control (without Zn); T2: Soil application of 4 kg Zn ha−1 at final land preparation; T3: Foliar application of a 0.5% Zn solution (ZnSO4×7H2O) at tillering and booting stages, and T4: Soil application of 2 kg Zn ha−1 at final land preparation + foliar application of a 0.2% Zn solution (ZnSO4×7H2O) at tillering and booting stages. CV: Coefficient of variation and NS: Non-significant.
Due to the Zn fertilization and various application techniques, the Zn concentrations in the varieties differed. The foliar Zn application outperformed the soil application, where the Zn concentration increased on average more in the wheat grains (3.98 µg g−1). In contrast, the soil application of Zn increased the grain Zn content in all varieties (Table 2). The soil + foliar application strategy at the tillering and booting stages induced the highest response (33.7 to 37.60 µg g−1), with an average of 36.06 µg g−1. Another significant difference between treatment T4 and the control is also highly noteworthy, at 8.7 µg g−1.
. Soil and foliar Zn influence the protein content (%)
Figure 1 presents the protein content in several cultivars. The N concentration varied greatly depending on the types and benefited from the Zn fertilization. Since grain protein% was computed as a multiple of 5.85 over grain N%, the effects of varieties and Zn fertilization had an equal impact on grain protein%. The grain protein content in wheat determined in this experiment ranged from 8.23 to 8.73% when no Zn fertilizer was utilized, with the mean value of 8.52% (control) (Figure 1 and Table 2).
Figure 1
Effect of various Zn treatment techniques on grain protein content (%) in the different wheat varieties. T1: control (without Zn); T2: Soil application of 4 kg Zn ha−1 at final land preparation; T3: Foliar application of a 0.5% Zn solution (ZnSO4×7H2O) at tillering and booting stages, and T4: Soil application of 2 kg Zn ha−1 at final land preparation + foliar application of a 0.2% Zn solution (ZnSO4×7H2O) at tillering and booting stages.
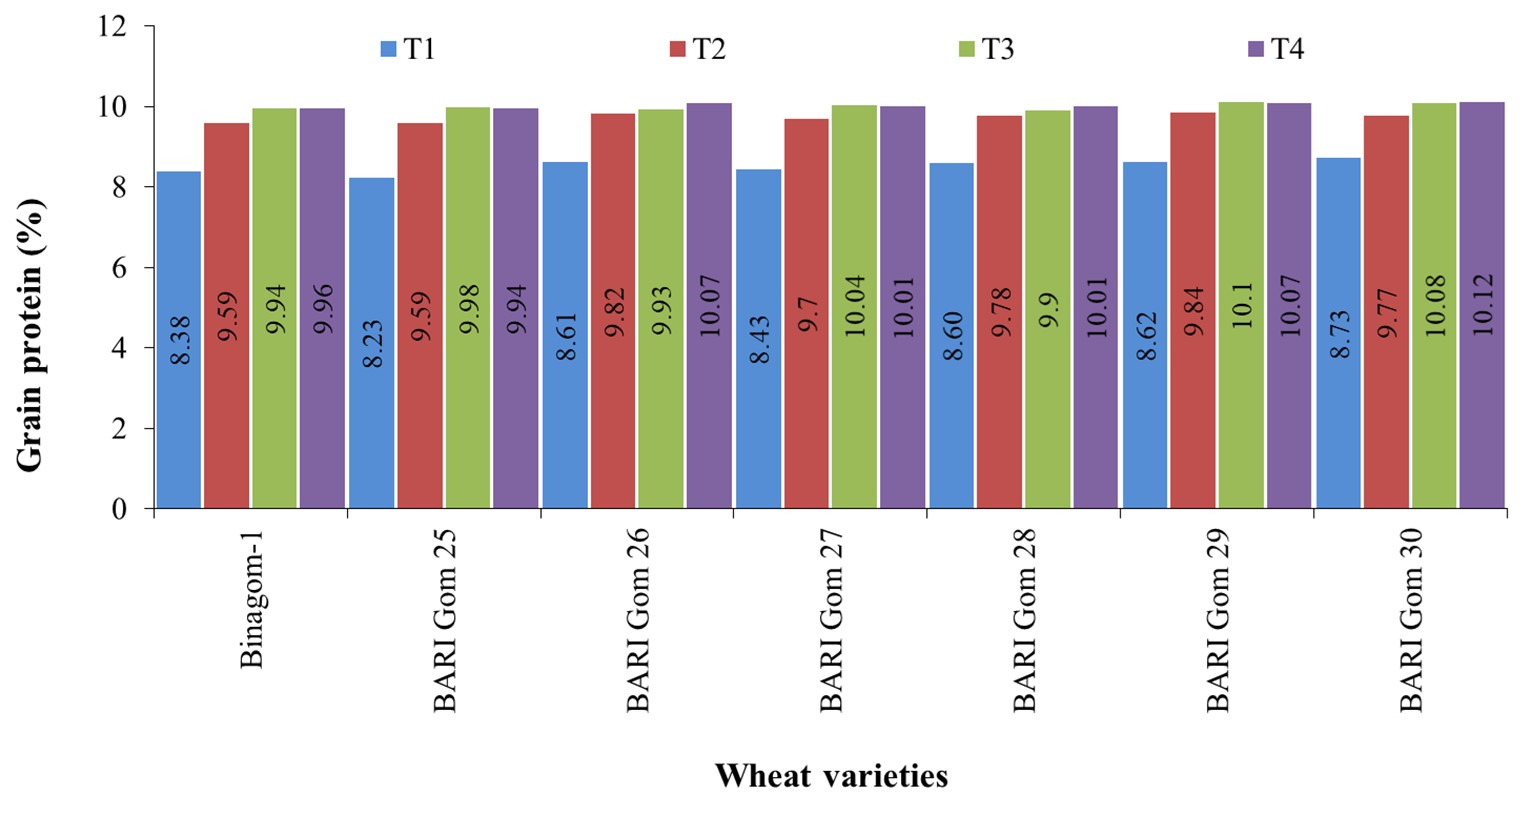
The Zn-fertilized wheat cultivars had significantly higher grain protein concentrations. The soil Zn fertilization at final land preparation + foliar application at both tillering and booting stages produced the highest mean amount of protein, whilst the foliar treatment approach came second. The average protein content in the grains of cultivars fertilized using the various Zn addition techniques varied by 1.21, 1.47, and 1.51, respectively. The average increase in protein over the control for the different administration techniques was 14.2, 17.4, and 17.7%, respectively. This finding suggests that Zn influences protein synthesis, and plants absorb Zn and N appropriately.
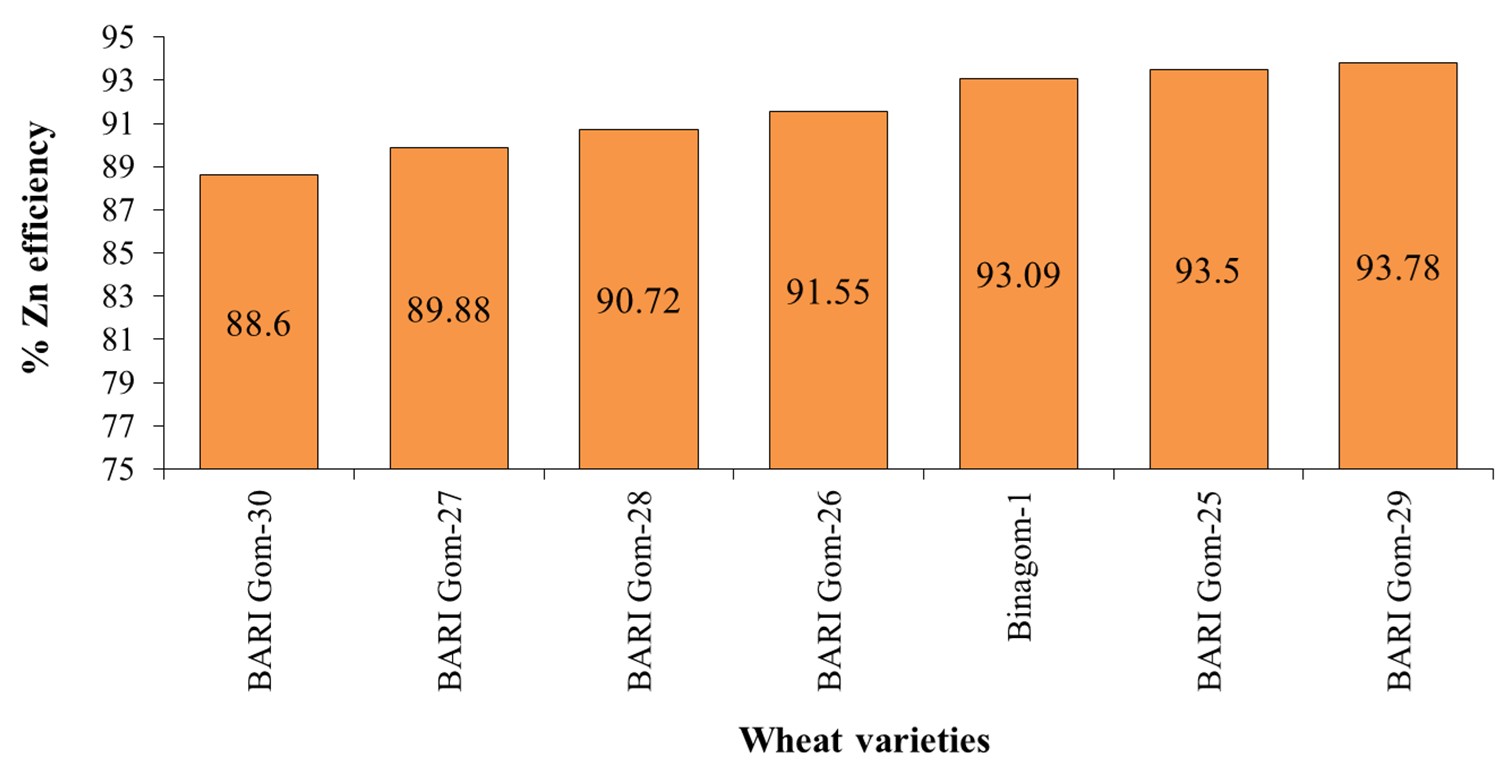
. Zn-efficiency (%) is influenced by soil and foliar application of Zn
Not every genotype responded to the Zn fertilization in the same way. Two of the seven varieties were found to be moderately Zn efficient (80.1 to 90% Zn-use efficiency) based on the percentage of Zn-use efficiency [(Control yield/Zn treatment) × 100], and five other varieties were found to be Zn efficient (>90.0% Zn-use efficiency), indicating that those varieties are least responsive to applied Zn even when grown in Zn deficient soil. Therefore, the most Zn-efficient cultivars seem to be BARI Gom 28, BARI Gom 26, Binagom-1, BARI Gom 25, and BARI Gom 29 (Figure 2).
. Grain and straw yields in wheat varieties are affected by Zn application
The wheat grain yield varied depending on the Zn fertilization type and variety. Due to the genetic makeup of the cultivars, the grain production also changed (Figure 3 and Table S1). The grain yield in the control (T1) treatment ranged from 3.49 to 3.74 t ha−1, with a mean result of 3.59 t ha−1. BARI Gom 26 had the maximum grain yield (3.74 t ha−1), while BARI Gom 25 produced the minimum (3.49 t ha−1).
Figure 3
Effect of various Zn treatment techniques on the grain yield in the different wheat varieties (t ha−1). T1: control (without Zn); T2: Soil application of 4 kg Zn ha−1 at final land preparation; T3: Foliar application of a 0.5% Zn solution (ZnSO4×7H2O) at tillering and booting stages, and T4: Soil application of 2 kg Zn ha−1 at final land preparation + foliar application of a 0.2% Zn solution (ZnSO4×7H2O) at tillering and booting stages.
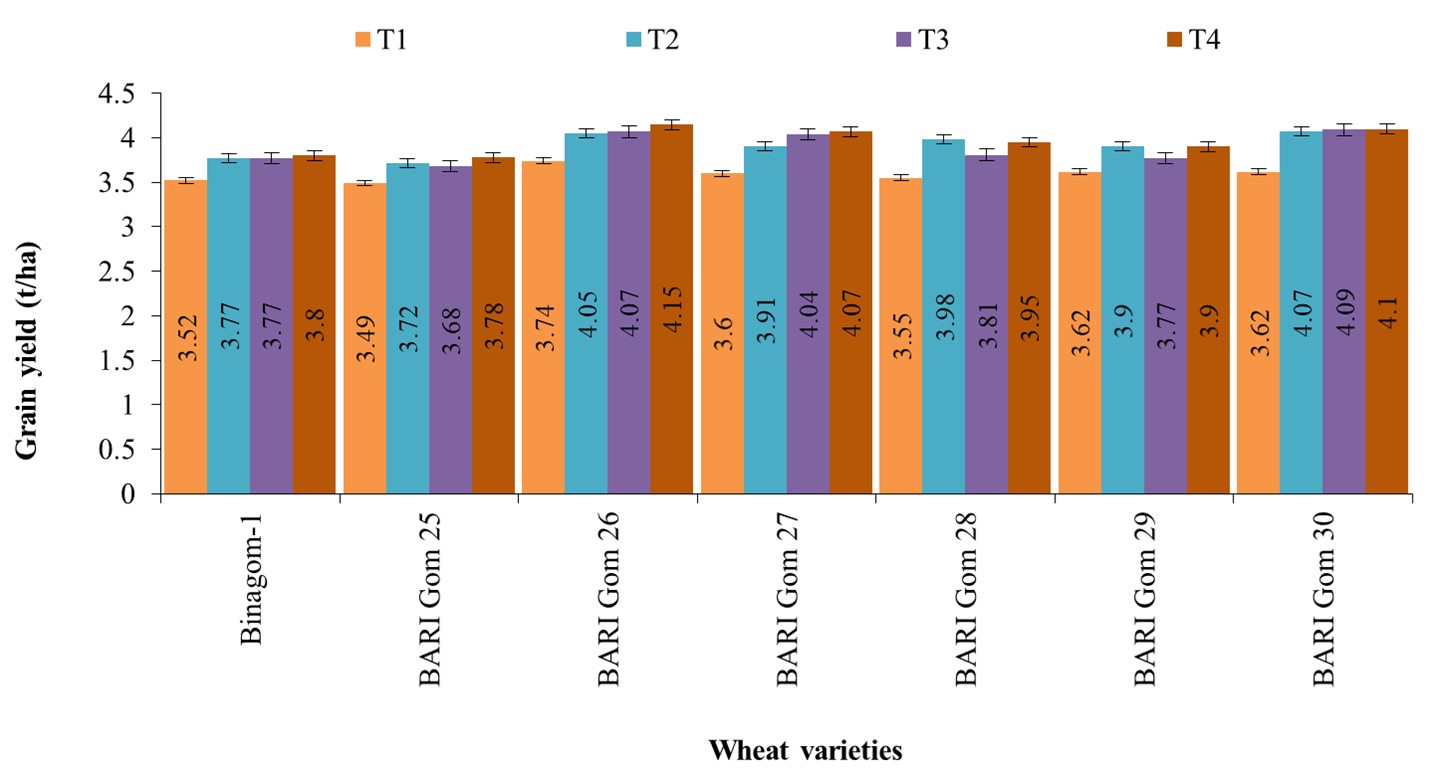
The yield of grains increased with the addition of Zn, and there were noticeable differences between the methods used to add Zn. In the Zn-treated plot, the soil application at final land preparation + foliar application at tillering and booting stages showed the greatest change, and the other approaches, i.e. the soil and simple foliar application, also had a substantial impact on the cultivars. The grain yield in the Zn-treated genotypes ranged from 3.78 to 4.15 t ha−1 (both in the soil and foliar treatments) (Figure 3 and Table S1). BARI Gom 26 had the maximum grain yield (4.15 t ha−1), whereas BARI Gom 25 produced the minimum (3.78 t ha−1).
In the control (T1) treatment, the straw yield ranged from 4.32 to 4.71 t ha−1, with an average of 3.59 t ha−1 (Figure 4 and Table S1). The maximum yield of straw (4.71 t ha−1) was generated by the BARI Gom 29 field, and the lowest yield (4.32 t ha−1) was produced by the Binagom-1 field. The yield of straw increased when Zn was added, and there were also noticeable differences between the methods used to add Zn.
Figure 4
Effect of various Zn treatment techniques on the straw yield in the different wheat varieties (t ha−1). T1: control (without Zn); T2: Soil application of 4 kg Zn ha−1 at final land preparation; T3: Foliar application of a 0.5% Zn solution (ZnSO4×7H2O) at tillering and booting stages, and T4: Soil application of 2 kg Zn ha−1 at final land preparation + foliar application of a 0.2% Zn solution (ZnSO4×7H2O) at tillering and booting stages.
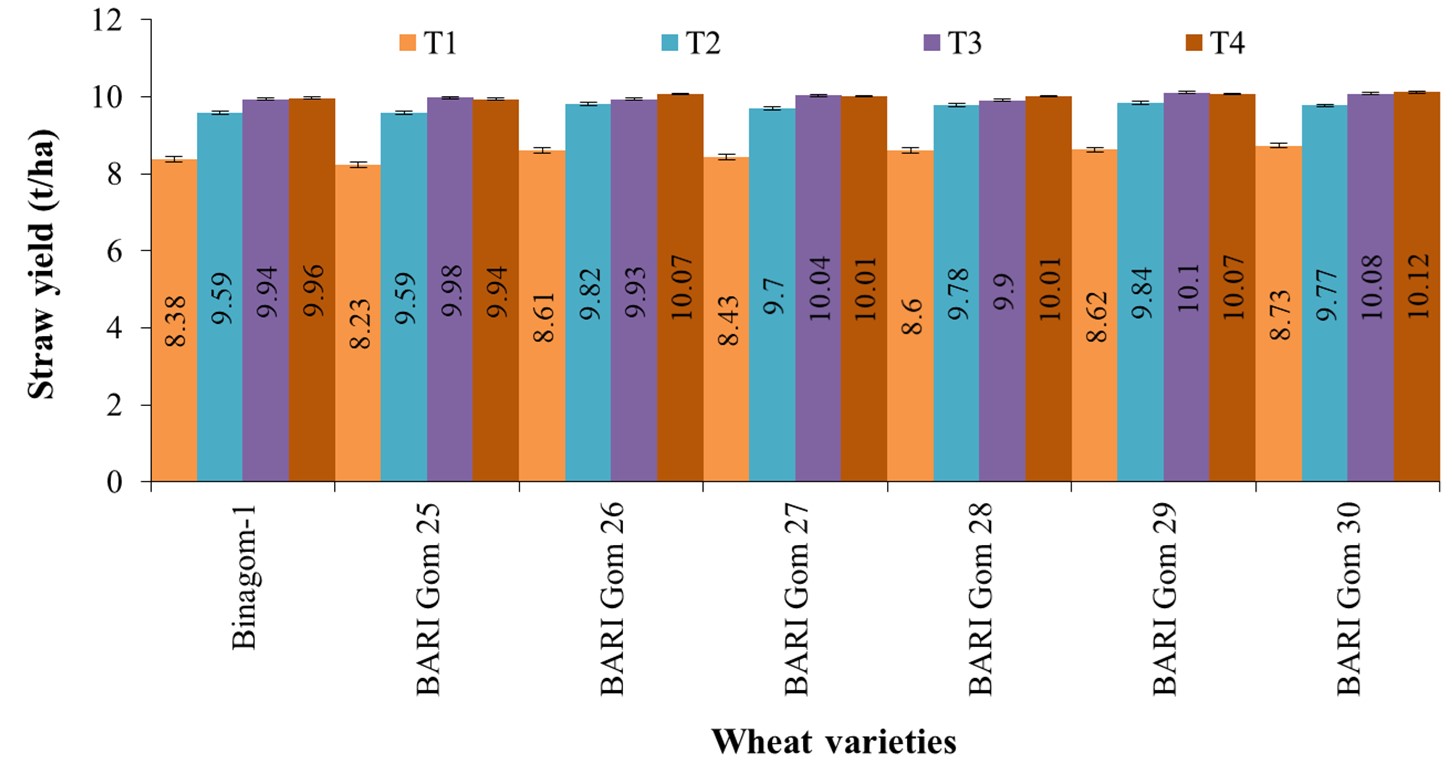
In the Zn-treated plot, the soil + foliar application methods produced a tremendous change. At the same time, the other approaches, i.e. the soil and simple foliar application, also substantially influenced the cultivars. The highest grain yield (5.05 t ha−1) was obtained from BARI Gom 29, and the lowest yield (4.40 t ha−1) from Binagom-1. The straw yields ranged from 4.65 to 5.05 t ha−1 in the soil + foliar spray. The maximum grain yield (5.05 t ha−1) was produced by BARI Gom 29, and the range of straw yields (from 4.65 to 5.05 t ha−1) was recorded in the soil application at + foliar spray, whereas the minimum yield (4.40 t ha−1) was produced by Binagom-1 (Figure 4 and Table S1).
. Discussion
Zinc (Zn) is a crucial micronutrient for both humans and plants (Khan et al., 2023). It is interconnected to the numerous physicochemical progressions in both plants and the human body (Dhaliwal et al., 2023). Many Zn-dependent enzymes are required to metabolize carbohydrates in plant leaves (Xing et al., 2016). Zn regulates the secondary activity of auxins, which manage plant development and growth (Castillo-González et al., 2018). Zn also helps plants be immune or resistant to disease and insect activities (Cabot et al., 2019). Therefore, if there is not enough Zn available, metabolic functions cannot be completed, resulting in physiological disturbances in plants. Therefore, if specific enzymes are lacking from plant tissues, crop growth and development will stop.
In the case of the human body, it is necessary for almost 100 enzymes to carry out vital chemical reactions (Dhaliwal et al., 2022, 2023). Zinc is a major factor in the formation of DNA, development of cells, biosynthesis of proteins, restoration of damaged tissue, and support for the human immune system (Chasapis et al., 2012, 2020). It has been estimated that more than 40% of the World population is unswervingly affected by deficiency of Zn (Welch, 1993), and people of Bangladesh are one of the topmost among affected countries due to the huge consumption of cereal-based food (Cakmak, 2008; Stein, 2010). For example, cereal-based food is responsible for supplementation of 60% Zn for the human body for cereal-consuming people as in Bangladesh (Fageria et al., 2002; Islam et al., 2013).
To increase the micronutrient concentration in the grains of food crops, biofortification has already been established as one of the best approaches across the globe, and it is crucial to improve the micronutrient concentration in food crops. Agronomic biofortification, however, is a quick, simple, economically viable, and practically deployable option (Zaman et al., 2018). The Zn content in wheat grain greatly increased as a result of Zn fertilization, rising from 7 to 11 µ g−1 Zn across cultivars observed by Erdal et al. (2002).
In the current study, seven wheat varieties were tested through soil and foliar application of different levels of Zn (for example, soil application of 4 kg Zn ha−1 at final land preparation; foliar application of a 0.5% Zn solution (ZnSO4 ⋅ 7H2O) at both tillering and booting stages, and soil application of 2 kg Zn ha−1 at final land preparation + foliar application of a 0.2% Zn solution (ZnSO4 ⋅ 7H2O) at both tillering and booting stages) to assess their ability for Zn enrichment in the grain. The results of the study showed that the Zn application techniques influenced the Zn concentration in the grains significantly, ranging from 23.9 to 32.2 µg g−1 across the varieties, with an average of 28.2 µg g−1 in the control (without Zn). Among these various application techniques, the soil + foliar application induced the highest response of the Zn concentration in the grains, ranging from 33.7–37.60 µg g−1. The results of the study were also confirmed by Cakmak (2010), who discovered that Zn fertilization raised the Zn concentration in wheat grain from 11.7 to (control) to 26.9 µ g−1. Similarly, Rashid (2012) tested eight wheat genotypes for Zn enrichment in the grains. Based on its capacity and stability for producing wheat grains with high Zn concentrations, they determined that BARI Gom 26 was the most promising variety (Rashid, 2012). Oury et al. (2006) noted that high-producing varieties had the ability to increase Zn concentrations between 15 and 35 mg kg−1 when additional Zn was applied in soils. They also found that the overall increase in the Zn concentration in grains was 14.6 µ g−1, with the average increase in the Zn concentration in wheat grains being significant at 33.9%. According to one fertilizer approach, this helps increase plant Zn concentrations is Zn enrichment of regularly used compound fertilizers.
Similar to the Zn concentration, the Zn fertilization boosted wheat production by 6.6 to 16.34%, with a mean of 11%, but the grain yield was variety specific; this was due to the genetic composition of a specific variety. The results of our present study related to wheat grain were also confirmed by Yilmaz et al. (1997) and Shivay et al. (2008), who found that Zn fertilization boosted grain production and Zn concentrations in grains of various wheat genotypes as a result of the genetic make-up of a specific genotype. However, soils with low Zn levels hampered the improvement of grain yield in wheat (Cakmak, 2010). Duxbury et al. (2005) discovered greater Zn, Cu, and Mo levels in grains of rice and wheat as well as grain yield as a result of their additional application.
Similar to Zn and grain yield, the Zn treatments had a favorable impact on the protein concentration in wheat grain and demonstrated a synergistic interaction between the Zn application techniques and the wheat varieties. The average protein content (%) in the grains of all wheat varieties varied by 1.21, 1.47, and 1.51%, respectively, as a result of the use of the different Zn application methods. The findings unequivocally show that Zn aids in protein synthesis. Gliadin and glutenin are the two primary protein components of gluten that concentrate in the later stages of grain filling, and Zn activates the glutamic dehydrogenase enzyme, increasing RNA and DNA synthesis. The current study implies that the application of the N fertilizer lowered the Zn concentration in the grain and vice versa. The results of the present study were similar to the findings obtained by Keram et al. (2012), who reported that Zn application in soil significantly improved the protein content in wheat grains, particularly wet gluten. Protein contents in wheat grains were also significantly increased when Zn was applied in soil, as reported by Hafeez et al. (2021). However, another study conducted by Ramzan et al. (2020) found that Zn and Fe significantly decreased the protein content in spring wheat. Mugenzi et al. (2018) reported that Fe and Zn application, either sole or combined, showed a nonsignificant effect on protein content.
In the current investigation, the grain yield and grain Zn enrichment in wheat crops may have been affected differently by the various Zn treatment methods. On the one hand, the average growth of the wheat crop was not significantly limited to Zn in the experimental soil, even in the control treatment (i.e., without Zn). Nonetheless, the applied Zn treatments, whether foliar or root application, or the combination of these were not very damaging. As a result, there was no obvious difference between the no-Zn treatments and Zn application in terms of the growth and yield characteristics and the yield of the experimental wheat crops. However, in other fields, Zn addition minimized yield loss, and wheat crops may exhibit considerable growth and grain output reduced in shortage situations (Ma et al., 2017; Sadeghi et al., 2021).
The foliar application or the combination of soil and foliar application resulted in a significant boost in the Zn content in the grain. These findings are corroborated by Yilmaz et al. (1997) and Cakmak et al. (2010a,b). By adjusting the time and Zn concentration during foliar spray, the grain Zn concentration may be raised (Cakmak et al., 2010a; Zhang et al., 2010). According to Zhang et al. (2010), aerial (foliar) spraying of Zn during the grain development stage is helpful to enhance seed Zn content because the leaf epidermis absorbs Zn, which is then transferred to other plant components by veins and vein-lets or vascular networks (Haslett et al., 2001). Lu et al. (2012), and Lan et al. (2021) also reported a significant growth in the Zn concentration in wheat grain using agronomic techniques of Zn utilization or Zn fertilization treatments. Lone et al. (2017) showed an increased grain Zn concentration due to rising soil N availability, which implies a correct combination of N and Zn treatments. Agronomic methods and genetic biofortification increase the potential for developing novel cultivars that accumulate minerals in the edible part more successfully (Mingotte et al., 2018). Zn can be added to crops through agronomic biofortification, which can be valuable and affordable worldwide (Cakmak & Kutman, 2018).
. Conclusions
The results and discussion of the present study revealed that Zn is crucial for both the human organism and plants since it is linked to various physicochemical processes in both plants and the human body. Therefore, it is crucial to increase the micronutrient concentration in food crops, and biofortification has already been established as one of the best approaches across the globe to increase the Zn concentration in plant foods. The current study assessed the Zn enrichment in the grain of elite wheat varieties through soil and foliar applications of Zn. The results of the study showed that soil application of 5 mg of Zn kg−1 at final land preparation and the foliar application of a 0.5% Zn solution (ZnSO4 ⋅ 7H2O) at both tillering and booting stages may be the best option to increase the Zn in the grains of wheat varieties. Among these varieties, BARI Gom 25, 27, 28, and 29 had potential to increase the Zn level from 29.6 to 37.60 µg g−1 through both soil and foliar application of Zn. The average protein content (%) in the grains of all wheat varieties varied by 1.21, 1.47, and 1.51%, respectively, as a result of the use of the different Zn application methods (soil + foliar application). Considering the Zn-use efficiency (%), BARI Gom 28 was found the most Zn-efficient wheat variety followed by BARI Gom 26, Binagom-1, BARI Gom 25, and BARI Gom 29. In the case of grain yield, BARI Gom 26 (4.15 t ha−1) performed the best in the soil + foliar combination Zn. Therefore, this combination may be recommended for improvement of the grain yield, Zn concentration, and protein content.
