Abbreviations
A – net assimilation rate (µmol CO2 m−2 s−1)
ca – ambient CO2 concentration (µmol mol−1)
ci – intercellular CO2 concentration (µmol CO2 mol−1)
Cl – relative chlorophyll content unit (SPAD)
E – leaf transpiration rate (mmol H2O m−2 s−1)
gs – stomatal conductance (mol H2O m−2 s−1)
LA – area of 1 leaf (cm2)
LAI – leaf area index
LMA – leaf mass per area (g m−2)
ls – stomatal limitation value
Narea – leaf nitrogen content per unit area of leaves (g N m−2)
Parea – leaf phosphorus content per unit area of leaves (g P m−2)
T – leaf temperature (°C)
WUE – instantaneous water use efficiency (µmol CO2 mol H2O−1)
WUE1 – intrinsic water use efficiency (µmol CO2 mol H2O−1)
Y – grain yield of spring wheat (t ha−1)
. Introduction
Globally, wheat ranks first in terms of cultivated area (FAOSTAT, 2023). This is due to the wide use of the grain (human food, animal feed), its level of yield, and its adaptation to different habitat conditions (Memon et al., 2022).
Products derived from wheat are the main source of food for most people in the world. They are rich in carbohydrates, protein, vitamins, and minerals (Kamboj et al., 2018; Khan et al., 2023; Kozera et al., 2023).
In many countries of the world, it is quite common to sow wheat with undersown leguminous plants, including clovers, in agricultural practice (Lauringson et al., 2013; Liebman et al., 2012). For most of the period, the undersown plants grow together with the crop (mainly cereal) and, after the harvest, they remain on the field. In the absence of competitors, they grow vigorously, and their green matter is introduced in late autumn into the soil or harvested for animal feed. The advantages of undersown plants are known and well-documented in the scientific literature. They contribute inter alia to the sustainable biological life in the soil and enrich the soil with humus and nutrients (Gaudin et al., 2013; Wanic et al., 2019). Another great advantage of leguminous plants is that, by fixing atmospheric nitrogen, they increase this nutrient content in both the biomass and the soil and the yield of the main yield crops (Bergkvist, 2003). Thanks to these qualities, undersown plants have become an indispensable component in sustainable farming systems (Wanic et al., 2019). The red clover exhibits high suitability for cultivation with cereals. It is capable of accumulating biomass at low light levels, which is one of its major advantages (Özyazici et al., 2021). Due to its high tolerance to shading, combined with the slow growth in the first year of cultivation, it is suitable for cultivation in a dense wheat canopy (Liebman et al., 2001). A disadvantage of the clover (as an undersown plant) is its low competitive ability in relation to cereals (Menéndez et al., 2017). It can be reduced e.g. by decreasing the density of both plant species (Youngerman et al., 2018).
The crucial process of primary plant metabolism is photosynthesis, which produces organic biomass. The photosynthetic capacity of plants depends on plant characteristics, habitat conditions, and the agricultural technology used (Bhusal et al., 2021; Vemmos et al., 2013; Vitale et al., 2011).
The course of photosynthesis can also be affected by the competition between plants (Jastrzębska et al., 2015). Species growing together at a total density twice as high as that in the sole crop variant are under stress due to the shortage of growth factors (including water, nutrients, and space) (Kostrzewska et al., 2020; Menéndez et al., 2017). In these conditions, they limit the opening of stomata, which translates into reduced transpiration and photosynthetic rates due to the limited CO2 assimilation rate (Jackson et al., 2016; Sourour et al., 2017). The adverse effect of the joint cultivation of spring barley with undersown red clover, spring barley with undersown Italian ryegrass, and spring wheat with undersown Persian clover on the photosynthetic process was demonstrated in their study by Jastrzębska et al. (2015) and Wanic et al. (2016).
In unfavourable conditions, the plant closes its stomata. On the one hand, this protects the plant from water loss; on the other hand, it reduces the uptake of CO2 from the atmosphere, which reduces the net assimilation rate (Bhusal et al., 2021; Vemmos et al., 2013). This generally leads to a reduction in the yield, although opinions on this issue are divided (Cui et al., 2015; Janusauskaite et al., 2017).
The literature provides no comprehensive data on how the cultivation of spring wheat with undersown red clover will affect carbon dioxide uptake and transpiration in the leaves of this cereal.
This paper proposes a hypothesis that the cultivation of spring wheat with undersown red clover will have an adverse effect on the foliage, leaf gas exchange, and the yielding of this cereal, and the negative results of this impact will be pronounced less clearly at a lower plant density. This study is a follow-up to a study on the selection of partner plants to be undersown with cereals and their effect on the physiological processes of plants (Jastrzębska et al., 2015; Wanic et al., 2016). Understanding the changes in the physiology of the spring wheat cultivated with the red clover will optimize the sowing density for both species to be controlled in such a manner so as to ensure high yielding levels.
The aim of this study was to investigate (i) whether growing the spring wheat with undersown red clover will have an effect on the photosynthetic process in this cereal, (ii) whether the photosynthesis will be modified by the plant density (iii), and whether the joint cultivation will change the foliage characteristics and the yield of the spring wheat.
. Material and methods
. Site, soil, and climate characteristics
The research was carried out based on a field experiment located in north-eastern Poland in the Agricultural Experiment Station of the University of Warmia in Mazury in Olsztyn (Poland; 53°35′47″ N, 19°51′20″ E) in 2017–2018.
The experiment was located on Luvisol soil (USS Working Group WRB). The topsoil (0–20 cm layer) content: 64.7% of sand, 15.4% of coarse silt, 16.5% of fine silt, and 3.4% of clay. It had slightly acidic pH (6.2), SOC content of 9.0 g kg−1, N content of 0.83 g kg−1, and the content of available forms: P of 68.3 mg kg−1, K of 115.4 mg kg−1, and Mg of 39.6 mg kg−1.
During spring wheat vegetation (from April to August), the mean temperature was +14.5 °C in 2017 and +17.3 °C in 2018 (Table 1). Precipitation during this period was 356.9 mm in 2017 and 305.7 mm in 2018 year. The highest precipitation was recorded in June and July 2017 (60.5% of the total precipitation in the growing season) and in July 2018 (40% of the total amount in this period). The wheat vegetation season was not favourable: in 2017 due to the very high precipitation in July (wheat was then in the ripening stage) and in 2018 due to the low precipitation in April (which hindered wheat sowing and emergence) and the very high precipitation in July (ripening stage).
Table 1
Total monthly precipitation and average monthly temperature for the growing seasons of spring wheat.
| Year | Month | ||||
|---|---|---|---|---|---|
| IV | V | VI | VII | VIII | |
| Air temperature (°C) | |||||
| 2017 | 6.7 | 13.1 | 16.7 | 17.3 | 18.7 |
| 2018 | 11.9 | 16.5 | 17.9 | 20.0 | 20.4 |
| Precipitation (mm) | |||||
| 2017 | 52.1 | 34.0 | 109.9 | 106.1 | 54.8 |
| 2018 | 28.1 | 41.0 | 64.7 | 140.7 | 31.2 |
During the period of measuring leaf gas exchange and leaf characteristics (BBCH 58 stage), the daily temperature was +18.2 °C in 2017 (16th June) and +17.6 °C in 2018 (20th June). There was no precipitation on these days (Table 1).
. Experimental design
The spring wheat (cultivar ‘Kandela’) and the red clover (cultivar ‘Jubilatka’) were cultivated as a sole crop and in a mixture in two plant density variants: a higher density variant and a lower density variant (reduced by 20%).
Experimental factors:
In the higher density objects, 450 wheat seeds and 320 clover seeds were sown (for both sowing methods), while 370 wheat seeds and 260 clover seeds were sown per 1 m2 in the lower-density plots.
The experiment was conducted in four replications each year. The experimental setup comprised 24 plots (wheat in the higher plant density object: 4 plots in the sole crop and 4 plots in a mixture with clover; wheat in the lower plant density object: 4 plots in the sole crop, and 4 plots in a mixture with clover; clover in the sole crop in the higher plant density object - 4 plots, and clover in the sole crop in the lower plant density object - 4 plots). The area of each plot was 16 m2.
Spring wheat and red clover in the sole crop and the spring wheat/red clover mixture were sown on 27 March in 2017 and on 9 April in 2018. Spring wheat seeds were sown to a depth of 3 cm and red clover seeds to a depth of 1 cm. The sowing was done with a sowing machine. In the mixture, the spring wheat was sown first, followed by the red clover.
Both in the single-species and in the mixed cultivation, the same P and K doses were applied. The entire P and K dose was applied once, before sowing, in autumn. The dose (P – superphosphate, and K – potassium salt) was as follows: P – 35.2 kg ha−1 and K – 91.3 kg ha−1. The N dose (ammonium nitrate NH4NO3, 34%) varied depending on the sowing method and was as follows: for spring wheat sown as a sole crop – 150 kg ha−1, for the mixture of spring wheat and red clover – 120 kg ha−1, and for the red clover sown as a sole crop – 40 kg ha−1. In the sole crop and in the mixture, the N dose was divided into three parts and applied 7 days before sowing (40%), at the stem elongation stage - BBCH 31 (30%), and at the inflorescence emergence stage - BBCH 51 (30%). In the clover, the entire dose of N was applied once, before sowing. In the experiment, no plant protection products were used to reduce the occurrence of weeds, diseases, and pests.
. Foliage features
The measurements of the surface area (LA) of the spring wheat leaves were performed at the BBCH 58 (inflorescence emergence) stage using a leaf area meter (CI – 202 Portable Laser Leaf Area Meter). The measurements were taken in each plot on all leaves deposited on 4 stems. All the leaves were counted on the same stems. The leaf area index (LAI) was calculated by dividing the area of all leaves of one stem by the area occupied by it. On the same day, the relative chlorophyll content of the leaves was determined using a SPAD 502 chlorophyll meter (Minolta). The measurements were taken on four wheat stems, with the top three fully developed, undamaged leaves. At BBCH 58, twenty stems of wheat were removed from each plot. The above-ground part was separated from the roots. All leaves were removed from the wheat plants. The surface area of all leaves (LA) was determined using a leaf area meter (CI – 202 Portable Laser Leaf Area Meter). Then the leaves were dried in a dryer at a temperature of 70 °C (until constant weight was achieved) and weighed. Leaf mass per area (LMA) was calculated by dividing the weight of the leaves by their area. At this stage, the total N content in the leaves of the wheat was determined with the Kjeldahl method, while the inorganic P content was determined colorimetrically with the vanadium-molybdenum method. Narea and Parea were calculated by dividing the N and P contents in the leaves by their area.
. Leaf gas exchange analysis
The measurements of leaf gas exchange were carried out at the BBCH 58 (inflorescence emergence) stage. They were taken on the flag leaf of wheat. Ten wheat stems from each plot were randomly selected for measurements. On each of these stems, four measurements were taken on fully developed, undamaged flag leaves. The measurements were carried out on cloudless days before noon (between 10:00 and 12:00). A compact photosynthesis system was used to measure leaf gas exchange (LCi/N, ADC Bioscientific Ltd., Hoddesdon, UK). The ambient CO2 concentration ranged from 396 to 406 × 10−6 µmol mol−1, the vapour pressure was 13.2–17.5 kPa, and the chamber temperature was in the range from 25.2 °C to 35.1 °C. The tests involved the determination of the atmospheric CO2 concentration (ca), stomatal conductance (gs), intercellular CO2 concentration (ci), net assimilation rate (A), and transpiration rate (E). Leaf temperature (T) was also measured with this apparatus. Based on the measurements, the following indicators were calculated: the instantaneous water use efficiency (WUE) was calculated as A/E, the intrinsic water use efficiency (WUE1) was determined as A/gs, and the stomatal limitation value (ls) was calculated as 1-ci/ca.
. Yield grain of wheat and above-ground biomass of clover
In the ripening stage (BBCH 89), the yield of wheat was determined from each plot (with 12% water content in the grains). Harvesting was done with a plot harvester on 8 August in 2017 and on 24 July in 2018. On the same day (immediately before wheat harvest), the above-ground mass of red clover and the mixture of spring wheat and red clover were taken from two randomly selected sites of 0.5 m2 in each plot. The wheat shoots were separated from the clover shoots in the mixture. The above-ground mass of the clover was dried in a dryer at a temperature of 70 °C (until constant weight was achieved) and weighed. The wheat grain yield and the above ground mass of clover are presented in t ha−1.
. Statistical analysis
In the assessment of the effect of the sowing method and plant density on the characteristics under study, the ANOVA analysis of variance for factorial designs was applied, while the significance of the differences between these characteristics was assessed using Tukey’s test with p < 0.05. Based on Pearson’s correlation, the strength of the correlation between the studied characteristics was assessed. The analyses were conducted using the Statistica 13.3 program.
In the absence of significant differences between the experiment years (2017, 2018), the tables and figures provide the mean results obtained for these years.
. Results
. Foliage characteristics
In the mixture, the leaf area (LA) of the spring wheat (Figure 1) was significantly smaller than that in the sole crop variant in the object with the density higher by 8.9% (1.1 cm2) and with the density lower by 13.0% (1.7 cm2). The wheat leaves in the field with clover were characterised by a significantly higher leaf area index (LAI) value (23.8–46.3%), a higher leaf mass per area (LMA) value (12.7–22.2%), and a higher temperature T (by 1.3–1.5 °C) than that in the sole crop variant (Table 2). The advantage of the mixed sowing variant over the sole crop variant in LAI was pronounced more clearly in the lower density object. In the mixed sowing variant, the relative chlorophyll content (Cl) and Parea in the wheat leaves were lower than that in the sole crop variant in both plant density objects (Cl by 2–4%, Parea by 6.7–18%). The leaves of wheat cultivated in the mixture were characterised by a significantly smaller Narea (by 20.9%) only in the higher density object. The differences in the LAI, LMA, T, Cl, and Narea between the mixed sowing variant and the sole crop variant in both plant density objects were similar. In the mixture, a greater reduction in Parea was noted in the higher density object than in the lower density object.
Figure 1
Leaf area (LA) of spring wheat (cm2).
Uppercase letters denote the homogeneous group in Tukey’s test HSD (p < 0.05) in the evaluation of the sowing method in the higher density object, lowercase letters denote the homogeneous group in Tukey’s test HSD (p < 0.05) in the evaluation of the sowing method in the lower density object. Black bars indicate the standard error of the mean.
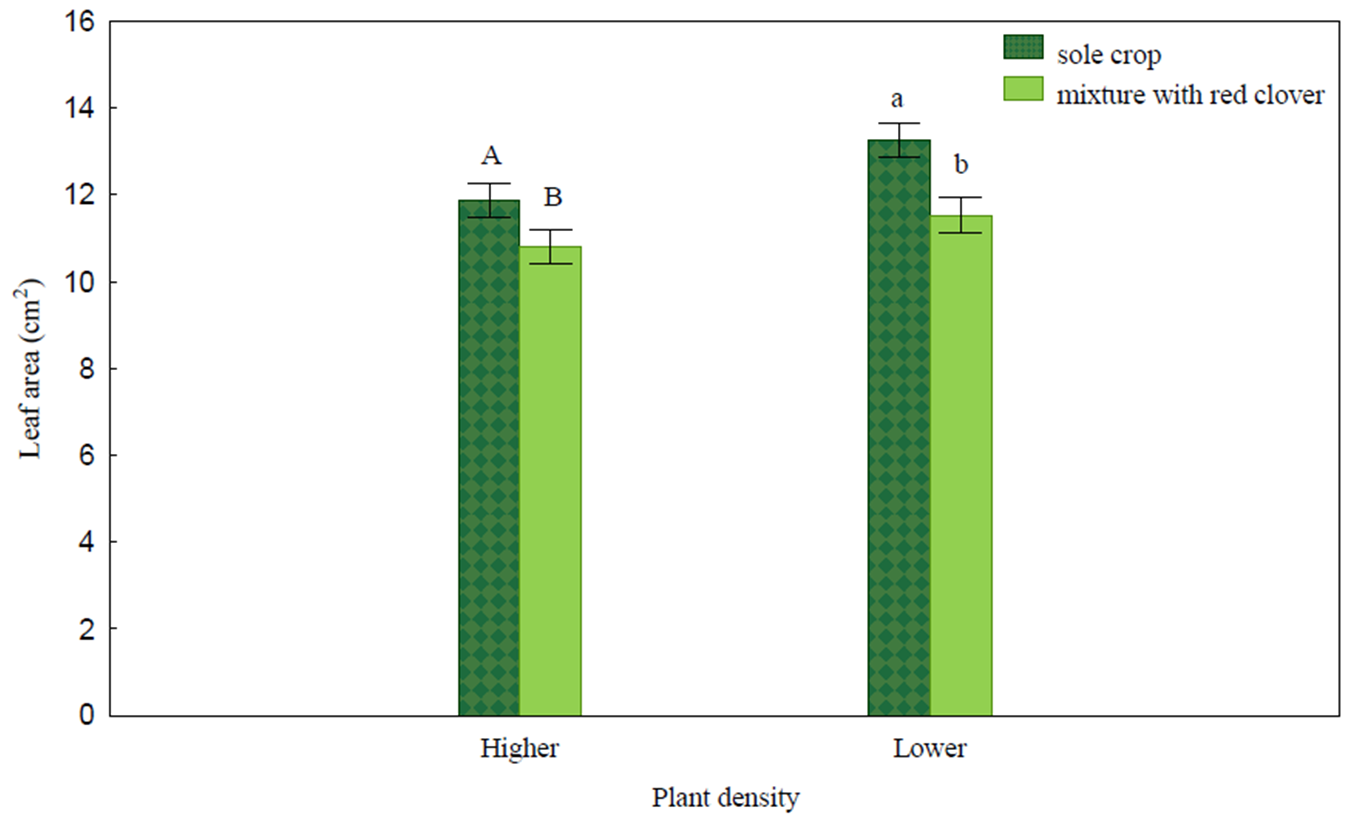
Table 2
Selected features of the foliage of spring wheat.
[i] Abbreviations: LAI – leaf area index, LMA – leaf mass per area, T – leaf temperature, Cl – relative chlorophyll content. Narea – leaf N per area, Parea – leaf P per area.
Mean ± standard deviation, uppercase letters denote homogeneous groups in Tukey’s test HSD (p < 0.05) in the evaluation of the sowing method in the higher density object, lowercase letters denote homogeneous groups in Tukey’s test HSD (p < 0.05) in the evaluation of the sowing method in the lower density object, ns – not significant.
Table 3
Parameters of gas exchange in wheat leaves.
[i] Abbreviations: gs – stomatal conductance, ci – intercellular CO2 concentration, A – net assimilation rate, ls – stomatal limitation value, E – leaf transpiration rate, WUE – instantaneous water use efficiency, WUE1 – intrinsic water use efficiency.
Mean ± standard deviation, uppercase letters denote homogeneous groups in Tukey’s test HSD (p < 0.05) in the evaluation of the sowing method in the higher density object, lowercase letters denote homogeneous groups in Tukey’s test HSD (p < 0.05) in the evaluation of the sowing method in the lower density object, ns – not significant.
. Leaf gas exchange
In the leaves of the spring wheat growth with undersown red clover in both plant density objects (Table 3), a significant reduction was noted in relation to the sole crop variant: stomatal conductance – gs (by 6.3–9.1%), intercellular CO2 concentration – ci (by 5.1–10.4%), and transpiration rate – E (by 25.1–28.3%). On the other hand, an increase was noted in the stomatal limitation value – ls (by 18.2–58.3%) and the instantaneous water use efficiency – WUE (by 21.4–21.9%). Additionally, in the higher density object, a significant reduction in the assimilation rate – A (by 13.0%) and intrinsic water use efficiency – WUE1 (by 6.8%) was noted in the mixture in relation to the sole crop variant. In the lower density object, no significant differences between the sowing methods were demonstrated in the net assimilation rate – A and intrinsic water use efficiency – WUE1. The magnitude of the differences between the sowing methods in gs, ci, and E in both plant density objects was similar. In the mixture, a greater increase in the limitation value – ls was noted in the lower density object than in the higher density object.
. Yield of wheat grains and above-ground biomass of clover
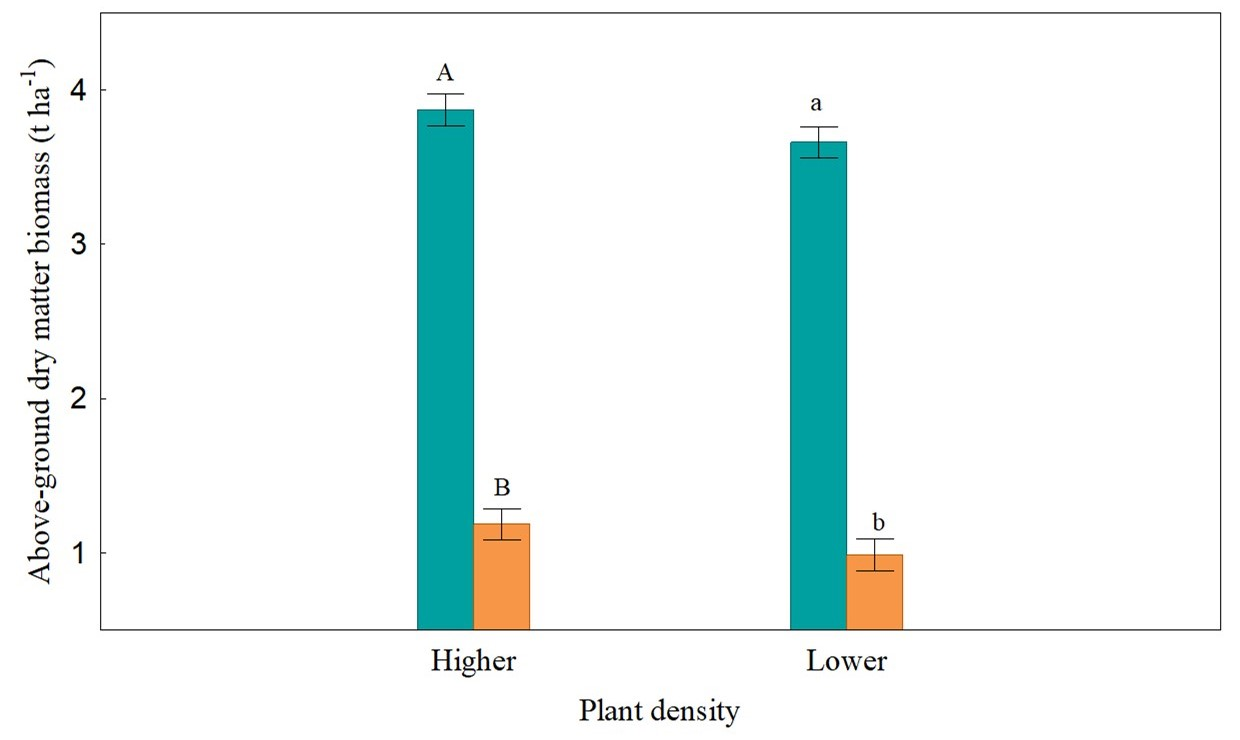
In the mixture, the yield of wheat grains was significantly lower than that in the sole crop variant (Figure 2) by 17.5% in the higher density object and by 12.6% in the lower density object. The clover responded more vigorously to the joint cultivation (Figure 3) by significantly reducing the yield of above-ground dry matter in both density objects (by 69.5–73.2%).
Figure 2
Grain yield (t ha−1) of spring wheat.
Uppercase letters denote the homogeneous group in Tukey’s test HSD (p < 0.05) in the evaluation of the sowing method in the higher density object, lowercase letters denote the homogeneous group in Tukey’s test HSD (p < 0.05) in the evaluation of the sowing method in the lower density object. Black bars indicate the standard error of the mean.
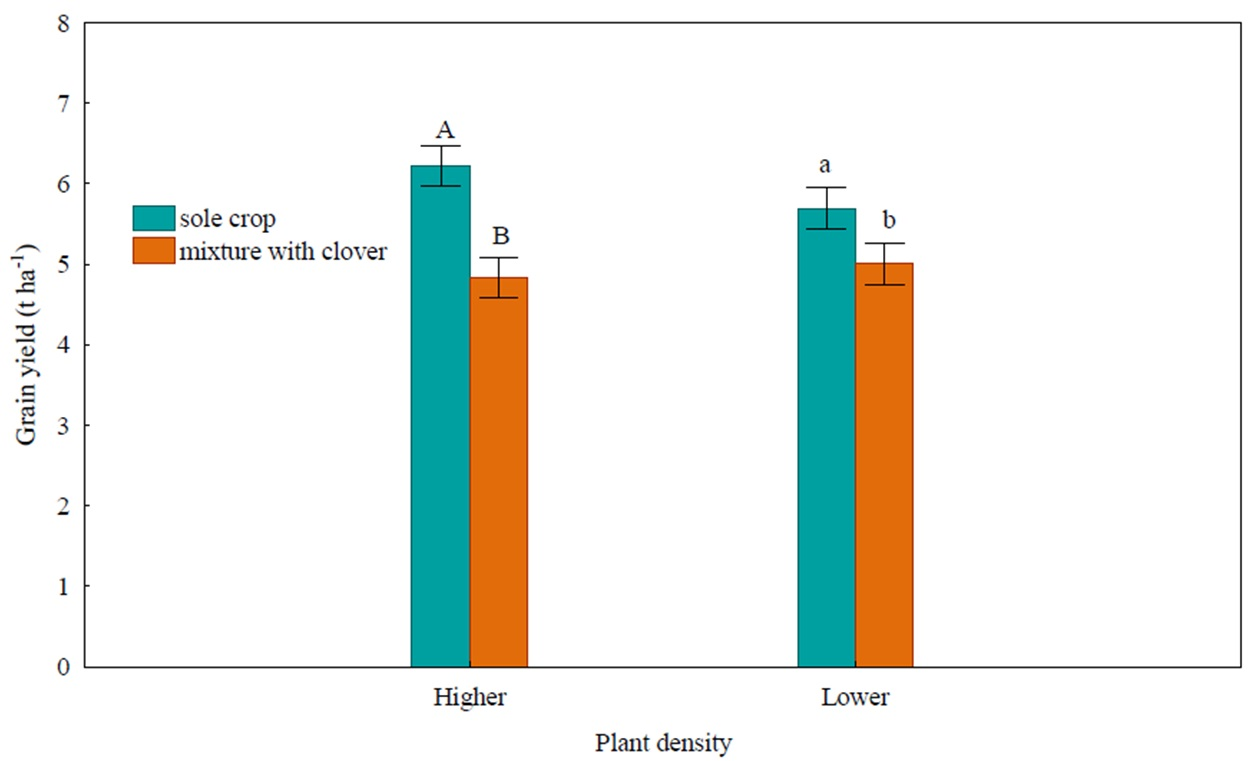
Figure 3
Above-ground dry matter biomass (t ha−1) of red clover.
Uppercase letters denote the homogeneous group in Tukey’s test HSD (p < 0.05) in the evaluation of the sowing method in the higher density object, lowercase letters denote the homogeneous group in Tukey’s test HSD (p < 0.05) in the evaluation of the sowing method in the lower density object. Black bars indicate the standard error of the mean.
. Correlation between assimilation and spring wheat characteristics
In the higher plant density object, parameter A was significantly positively correlated with E, Cl, Narea, Parea, and Y in both sowing variants (Table 4). Additionally, A exhibited a significant positive correlation with LA and LAI in the sole crop variant and with gs and ci in the mixed sowing variant. In this object, a negative correlation between A and T and LMA was demonstrated in the sole crop variant and in the mixture, between A and ls in the sole crop variant, and between A and WUE in the mixed sowing variant. In the lower plant density object, a significant positive correlation between A and gs, E, Cl, and Y was demonstrated for both sowing methods (Table 5). In the mixed sowing variant, a significant positive correlation was demonstrated between A and LA and LAI. Parameter A was significantly negatively correlated with T in the sole crop and mixed sowing variants and with ls and LMA in the mixed sowing variant.
Table 4
Correlation matrix between the tested features of the spring wheat grown as a sole crop and in a mixture with red clover at the higher density (n = 12).
Table 5
Correlation matrix between the tested features of the spring wheat grown as a sole crop and in a mixture with red clover at the lower density (n = 12).
. Discussion
As shown by our research, growing spring wheat with undersown red clover had a limiting effect on the gas exchange, plant foliage, and yielding in the wheat. This was undoubtedly the result of the competition between these species related to environmental factors (Kostrzewska et al., 2020; Menéndez et al., 2017). This was documented by the presented study, in which the wheat in the mixture was characterised by a smaller leaf area (LA). In the mixture, however, both the leaf area index (LAI) and the leaf mass per area (LMA) values were higher. The higher LAI value in the mixture resulted from the smaller area per 1 wheat stem (i.e., the area that was shared in the plot with the clover). When growing in unfavourable environmental conditions, plants increase the LMA, which implies greater investment in the structural tissues of the leaves and the thickening of the near-wall palisade parenchyma layer (Bhusal et al., 2021; Cheng et al., 2014). This results in reduced sunlight penetration into their interior. A study conducted by Wanic et al. (2016) into the joint cultivation of spring wheat with Persian clover demonstrated that the wheat in a mixture with the clover formed a less-developed root system, which reduced the water and nutrient uptake. This was reflected e.g. in reduced transpiration and lower element content in the plant. This is confirmed by the present results, as lower Narea and Parea values were noted in the leaves of the wheat in the object with the mixed sowing variant. Nitrogen can affect the photosynthetic capacity by increasing the chlorophyll content. Chloroplasts are organs with very high sensitivity to environmental stresses. In unfavourable conditions, changes occur in their morphology and structure (Ren et al., 2017), which translates into reduced assimilation. This was documented in the present study, in which the chlorophyll content in the leaves of the wheat in the mixture was lower than that in the sole crop variant.
In the object with the undersown crop, the photosynthetic parameters in the wheat deteriorated. Chen ChuanYong et al. (2010) and Yang et al. (2010) also demonstrated that the photosynthetic capacity decreases in conditions unfavourable to plants.
The stomatal conductance (gs) is affected by the structural characteristics of the leaves and their biochemical components (Franks & Farquhar, 2007; Galmés et al., 2013). The stomatal apparatus shows great sensitivity to changes in the environment. One of the first plant responses to the shortage of growth factors (particularly water) is to close the stomata, which reduces gas exchange between the atmosphere and the leaf interior (Reddy et al., 2004). In the present study, it was shown that the CO2 penetration into the leaf interior in the mixture decreased with the reduction in gs (the correlation between gs and ci: 0.88 for the higher density, 0.98 for the lower density, Table 4 and Table 5). The reduced CO2 flow in the wheat leaf interior in the mixture was also indicated by the decrease in the intercellular CO2 concentration (ci), the net assimilation rate (A), and the increase in stomatal limitation (ls). As regards the A parameter, this reduction was only significant in the higher density object. In the wheat grown in the mixture, the stomatal closure was one of the major causes of the decreased assimilation (a significant correlation between gs and A: 0.69 for the higher density and 0.66 for the lower density, Table 4 and Table 5), which was also reported by Guan et al. (2015). A study conducted by Wanic et al. (2017) showed that wheat cultivated in a mixture with the Persian clover took up less N and P than in the sole crop variant. The decrease in photosynthesis under the influence of lower N doses is often explained as a result of decreased reductase activity as well as reduced chlorophyll content and Rubisco activity (Krček et al., 2008; Li et al., 2013; Pal et al., 2005; Sicher et al., 2015). P deficiency has an adverse effect on leaf growth, which reduces their absorption of sunlight (Yaseen & Malhi, 2009) and impairs the photosynthetic process (phosphorylation, ATP). The presented study demonstrated that the reduction in A was due to the lower chlorophyll content in the leaves (correlation between A and Cl 0.90, Table 4 and Table 5) and Narea and Parea - but only in the object with higher plant density (significant correlation between A and Narea 0.78 and between A and Parea 0.80, Table 4). In the mixture, the reduction in A may have also been due to an increase in LMA (thicker leaves reduced the sunlight penetration into their interior), which was confirmed by the correlation analysis (−0.97 for the higher density, −0.77 for the lower density, Table 4 and Table 5).
Transpiration can be regulated by root conductance as well as the opening and closing of stomata. Lalarukh et al. (2014) also demonstrated that wheat growing in stress conditions (due to water deficit) reduced the transpiration rate. This was linked to stomatal limitation which, in the wheat, became the dominant factor in photosynthesis. In this plant, in the mixed sowing variant, a significant positive correlation between gs and E (0.62 for the higher density, 0.65 for the lower density, Table 4 and Table 5) and a negative correlation between ls and E (−0.56 for the higher density, −0.65 for the lower density, Table 4 and Table 5) were demonstrated. WUE and WUE1 improve under stress (Tshikunde et al., 2018). These indicators are improved through a reduction in E due to stomatal limitation (Vitale et al., 2011; Wang et al., 2016). This was similar in the present study (in the mixture, a significant negative correlation between gs and WUE: −0.62 for the higher density; −0.66 for the lower density, Table 4 and Table 5). However, as for the mixture, this statement cannot be related to WUE1. Its value in the mixture was lower than (higher density) or similar (lower density) to that in the sole crop variant. Therefore, in the higher density object, the wheat managed water less efficiently in the mixture than in the sole crop variant. In the mixture, a reduction in E increased the temperature of the leaves, which is also confirmed by Halder and Burrage (2003). Moreover, Fang et al. (2012) report that an increase in T is linked to reduced plant metabolism (reduced CO2 supply to the leaf interior, decreased transpiration). In the present study, the increase in T in the mixture showed a significant relationship with a decrease in gs, ci, A, and E. Similar relationships were reported by Wang et al. (2013, 2015). Under the influence of the higher T value, however, the ls and WUE values increased. The higher T in the wheat is associated with stomatal closure and, thus, with reduced evaporation. Under such circumstances, the water and nutrient uptake by the root system of this cereal is reduced due to reduced transpiration (Wanic et al., 2017). Guo et al. (2016) also proved that, with an increase in T, stomatal conductance (gs), transpiration (E), and net assimilation rate (A) values decrease. Blad et al. (1988) and Elbashier et al. (2012) report a strong negative correlation between the T value and the N content in the leaves, which, however, was not confirmed in the current study (in the mixture, the correlation was weak and insignificant, Table 4 and Table 5). In the lower T conditions, the leaves were also characterised by higher Cl content, as indicated by the significant negative coefficients of correlation in the mixture (−0.66 for the higher density; −0.71 for the lower density, Table 4 and Table 5).
In the mixture, the competition from the clover reduced assimilation in the wheat leaves, which reduced its growth. It was one of the major causes of the reduction in the yield of these cereal grains, as in the mixture, the scale of the reduction in assimilation and the grain yield was similar. A significant positive correlation was demonstrated between assimilation and the grain yield (0.75 for the higher density; 0.60 for the lower density, Table 4 and Table 5), which is consistent with the results presented by Mauro et al. (2011) and Xu et al. (2016). The reduction in the wheat grain yield under the influence of the undersown clover observed in the present study is in contrast to the reports presented by Gaudin et al. (2014) and Henry et al. (2010), who demonstrated an increase in the yield of this cereal under the influence of clover.
. Conclusions
The cultivation of spring wheat with undersown red clover had a limiting effect on leaf gas exchange in this cereal. In the wheat, a significant reduction in the stomatal conductance, intercellular CO2 concentration, net assimilation rate, and transpiration rate and an increase in the limitation value and the instantaneous water use efficiency were noted. The deterioration in the gas exchange parameters in the wheat grown in the mixture in the higher density object and the lower density object was similar. The drop in assimilation in the mixture was one of the major causes of the reduced yielding. The reduction in the grain yield in the mixture in both plant density objects was similar. Therefore, there is no need to decrease the sowing density for this cereal if it is to be cultivated with undersown clover. Under the strong competition from the wheat, the clover produced a yield of above-ground biomass lower by over 70% than that in the sole crop variant. However, irrespective of the above, when choosing this species for cultivation with cereals, its beneficial impact on the soil environment and the successive crops should also be considered.
