. Introduction
Micronutrients, which play key roles in plant growth and development, are decreasing in our soils because of an increasing dependence on inorganic fertilizers (Vatansever et al., 2017). When micronutrients are relatively short in supply, plant growth and yield are severely decreased (Rouached & Tran, 2015). Among the micronutrients boron (B), zinc (Zn), manganese (Mn), iron (Fe), copper (Cu), molybdenum (Mo), and chlorine (Cl), B is considered essential for high and quality crop yields, including rice (Huang et al., 2017; A. Kumar et al., 2016). Boron plays a key role in tissue growth, and its shortage limits or inhibits plant growth at both the vegetative and reproductive stage (Shireen et al., 2018). Recently, B deficiency in the soil has been detected as a grave agricultural issue, leading to reductions in rice productivity (Bhattarai & Midmore, 2009; Zhu et al., 2018). At the same time, the accumulation of soluble salts in the soil or water is another major threat for plants, leading to a reduction in crop profits for growers (Ventura et al., 2015). Approximately one-third of irrigated lands globally suffer from problems due to salinity (Munns & Gilliham, 2015). The salinization of crop lands can occur via four major processes: groundwater salt rising by capillary action, irrigation with salt water, salt sedimentation through rain, and wind-blown salt (Ding et al., 2012; Upadhyay & Singh 2015). Micronutrient availability depends on the salinity of the soil environment, soil texture, pH, CaCO3, and organic matter (Matijevic et al., 2014; Najib et al., 2017; Xie et al., 2015). At low salt concentrations, crop yields were found to be either mildly affected or not affected at all, whereas the yields of most crops were severely affected at high salt concentrations (Farhangi-Abriz & Nikpour-Rashidabad, 2017; Hassanein et al., 2020; Zamani et al., 2019). A significant decrease in the productivity of rice (Pires et al., 2015; M. Hussain et al., 2018), wheat (Feizi et al., 2007), maize (Baghel et al., 2019; K. Kumar et al., 2017), barley (Tavakkoli et al., 2011), and sunflower (Farghaly et al., 2016; Flowers & Colmer, 2015) was reported with increased soil salinity.
Rice, a major staple crop, was reported to be moderately salt tolerant (Kalita & Tanti, 2020; V. Kumar et al., 2015). Boron has been found to help several crops to cope with salt stress in saline soils (Flowers & Colmer, 2015; Zhao et al., 2019). However, high concentrations of B in saline soils inhibit plant growth and reduce their yields. The reduction in plant growth at elevated B levels is due to efficient B uptake with the higher levels of Na+ in saline soils (Martinez-Ballesta et al., 2008). Therefore, rice growers should apply the correct amount of B fertilizer to optimize the negative effects of salinity to some extent on water, as well as the uptake of nutrients (Moraes et al., 2015). Previous studies have evaluated the importance of B and its role in regulating different biological systems (Mosa et al., 2016; Uluisik et al., 2018). However, the role of B in mitigating salinity and enhancing rice yield components still needs to be evaluated. This study was undertaken in the coastal region of Bangladesh, to determine the effects of B soil applications on the growth, development, and yield-related attributes of the rice variety ‘Swarna,’ under saline soil conditions. To the best of our knowledge, this is the first study on B applications in saline soils to determine the effects on the locally important rice variety ‘Swarna,’ and will provide useful information for further research to improve the performance of this variety and other related species.
. Material and Methods
. Location of the Study
The study was carried out in a net house, using a number of glazed pots, at Noakhali Science and Technology University, Noakhali, Bangladesh, during the Australia season of 2019. The soil was collected from the areas around Bangla Bazar, Dharmapur Union, Sadar, Noakhali, Bangladesh, located near Noakhali Science and Technology University. The soil used in the experiment was sandy loam in texture with a pH of 6.5.
. Soil Sampling
The soil was examined and then sent to the Soil Resource Development Institute (SRDI), Khamar Bari, Dhaka, Bangladesh, to test its electrical conductivity (EC), a measure of the concentration of soluble salts in the soil, as well as to assess the other nutrients that were present (Table 1).
. Collection of Soil for Nonsaline and Saline Soil Preparation, and Pot Preparation
The nonsaline soil sample, with an EC of 3.9 dS/m and pH of 6.5, was collected from the fields and placed on polythene sheets for air drying. The soil was air-dried for 10 days. Ten kilograms (10 kg) of the air-dried soil was placed in pots that were 20 cm deep and 25 cm in diameter. Each of the pots was filled with 10 kg of pretreated soil. However, saline soil (EC 9.0 dS/m) was puddled before the transplantation of rice seedlings. Nitrogen was applied as urea at the rate of 130 kg ha−1 in three equal split doses, i.e., at time of transplantation, 20, and 45 days after transplantation (DAT), respectively. A basal dose of phosphorus (30 kg P2O5) and potassium (55 kg K2O) was applied as single super phosphate (SSP) and sulphate of potash, respectively, on a per hectare basis during puddling. Boron was also applied as solubor at the rate of 4.5, 5.9, 7.5, and 10.0 kg B ha−1 during puddling. All other agronomic practices were continued as usual.
. Planting Materials
In the experiment, 28-day-old seedlings of the rice cultivar ‘Swarna’ were raised in B free soil and thinned to four seedlings per pot. Two seedlings were then planted in each raised mound of soil, called a hill, within the pots. The soil was kept submerged by applying water daily.
. Experiment Design and Treatments
The following six treatments were applied to determine the effects of B on the growth and development of ‘Swarna’ rice in salt-rich soils:
T0: Saline condition of EC 9.0 dS/m + no additional boron;
T1: No saline condition + no additional boron;
T2: Saline condition of EC 9.0 dS/m + B as solubor at the rate of 4.5 kg B ha−1;
T3: Saline condition of EC 9.0 dS/m + B as solubor at the rate of 5.9 kg B ha−1;
T4: Saline condition of EC 9.0 dS/m + B as solubor at the rate of 7.5 kg B ha−1;
T5: Saline condition of EC 9.0 dS/m + B as solubor at the rate of 10 kg B ha−1.
The doses of B were measured to meet the desired dose levels of medium (T2), moderate (T3), high (T4), and very high (T5), in the experimental pot soil.
. Data Collection
Data for the plant growth parameters, including plant height and number of effective tillers, was observed at 30, 45, and 60 DAT. Panicle length, number of filled grains, number of sterile grains, total weight, panicle weight, grain weight, straw weight, and 1,000-grain weight were recorded during harvesting.
. Statistical Analysis
Data were analyzed using SPSS statistical software (version 20.0; SPSS Inc., Chicago, IL, USA). One-way ANOVA was utilized to observe the comparison of the means of the treatment groups. Post hoc analysis (Tukey’s test) was applied to assess whether specific groups significantly varied from each other in maintaining alpha levels and statistical assumptions for normality. For significant differences to be examined, consistent and reasonable variation in magnitude, among the normal soil condition, control, as well as treatments, was necessary; p ≤ 0.05 was considered statistically significant. Numerical data are presented as means ± standard error of the mean (SEM).
. Results
. Effects of B Applications on Different Stages of Rice Growth Under Saline Conditions
. Plant Height
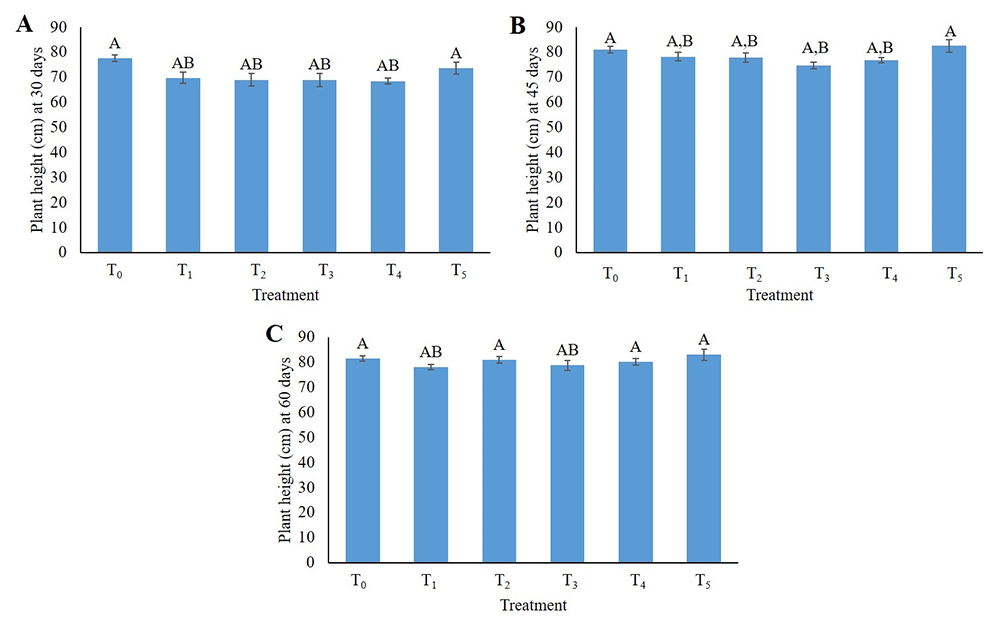
Boron applications had no significant effect on the height of ‘Swarna’ (Figure 1). Based on the recorded plant heights at 30, 45, and 60 DAT, no significant difference was observed after the boron application.
Figure 1
Influences of boron in saline conditions on the plant height of the rice ‘Swarna.’ (A) 30 DAT; (B) 45 DAT; and (C) 60 DAT. T0: Saline condition, EC = 9.0 dS/m + no additional boron; T1: No saline condition + no additional boron; T2: Saline condition of EC 9.0 dS/m + boron application as solubor at a rate of 4.5 kg B ha−1; T3: Saline condition of EC 9.0 dS/m + boron application as solubor at a rate of 5.9 kg B ha−1; T4: Saline condition of EC 9.0 dS/m + boron application as solubor at a rate of 7.5 kg B ha−1; T5: Saline condition of EC 9.0 dS/m + boron application as solubor at a rate of 10 kg B ha−1. Data are the means of four replicates ± SEM. All data were analyzed by one-way analysis of variance. Tukey’s test was used to identify the differences between treatments. Values with different superscript characters (A, B, C) are significantly different (p < 0.05).
. Number of Tillers
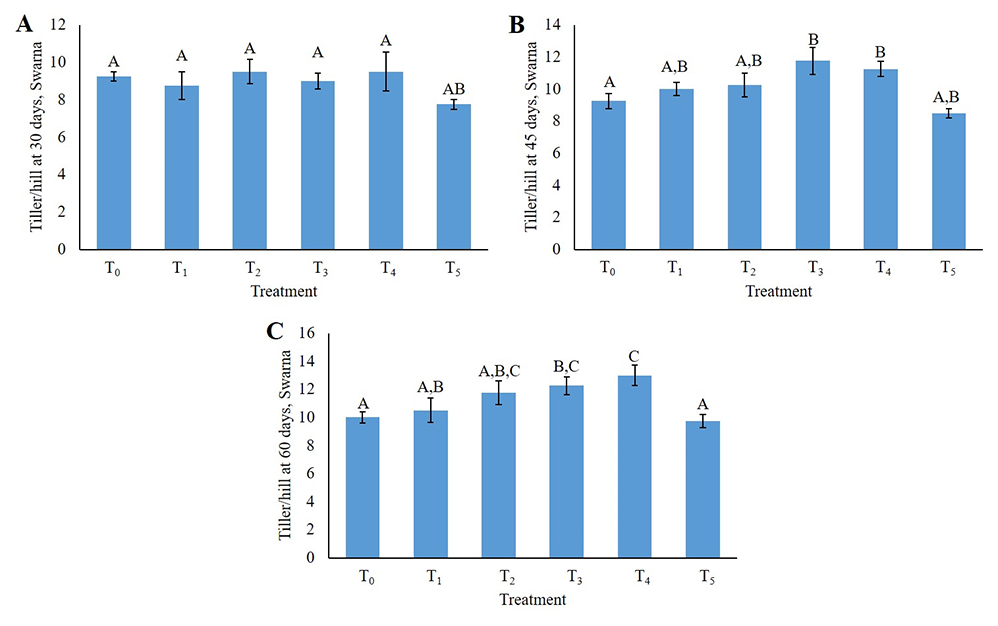
The number of tillers is generally influenced by the surroundings, plant nutrients, and genotype of the respective plant (S. Hussain et al., 2019). The moderate (T3) and high dose (T4) B applications significantly enhanced the number of tillers per hill compared to the control, at both 45 and 60 DAT (Figure 2). The study showed that T0 showed an average tiller number of 9.25, 9.25, and 10 at 30, 45, and 60 DAT, respectively. However, in both the moderate and high dose B treated plants, the average tiller number was 12.25 and 13, respectively, at 60 DAT.
Figure 2
Influence of boron in saline conditions on the number of tillers per hill for the rice ‘Swarna.’ (A) 30 DAT; (B) 45 DAT; and (C) 60 DAT. T0: Saline condition, EC = 9.0 dS/m + no additional boron; T1: No saline condition + no additional boron; T2: Saline condition of EC 9.0 dS/m + boron application as solubor at a rate of 4.5 kg B ha−1; T3: Saline condition of EC 9.0 dS/m + boron application as solubor at a rate of 5.9 kg B ha−1; T4: Saline condition of EC 9.0 dS/m + boron application as solubor at a rate of 7.5 kg B ha−1; T5: Saline condition of EC 9.0 dS/m + boron application as solubor at a rate of 10 kg B ha−1. Data are the means of four replicates ± SEM. All data were analyzed by one-way analysis of variance. Tukey’s test was used to identify the differences between treatments. Values with different superscript characters (A, B, C) are significantly different (p < 0.05).
. Effect of B on Yield Components of Rice Under Saline Conditions
. Panicle Length
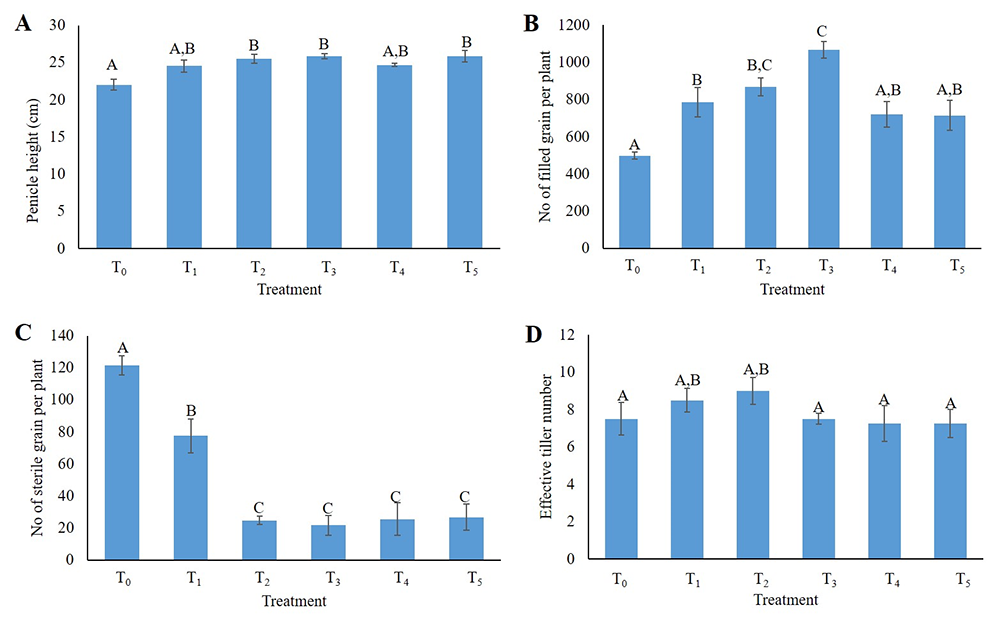
Panicle length was meaningfully influenced by the different doses of boron. Various lengths of panicle ranging from 22.02 cm to 25.84 cm were found with increasing B dose. The highest panicle length of 25.84 cm was recorded in T3 (moderate B), while the lowest length of 22.02 cm was detected in T0 (Figure 3A).
Figure 3
Panicle height (cm) (A), number of filled grains per plant (B), number of sterile grains per plant (C), and effective tiller number (D), as influenced by boron in saline conditions. T0: Saline condition, EC = 9.0 dS/m + no additional boron; T1: No saline condition + no additional boron; T2: Saline condition of EC 9.0 dS/m + boron application as solubor at a rate of 4.5 kg B ha−1; T3: Saline condition of EC 9.0 dS/m + boron application as solubor at a rate of 5.9 kg B ha−1; T4: Saline condition of EC 9.0 dS/m + boron application as solubor at a rate of 7.5 kg B ha−1; T5: Saline condition of EC 9.0 dS/m + boron application as solubor at a rate of 10 kg B ha−1. Data are the means of four replicates ± SEM. All data were analyzed by one-way analysis of variance. Tukey’s test was used to identify the differences between treatments. Values with different superscript characters (A, B, C) are significantly different (p < 0.05).
. Number of Filled Grains
The number of filled grains per panicle is a principal yield determinant. A considerable variation from 498.25 to 1,067.50 was observed in the number of filled grains per plant owing to various B treatments. The maximum number of filled grains, 1,067.50, was produced in T3, which was significantly higher than that of T0 and T1 (Figure 3B).
. Number of Sterile Grains
The number of sterile grains varied from 21.75 to 121.5 among all treated plants. All B treated rice plants (T2, T3, T4, and T5) showed significantly lower numbers of sterile grains per plant compared to that of the controls (T0 and T1; Figure 3C).
. Number of Effective Tillers
The number of effective tillers was measured, and the results showed no significant difference between the control and treatments. However, the highest number of effective tillers was recorded as nine in T2 (moderate boron treatment), whereas the lowest number was recorded as 7.5 in T0 (control; Figure 3D).
. Thousand-Seed Weight
The 1,000-seed weight varied from 21.21 g to 26.36 g among the various B treatment plants. Significantly higher 1,000-seed weights were recorded as 26.36 g and 25.87 g in the T2 and T4 treatments, respectively, whereas the lowest weight of 21.88 g was observed in the control (T0; Figure 4A).
Figure 4
Total 1,000-seed weight (g) (A), panicle weight including grains (g) (B), total straw yield (g) (C), and total weight of straw, panicle, and grain (g) (D) for the rice ‘Swarna,’ influenced by boron in saline conditions. T0: Saline condition of EC 9.0 dS/m + no additional boron applied; T1: No saline condition + no additional boron applied; T2: saline condition of EC 9.0 dS/m + boron application as solubor at a rate of 4.5 kg B ha−1; T3: Saline condition of EC 9.0 dS/m + boron application as solubor at a rate of 5.9 kg B ha−1; T4: saline condition of EC 9.0 dS/m + boron application as solubor at a rate of 7.5 kg B ha−1; T5: saline condition of EC 9.0 dS/m + boron application as solubor at a rate of 10 kg B ha−1. Data are the means of four replicates ± SEM, while (A) shows the mean of three replicates ± SEM. All data were analyzed by one-way analysis of variance. Tukey’s test was used to identify the differences between treatments. Values with different superscript characters (A, B, C) are significantly different (p < 0.05).
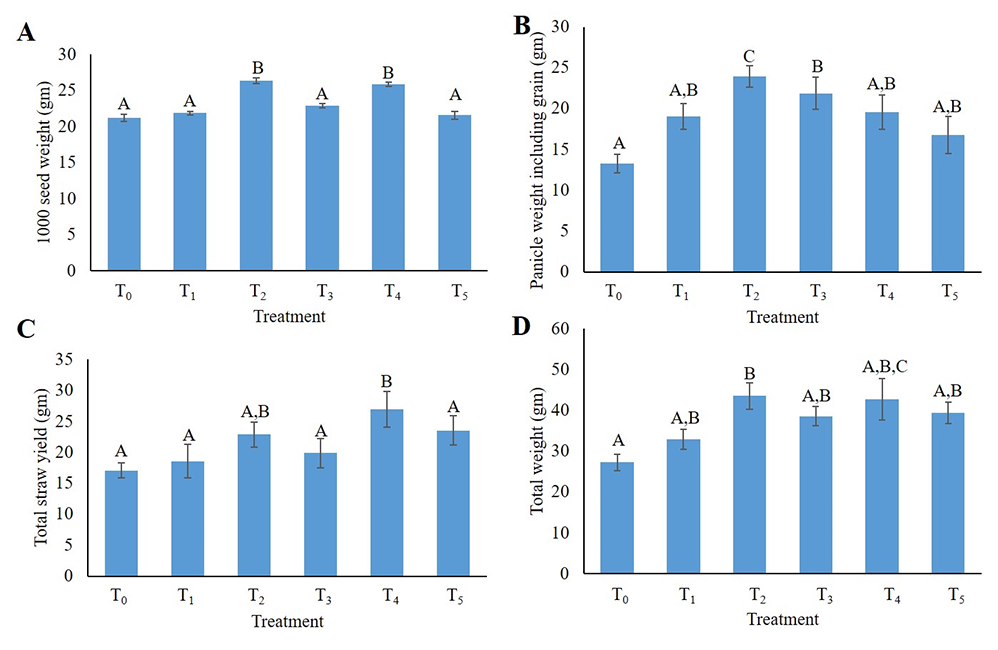
. Panicle Weight, Straw Weight, and Total Weight
Panicle weight, including grain weight, was significantly higher in T2 (23.96 g) and T3 (21.84 g) when compared to the controls T0 (13.96 g) and T1 (19.04). However, no significant difference was observed between T1 and T3 (moderate B) (Figure 4B). Besides, straw weight was also measured, and the results showed that high B treatment (T4) significantly increased the total straw weight compared to that of the control and all other treatments (Figure 4C). In addition, the total weight of the plants per pot was measured and T2 treatment showed significant difference when compared to the control (Figure 4D).
. Total Grain and Straw Yields
Results in Table 2 show that the grain yield ranged from 11.21 g to 21.89 g per hill; the highest grain yield of 21.89 g was found in T2 (moderate B) and the lowest of 11.21 g in T0. On the other hand, the straw yield ranged from 17.09 g to 26.97 g per hill, due to different treatments of boron; it was significantly higher in T2 (22.92 g), T4 (26.97), and T5 (23.55), compared to T0 (17.09) and T1 (18.56).
Table 2
Grain and straw yields of the rice ‘Swarna’ influenced by different treatments of B under saline conditions.
. Discussion
Boron is an important micronutrient, that has a pivotal role in stimulating plant growth and development (Mosa et al., 2016). Boron deficiency has been reported as a severe agricultural issue in more than 80 countries, for over 100 crops, in the last couple of decades (Atique-ur-Rehman et al., 2018). Deficiency of B can be readily corrected by soil applications of B fertilizers (Shorrocks, 1997). On the other hand, salt stress is one of the major agricultural problems that reduces crop yields by affecting the soil, water, and nutrient balance of plants (Guo et al., 2016; Nam et al., 2017; Paul & Lade, 2014). Around 20% of total agricultural lands and 50% of croplands in the world are reported to be salt stressed (Pitman & Läuchli, 2002). Although maximum salinity occurs in arid and semi-arid regions, salinity was identified in nearly all climatic zones.
Rice is an important and widely grown cereal crop whose agronomic productivity is adversely affected by salinity (Nieves-Cordones et al., 2016). Therefore, it is important to elucidate possible strategies for cultivating rice in saline soils to improve its performance. In our experiment, although ‘Swarna’ showed different sensitivities to salt treatments, overall B applications in saline environments substantially improved the yield-related components of rice. In this study, the maximum number of tillers at various growth stages were found to be different between the treatments and control (Figure 2). The highest panicle lengths were recorded in the saline soils treated with low, medium, and very high amounts of B, supporting the findings of Shahid et al. (2018). This previous study also reported that B treatments improved vegetative and reproductive growth under abiotic stress conditions at high temperatures. Therefore, higher panicle lengths can result from boron applications, which, under saline conditions, mitigates abiotic saline stress. However, further experiments are required to understand the mechanisms of B in decreasing salt stress.
In another study, it was shown that the use of B at the heading or flowering stage yielded a higher number of grains per panicle (M. Hussain et al., 2012). In the current study, the highest number of filled grains (1,067.50) was from T3 and the lowest number (498.25) was from the saline soil (T0), indicating that B along with saline soil has a positive effect on rice. The reason for the minimum filled grain yield, and high pollen infertility in B deprived soil (T0) may be due to salt stress and B, in this case, may play a key role in these processes. At the same time, the maximum number of sterile grains (121.5) from T0 and the minimum number of sterile grains (21.75) from T3, under saline conditions, is also appreciable here. Moreover, a previous study reported that rice yields under salinity declined due to the decrease in spikelets owing to their malformation and degeneration (Radanielson et al., 2018). On the other hand, the highest panicle weight of 23.96 g in the T2 treatment and the lowest panicle weight of 13.27 g in the control T0 indicates that salinity, along with B application, might have played a role in enhancing spikelet formation. The highest total weight of straw, including panicles and grains, in T2 was found to be significantly higher (43.54 g) than in T0 (27.26 g) and T1 (32.90 g). Besides, the highest number of effective tillers was from T2 (9.0) and the lowest number was from T4 and T0 (7.25), and these results were in accordance with the findings of Mackill (2007) and Rerkasem et al. (1993), who corroborated that high salinity negatively affects the number of effective tillers. Based on this study, it is tempting to speculate that B applications might enhance the tiller number of salt-stressed rice plants. On the other hand, the maximum 1,000-grain weight of 26.36 g from the T2 treatment and the minimum weight of 21.21 g from the control (T0), were in agreement with M. Hussain et al. (2012), who reported that the 1,000-grain weight may increase due to the application of boron. The highest grain yield of 21.89 g in the T2 treatment and lowest grain yield of 11.21 g in the control T0 indicate that grain yields significantly increase with increasing B applications, under saline soil conditions (Table 2); this is in consonance with Rerkasem et al. (1993). Straw yields in the saline environment increased by approximately 45% when compared to the control due to the application of B. Based on these findings, the present study concludes that medium (T3) or high (T4) levels of B applications to saline soils improves the soil as well as the panicle weight, total weight, effective tiller number, and grain yield (Figure 5). Total weight of 1,000 seeds and straw were improved with the application of the treatment of high (T4) dose of B. However, moderate (T3) levels of boron application positively affected the growth and yield, especially for the panicle length, filled grain, and number of sterile grains, in all conditions. It seems that the enhancement in growth and development of rice ‘Swarna’ might be due to the fulfillment of B requirements, resulting in super pollination, grain structure, as well as seed setting.
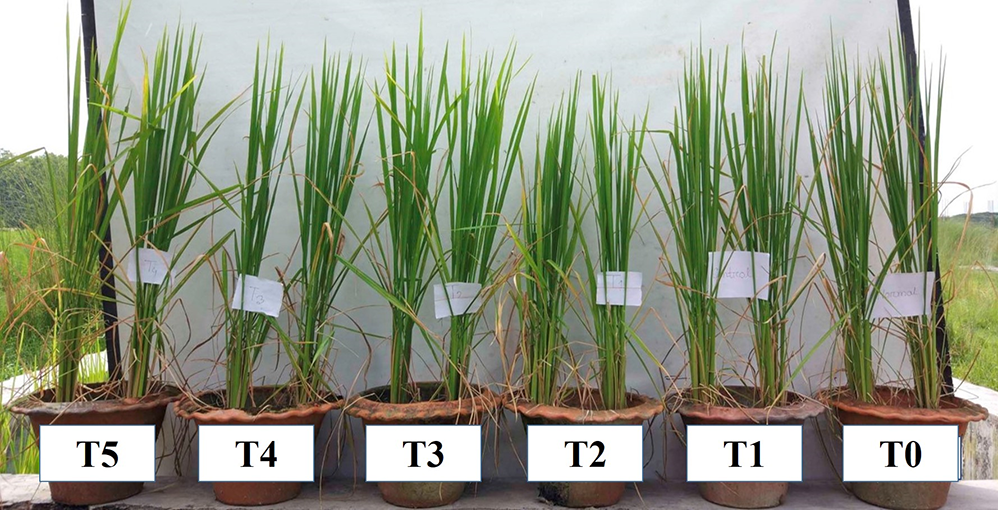
Figure 5
Photograph of the rice ‘Swarna’ influenced by boron under saline conditions. T0: Saline condition of EC 9.0 dS/m + no additional boron applied; T1: No saline condition + no additional boron applied; T2: Saline condition of EC 9.0 dS/m + boron application as solubor at a rate of 4.5 kg B ha−1; T3: Saline condition of EC 9.0 dS/m + boron application as solubor at a rate of 5.9 kg B ha−1; T4: Saline condition of EC 9.0 dS/m + boron application as solubor at a rate of 7.5 kg B ha−1; T5: Saline condition of EC 9.0 dS/m + boron application as solubor at a rate of 10 kg B ha−1.