. Introduction
Tomato is one type of vegetable that is in demand by the people of Indonesia. The demand and need for tomatoes is very high so that many farmers grow tomatoes. Data from the Indonesian Central Bureau of Statistics (2022) notes that tomato production continues to increase every year: 1.08 million tons in 2021, then 1.11 million tons in 2022, and continues to increase to 1.12 million tons in 2023.
Many tomato planting centers are found in the highlands covered by Andisols. Andisols develop from volcanic materials that are found in mountainous areas (Staff, 2003; Sukarman & Dariah, 2014; Weil & Brady, 2017). They are fertile and productive soils for agriculture in Indonesia with organic matter content < 25% (Buol et al., 2011; Lal, 2017; Subardja et al., 2014; Sukarman & Dariah, 2014). That is why many tomato farms are located on Andisols. However, limited phosphorus and potassium nutrients are the main factors influencing maximum tomato production in Andisols. The soil contains 2% of Al and Fe, which can bind phosphorus up to 85% or more in Andisols. Al–P and Fe–P bonds in acid soils result in a low level of P nutrient availability (Weil & Brady, 2017). Adsorbed phosphate reduces the availability of phosphorus to the plant (Channarayappa & Biradar, 2018). The availability of potassium for plants is also limited. Approximately 90–98% of the total potassium in the soil is slowly or even not available to plants. K bound in the primary mineral structure is very difficult for plants to absorb. In general, the available potassium is dissolved in the soil solution in the cation exchange zone, with about 1–2% of the total potassium in the soil (Marschner, 2012).
Precision phosphorus and potassium fertilization is needed to increase yields, at the same time with focus on cost-effective fertilization in tomato cultivation. The availability of phosphorus and potassium nutrients in the soil is essential for the growth and development of plants (Aprianto et al., 2020; Gunawan et al., 2019; Hossain et al., 2017). The availability of potassium in the soil is strongly influenced by the cations adsorbed on the soil fraction.
Soil-nutrient extraction methods are used to determine the availability of nutrients in the soil (e.g. Khan et al., 2024; Koralage et al., 2015; Paisey et al., 2023; Panda & Patra, 2018; Spargo, 2016). By knowing precisely the availability of phosphorus and potassium in the soil, we can determine the precise dosage of fertilization for plants, including tomato plants. Precision fertilization will provide the right amount of fertilizer for the growth and development of tomato plants to be able to produce maximum yields. Thus, farmers will not be wasteful in providing fertilizer, so that they can harvest tomatoes optimally while increasing the efficiency of fertilizing costs.
An appropriate soil phosphorus and potassium extraction method will accurately describe the phosphorus and potassium nutrient content in the context of plant growth. This information is vital in determining accurate fertilizer rate recommendations for each soil type and crop type, including tomato. A correlation test was performed to select the proper phosphorus and potassium extraction methods for certain types of soil and vegetables (Culman et al., 2019). The extraction method correlation test will not give a significant value if it is not related to the agronomic variables of the plant (Widyanti & Susila, 2015).
In Indonesia, soil analysis laboratories use the Bray-1, Olsen, HCl-25%, and Ammonium acetate methods to test soil phosphorus and potassium for all types of soil to determine all types of plant fertilizer doses. Several laboratories have used Morgan-Wolf and Mehlich-1 to analyze the availability of phosphorus and potassium content in the soil. In fact, for optimal results, each type of soil should have its own soil extraction method to find out every nutrient available in that soil (Koralage et al., 2015). However, it is not yet known which extraction method is best for each soil type and plant. In this research, the correlation test will provide an overview of the closeness and direction of the relationship between soil phosphorus and potassium-extraction methods and the relative dry weight of tomato and will help us to determine the best phosphorus and potassium extraction method in Andisols for tomato cultivation.
. Materials and methods
. Study area, soil sampling, and analysis
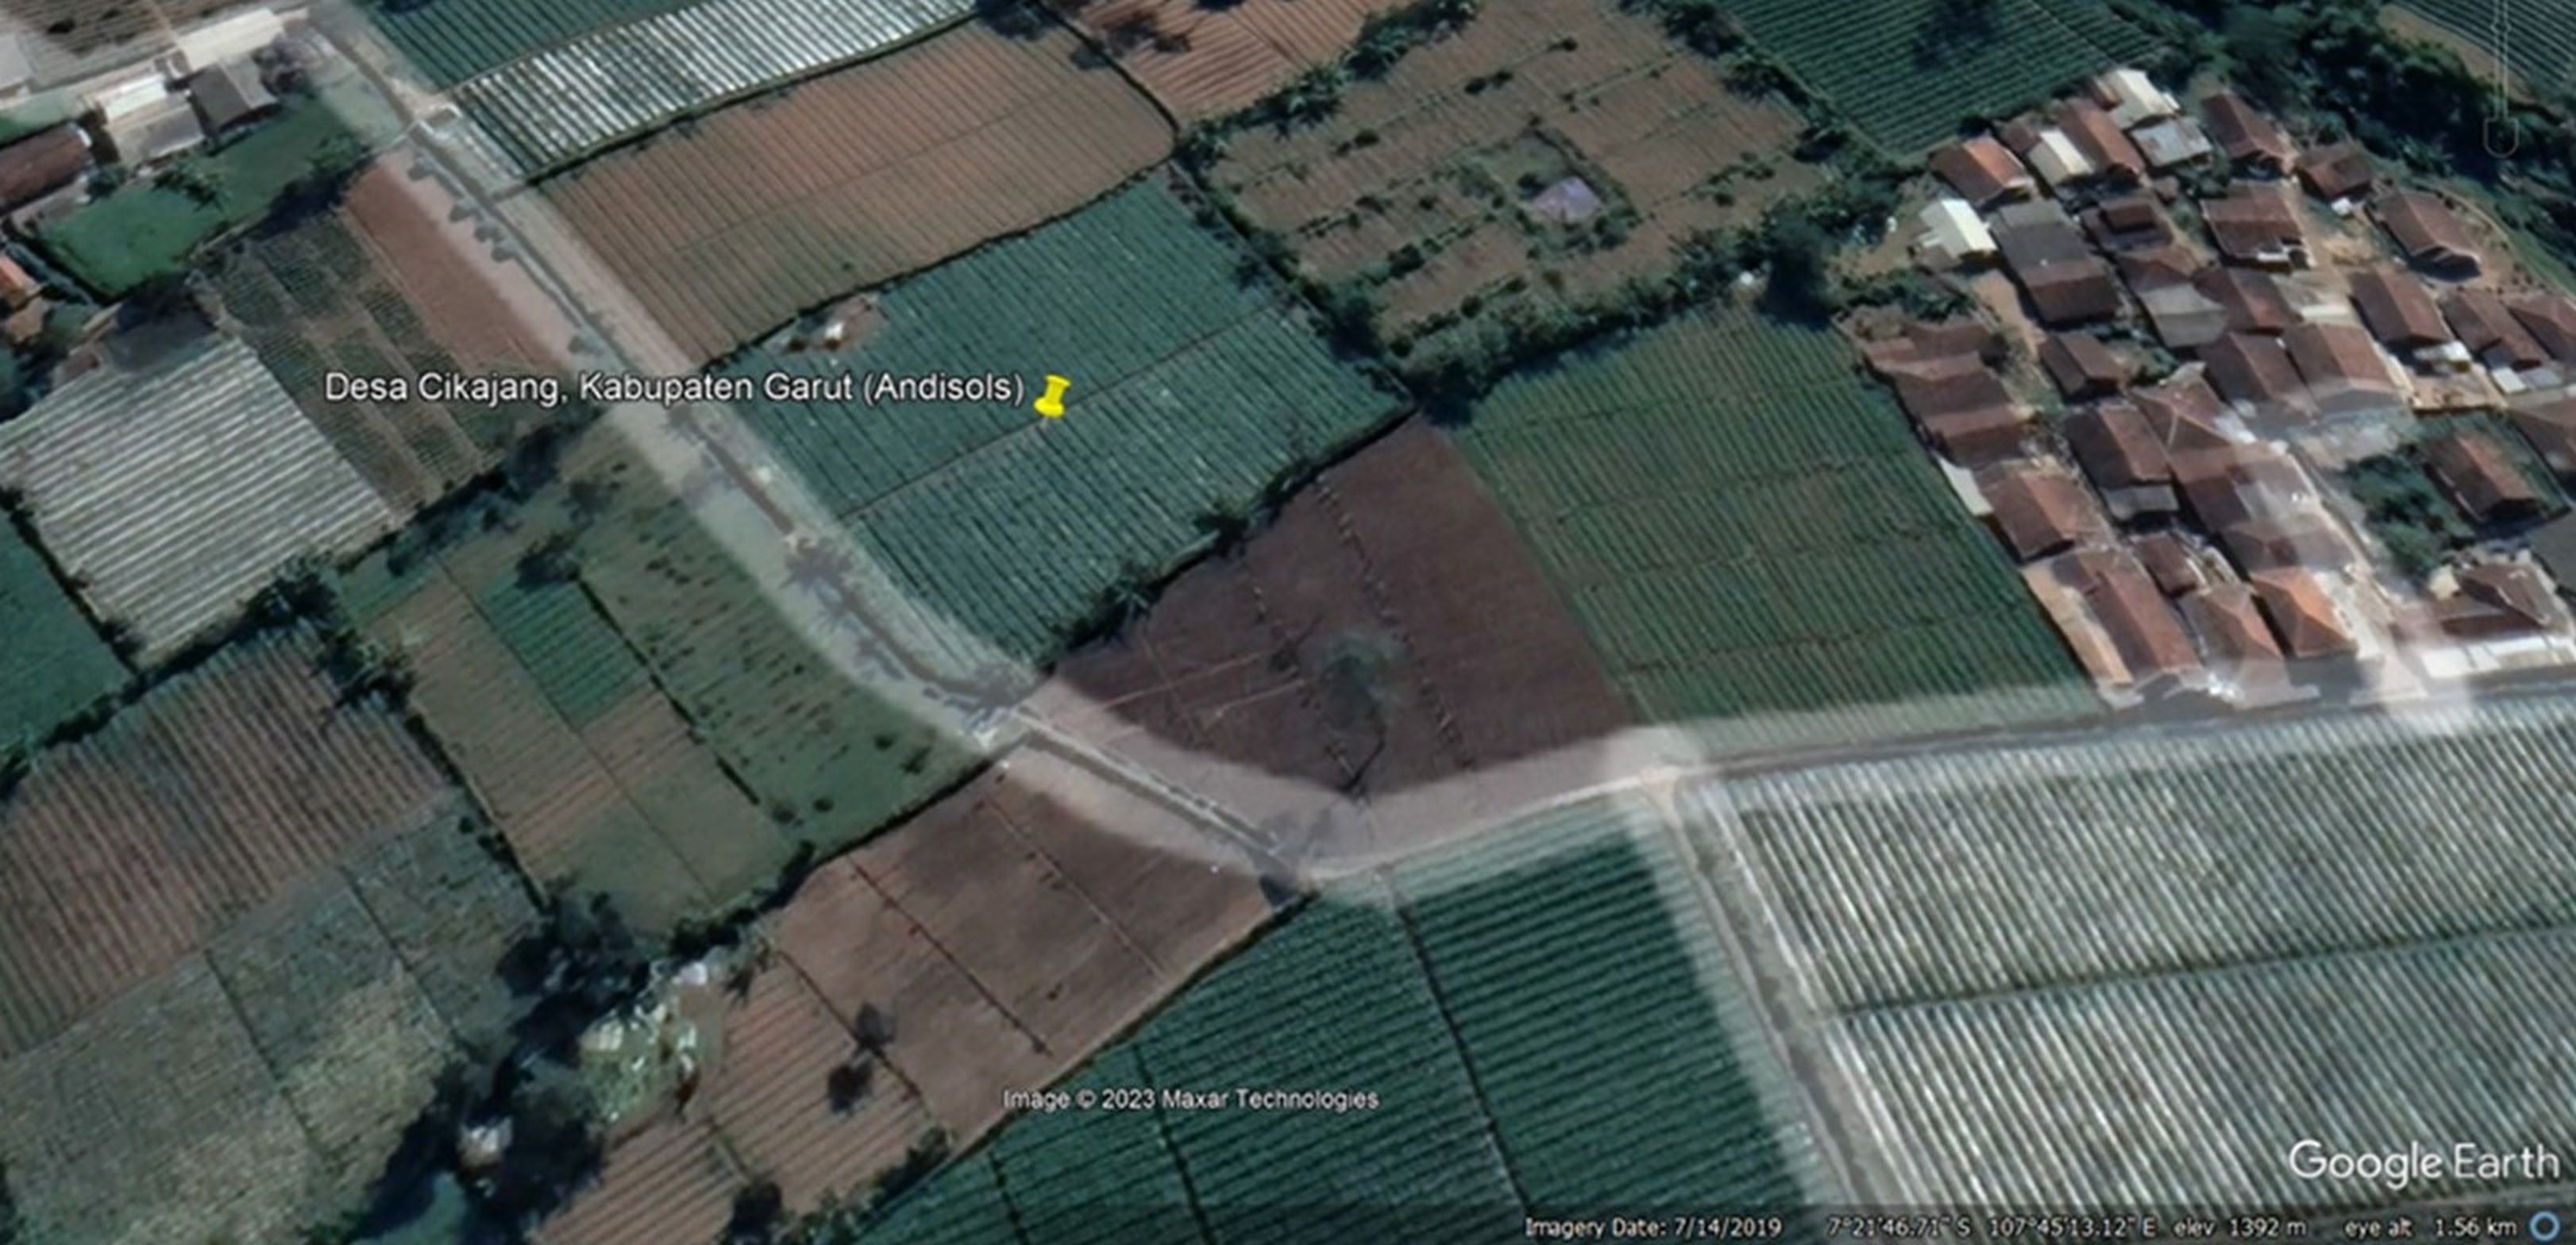
The research was conducted from February to June 2021 at the Experimental Garden of the Center for Tropical Horticultural Studies (PKHT), IPB University in Tajur, Bogor (Figure 1). Samples of Andisols soil were collected from a location near Cikajang Village, Garut Regency, Indonesia (7° 21′46.7″S 107°45′13.1″E).
The first activities began with taking Andisols samples carried out by following the diagonal method (Dari et al., 2019). Fifty points of soil samples were collected with a spade at 25–30 cm from the top of the soil, and then homogenized by mixing for 10 minutes. Tests to characterize the soil were performed at the Soil Chemistry and Fertility Laboratory, Department of Soil Science and Land Resources, Faculty of Agriculture, IPB University. The laboratory tested the phosphorus and potassium content in the soil samples using 5 extraction methods (Mehlich-1, Bray-1, Morgan-Wolf, Ammonium acetate, and HCl-25%) (Adesanwo et al., 2013; Amisnaipa et al., 2014; Brown, 1987; Gunawan et al., 2019; Lumbanraja et al., 2017; Morgan et al., 2010; Westerman, 1990).
. Plant propagation
The material used in this study included tomato seeds, urea, superphosphate, and potassium chloride. 25 × 30 cm pots, digital scales and calipers, and an oven were used. A total of 6 kg of soil which had been homogenized in the previous stage was put into a plastic pot in a greenhouse. The pots were arranged using a randomized complete block design (RCBD), which was repeated five times. Tomato seeds were sown using a mixture of cocopeat and Mitraroasted husks with a ratio of 1:1 (w/w). 21-day-old tomato seedlings were replanted into pots. The plants were watered using an automatic fertigation machine. The fertigation machine flushed 3 times a day at 07.00 am, 1.00 pm, and 4.00 pm. The volume of watering was 250 ml per pot. The tomato fertilization comprised 0.6 g/pot of urea, 2.0 g/pot of superphosphate, and 1.9 g/pot of potassium chloride. The determination of the fertilizer dose was based on that issued by the FERADS application, with a media weight of 6 kg per pot. Only urea and potassium chloride were used in the phosphate correlation test, while the potassium-correlation test involved fertilization with only urea and superphosphate. The tomato plants were harvested entirely or removed from the pot at 40 days after planting (DAP).
. Observations and statistical analyses
The biomass referred to in this study was the weight of plant roots, stems, and leaves taken when the tomato plant entered the beginning of the generative phase (plants aged 40 DAP). The fresh tomato plant roots, stems, and leaves were placed in the oven at 70 °C for three days to get the value of biomass dry weight. Relative biomass dry weight (DWB) was the ratio between the dry weight of biomass for specific nutrient treatments and the maximum dry weight of biomass for phosphorus and potassium. The calculation refers to Gunawan et al. (2019) with the formula:
Description: Yi = dry weight of biomass in the phosphorus and potassium treatments; Ymax = maximum dry weight of biomass at phosphorus and potassium treatments.
The magnitude of the error model of the linear regression equation was calculated with the formula:
Description: xi = actual measurement; yi = prediction measurement; RMSE = Root Mean Square Error; MRE = Mean Relative Error.
. Results and discussion
. Properties of studied Andisols
The properties of the Andisols-Garut, Indonesia soils are shown in Table 1. Based on the procedure of soil analysis proposed by Hazelton and Murphy (2016), the Andisols taken from the research sites has high C-organic, total N-content, and high content of phosphorus and potassium, but the pH = 6.01 is slightly acidic. The soil acidity causes the availability of nutrients, especially phosphorus and potassium, for plants to be disrupted (Barker & Pilbeam, 2015). In acidic conditions (pH < 7), phosphorus and potassium is bound by Al and Fe. The low availability of phosphorus and potassium in Andisols has also been reported previously (Izhar et al., 2012). Root growth is hampered and plant roots shorten in more severe conditions. This disrupts nutrient transport, resulting in plants experiencing nutrient deficiencies in their tissues, such as stems and leaves. Therefore, when planting in Andisols, it is necessary to apply phosphorus and potassium fertilization to overcome these limitations (Hati & Susila, 2016; Widyanti & Susila, 2015).
Table 1
Soil properties of Andisols-Garut, Indonesia.
| Soil type | Soil propertiesa | ||||
|---|---|---|---|---|---|
| pH H2O | C-organic (g/kg) | N-Total (g/kg) | Available nutrient (mg/kg) | ||
| Phosphorus | Potassium | ||||
| Andisols-Garut | 6.01 | 27.2 | 6.3 | 16.11 | 309.08 |
| Method | pH meter | Walkley and Black | Kjeldahl | Mehlich-1 | Mehlich-1 |
. Andisols phosphorus and potassium-soil extraction methods for tomato cultivation
The best Andisols phosphorus and potassium-soil extraction methods for tomato plants were determined by considering the correlation coefficient (r), coefficient of determination (R2), significance, RMSE, and MRE values. The results showed that all the phosphorus-soil extraction methods for Andisols were positively correlated to the increase in the relative dry weight of tomato plants with a high determination correlation (0.5 < R2 < 0.8) (Figure 2). For the phosphorus correlation with dry weight, the Bray-1 extraction method showed a positive slope and the highest closeness relationship to the relative dry weight of the tomato plants (r = 0.88) (Table 2). Different P extraction methods will produce different estimates. However, the Bray-1 method is most suitable for use on acidic soil (Yang & Post, 2011). Research conducted by de Matos et al. (2023) found that the Bray-1 method had high sensitivity for determining P in soil. On the other hand, research conducted by Lumbanraja et al. (2017) had different findings, where Mehlich-1 was the best phosphorus extraction method in soil. This difference may occur due to the differences in the procedures carried out by laboratory assistants, even though they used standard procedures such as Bray-1 or Mehlich-3 (Boem et al., 2011). Based on the values of r and R2, the largest to the most negligible relationship is Bray-1 > Mehlich-1 > Ammonium acetate > Morgan-Wolf > HCl-25%. The Bray-1 linear equation, Y = 0.295x + 20.53, shows a better level of accuracy compared to the other extraction methods (MRE = 0.10; RMSE = 4.44).
Figure 2
Linear correlation between phosphorus-soil extraction methods and relative biomass dry weight (DWB) of tomato in Andisols. (A) Mehlich-1; (B) Bray-1; (C) Morgan-Wolf; (D) Ammonium acetate; (E) HCl-25%.
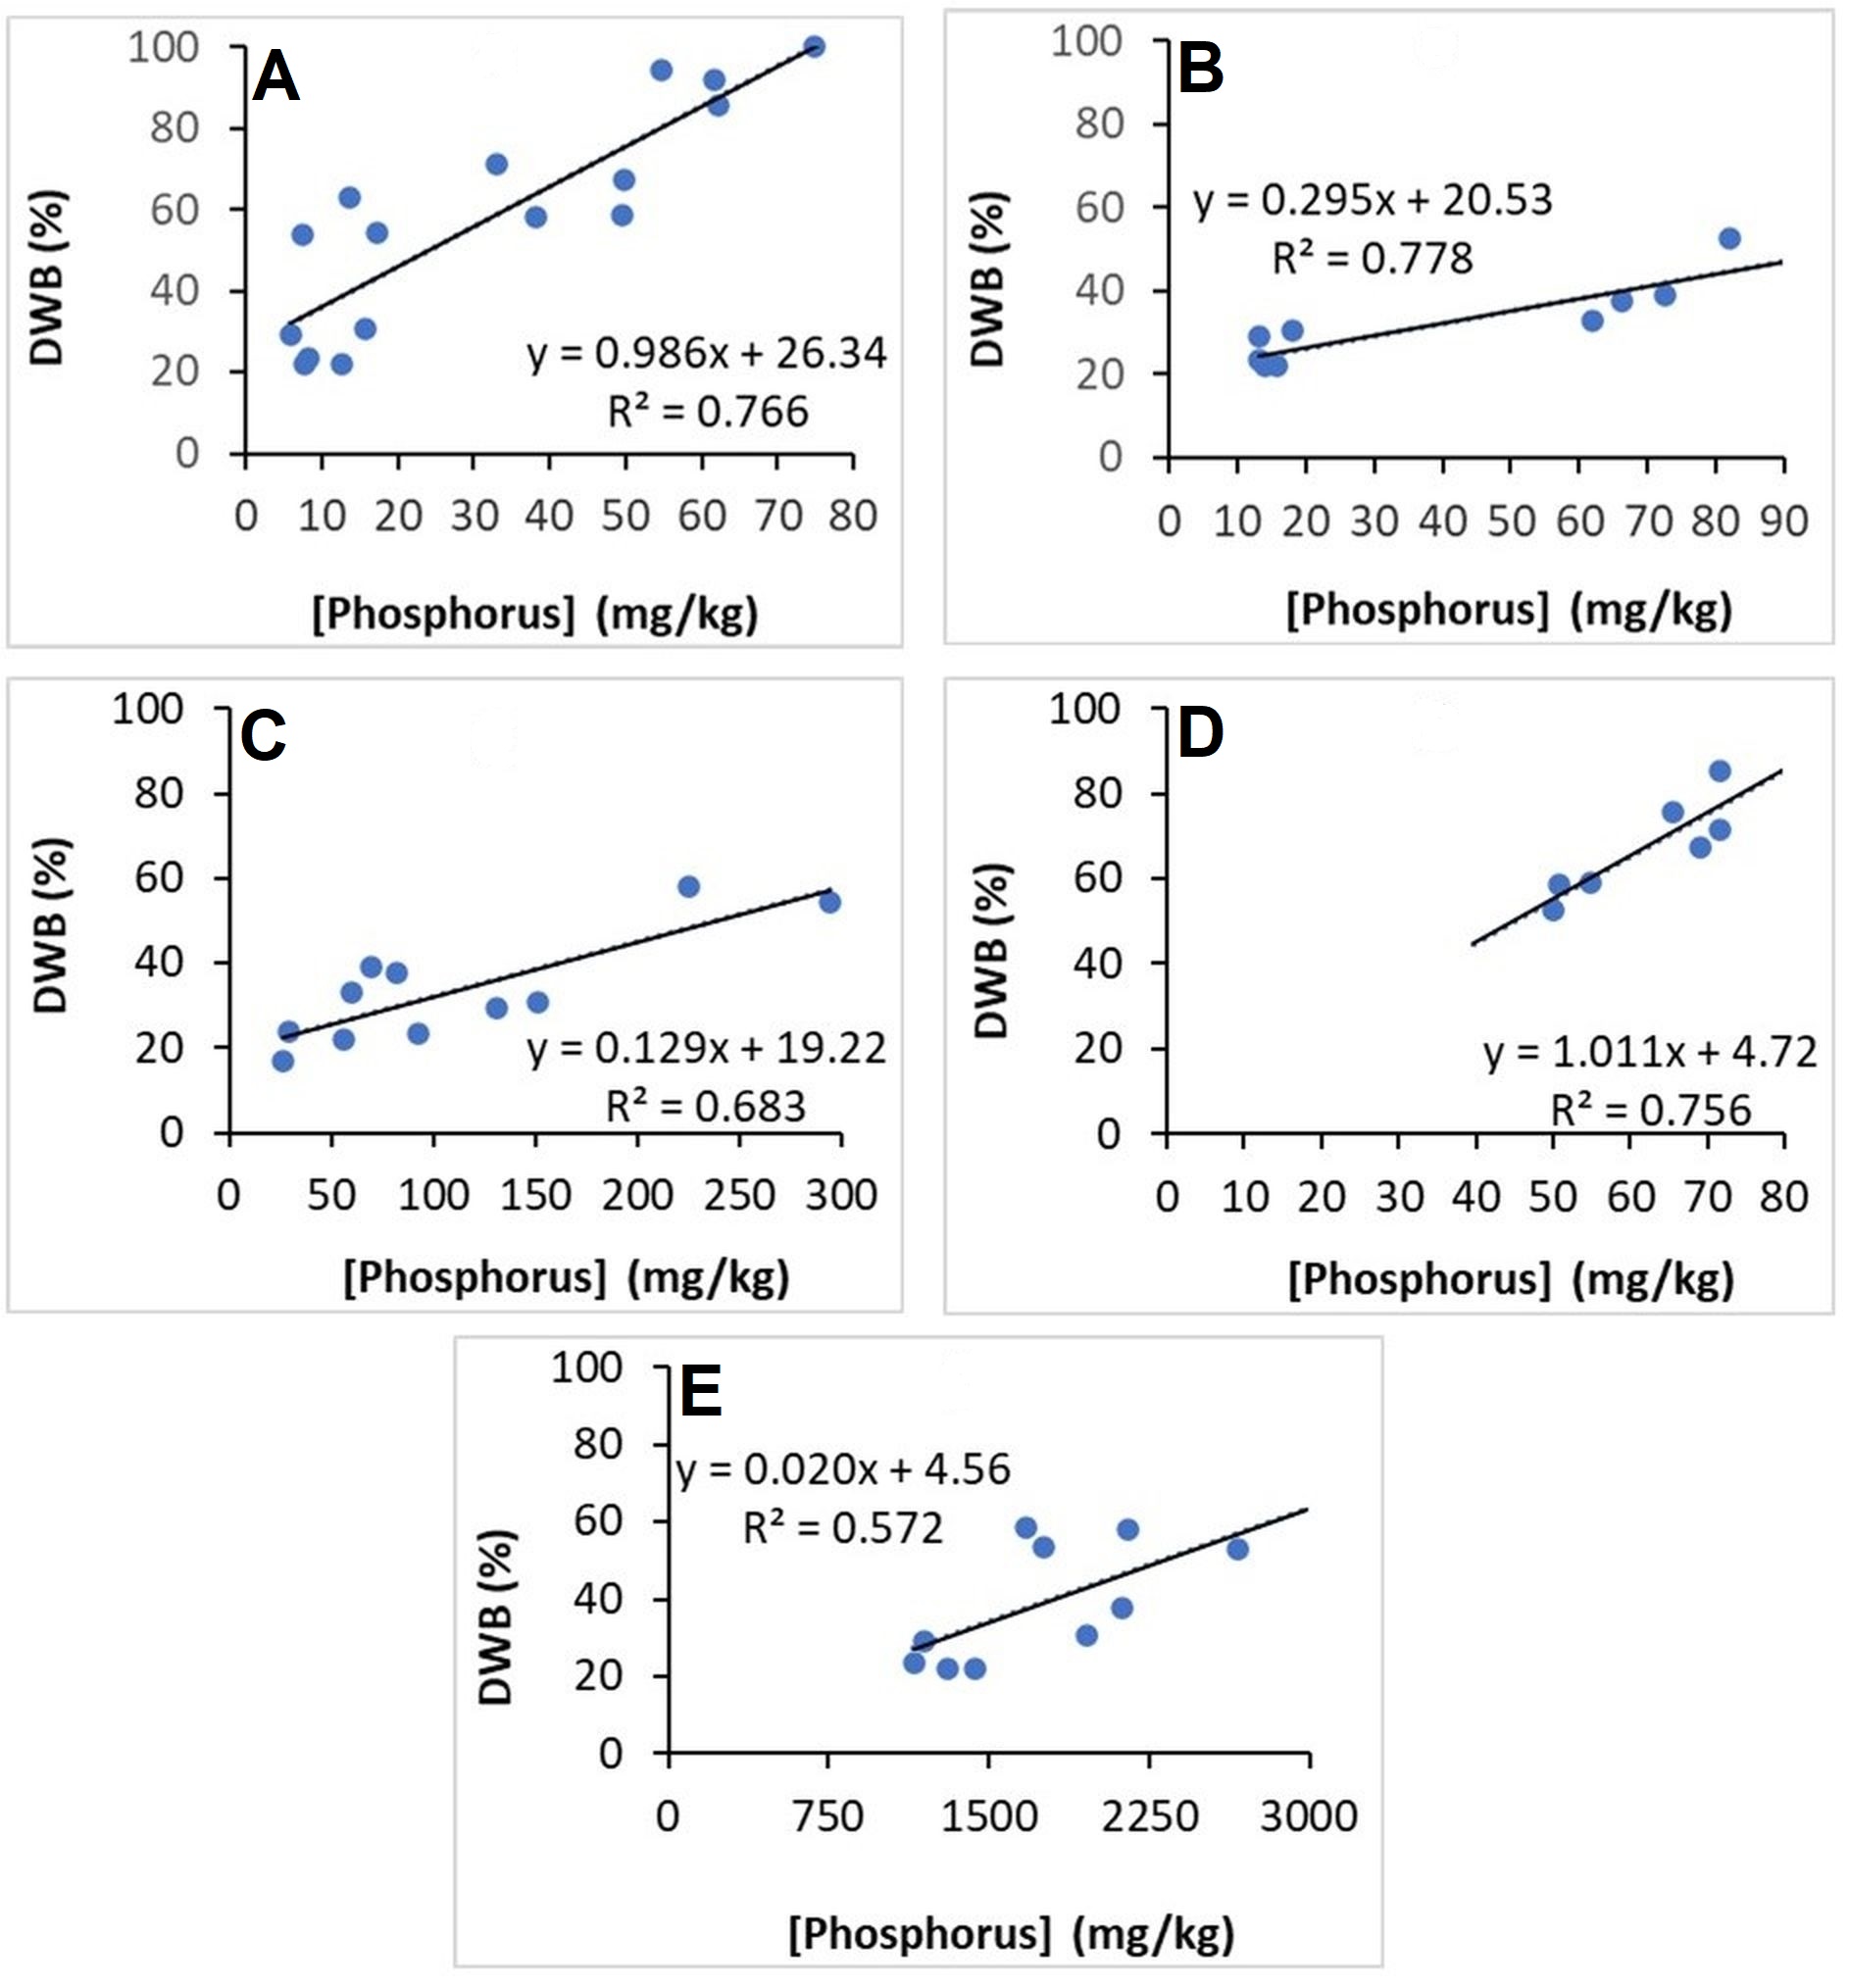
Table 2
Relationship between the Phosphorus-Andisols extraction methods and the relative dry weight of tomato plants determined using the Linear Regression Equation.
In the potassium-correlation test, the HCl-25% extraction method showed a positive slope and the highest closeness relationship to the relative dry weight of tomato plants (0.5 < R2 < 0.8) (Figure 3). The HCl-25% method had the highest correlation coefficient value (r = 0.90) (Table 3). Moritsuka et al. (2003) found that the HCl extraction method was the most suitable method for determining available K levels in soil. This research also found a positive correlation between the HCl extraction method and the amount of K absorbed by plants. This is in contrast to the findings reported by Gunawan et al. (2019), who explained that the best K extraction method in Andisols-Cianjur is Ammonium acetate, with a correlation value (r) of 0.75. Based on the value of r and R2, the strength of this relationship from highest to lowest was HCl-25% > Bray-1 > Morgan-Wolf > Ammonium acetate > Mehlich-1. The HCl-25% linear regression equation, Y = 0.023x + 36.46, was yielded smaller values than in the other extraction methods (MRE = 0.05; RMSE = 2.95). The smallest MRE and RMSE values suggest that the Bray-1 and HCl-25% linear regression equation was precise.
Figure 3
Linear correlation between potassium-soil extraction methods and relative biomass dry weight (DWB) of tomatos grown in Andisols. (A) Mehlich-1; (B) Bray-1; (C) Morgan-Wolf; (D) Ammonium acetate; (E) HCl-25%.
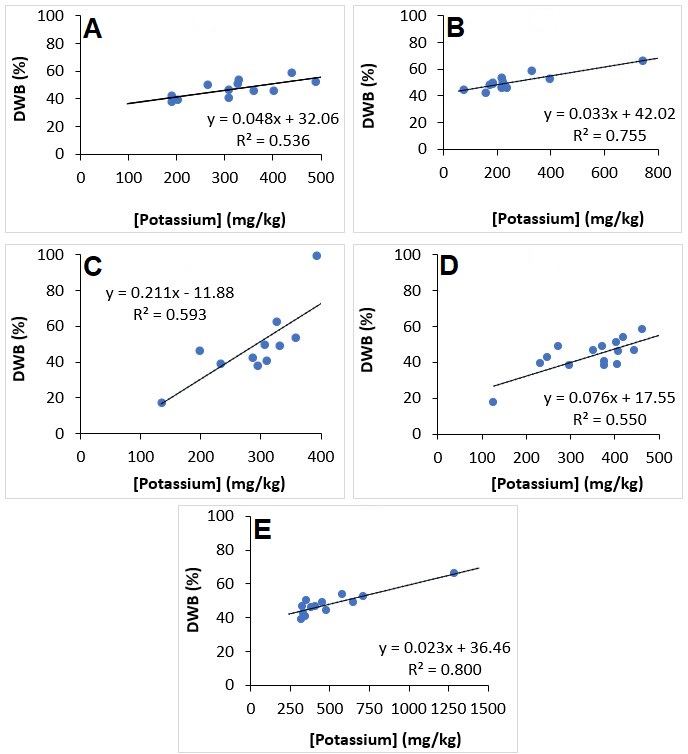
Table 3
Relationship between the Potassium-Andisols extraction methods and the relative dry weight of tomato plants determined using the Linear Regression Model.
In the regression equation model, it can be seen that there is a negative intercept on the phosphorus and potassium correlation. This shows that the range of values of the independent variable (the value of the extraction method) does not include zero as one of the observed values, but the range value is outside the data (extrapolation). Therefore, the intercept value cannot be interpreted. Only when x = 0 is within the range of the extraction method values in the sample and is a practical value, will it have a meaningful interpretation (Mendenhall & Sincich, 1996). The five phosphorus and potassium extraction methods responded differently to the relative dry weight of the tomato in Andisols. A different relationship was obtained when correlated with the relative dry weight of the tomato collected from each of the respective treatments.
The result shows that each of the phosphorus and potassium extraction methods work specifically and differently. Based on the value of r, R2, MRE, and RMSE, it can be concluded that the best phosphorus and potassium extraction methods in Andisols-Garut, Indonesia for tomato cultivation were Bray-1 and HCl-25%. This is caused by the ability of the different solutions in each extraction method to extract phosphorus and potassium (Table 4). In addition, the pH of the constituent solutions also reacts differently to Andisols. These two things are the main factors for the differences in the availability of phosphorus and potassium in each extraction method (Carter & Gregorich, 2008).
Table 4
Compounding solution for the soil phosphorus and potassium extraction methods.
| No. | Soil extraction methods | Solutiona | pH |
|---|---|---|---|
| 1 | Mehlich-1 | 0.0125 M H2SO4 + 0.05 M HCl | 2.5 |
| 2 | Bray-1 | 0.025 M HCl + 0.03 N NH4F | 2.6 |
| 3 | Morgan-Wolf | 0.72 M NaOAc + 0.52 M CH3COOH | 4.8 |
| 4 | Ammonium acetate | 1 M NH4OAc | 7.0 |
| 5 | HCl-25% | HCl (37%) | 1.0 |
The correlation test was first carried out to find out which phosphorus and potassium extraction method produced a high correlation between extracted available phosphorus and potassium influencing tomato plant growth, which was represented by the weight of relatively dry tomato plants. The high value of the correlation coefficient indicates that the extraction method can extract available phosphorus and potassium more accurately so that plants can absorb these nutrients. Based on Schober et al. (2018), there are five categories of the correlation value: negligible correlation (0.00–0.10), weak correlation (0.10–0.39), moderate correlation (0.40–0.69), strong correlation (0.70–0.89), and very strong correlation (0.90–1.00). The nutrients absorbed and utilized in the process of plant metabolism can be seen in the relative value of the biomass dry weight.
. Conclusion
This research shows that the five phosphorus and potassium-soil extraction methods responded differently to the relative dry weight of tomatoes grown in Andisols-Garut, Indonesia. Therefore, it is necessary to determine the best phosphorus and potassium extraction method to determine the accurate available phosphorus and potassium values in the soil. Bray-1 and HCl-25% were the best phosphorus and potassium extraction methods for tomato planting in Andisols-Garut, Indonesia.
