. Introduction
Drought and salt stress are among the most damaging abiotic stressors causing a significant reduction in crop productivity. In the northeast of Thailand, drought and salinity were the most harmful stresses leading to a reduction in crop productivity at a level around 1800 metric tons or 2.7% of global crop production (Khadka et al., 2021). Over the past 60 years, drought induced by unpredictable rainfalls was reported as the major cause of crop yield loss in the northeast region of Thailand, and the problem tended to intensify further due to climate change (Zhao et al., 2022). Moreover, approximately 50% of agricultural land in this region is classified as salt-affected due to the presence of underground rock salts. Soil salinity in this region was estimated to cause around 34.18% reduction in crop productivity (Khotchanalekha et al., 2020; Li et al., 2020).
Drought stress causes major damage to plant growth, including loss of cultivated production from water resource limitations in arid and semi-arid areas (Li-Ping et al., 2006; Phansak et al., 2021). Water deficit from drought condition results in a reduction in leaf turgor and water potential, which subsequently leads to damage to membrane integrity, chlorophyll contents, water relations, osmotic adjustment, and photosynthetic activity in field crops (Farooq et al., 2009; Parveen et al., 2019; Taratima et al., 2021). Salt stress is a plant-challenging high saline condition in soil inducing (i) osmotic stress leading to reduction in the water absorption rate and stomatal closure, (ii) ion toxicity stress resulting in disruption of the equilibrium of the sodium–potassium ratio due to exceeded sodium uptake, and (iii) oxidative stress resulting in degradation of macromolecules and metabolic disturbance (Ahmad et al., 2019; Z. Ahmad et al., 2021). These stresses strongly inhibit growth and development in plants, which has led to increased commercial productivity loss issues for many years in Thailand (Li et al., 2010; Ye et al., 2012).
Exogenous application of some plant growth regulators or chemical elements is used widely to improve plant growth and reduce harmful damage resulting from several stress conditions (Avestan et al., 2019). Silicon (Si) is a beneficial element. Previous studies reported its efficiency in increasing stress resistance, developing yield quantity, and adjusting physiological processes in plants (Chaiwong & Prom-u-thai, 2022; de Oliveira et al., 2019; Liu et al., 2019). Si was also found to mitigate drought and salt-induced injury by increasing defensive mechanisms such as stem thickening, recovery of damaged photosynthetic apparatus, and alleviation of oxidative stress through antioxidant activation (Das et al., 2022; Liu et al., 2019).
Water deficit is the main detrimental consequence to plants under drought and salt stress, disturbing stomatal regulation and leading to an increase in plant temperature (Ballester et al., 2013). Thermography is a non-destructive technique that can be adapted to detect interactions among plant mechanisms and the environment by capturing the infrared picture (Costa et al., 2013; Pipatsitee et al., 2018). Temperature calculated from the infrared image can be used to assess physiological changes in a short period. Exposure to and absorption of solar energy lead to high canopy temperature; it can be reduced by high leaf evaporation or transpiration, which was correlated with stomatal conductance (Jones, 2004; Pradawet et al., 2022). The crop water stress index (CWSI) is a significant monitoring indicator calculated from temperature to ascribe the way correlating with physiological changes and predict yield quantity (Pradawet et al., 2022). Remarkably, plant temperature based on the thermal image can evaluate changing physiological and biological parameters in drought and salinity conditions (Ali, 2015; Pineda et al., 2020).
Although the alleviation of several stresses by Si has widely been reported, the level of exogenous Si which shows the most effective alleviation from drought and salinity stresses assessed with a thermal imaging technique has been scarcely described. Hence, the purposes of this study are to investigate the proper Si level to retrieve stress damage disclosing physiological, biochemical, growth, and photosynthetic correlates with stress-effected temperature by thermography under salt and drought stresses with or without exogenous Si applications.
. Materials and methods
. Plant materials and growth conditions
KDML105, the well-known but moderately salt sensitive rice cultivar, was used in this study. The rice seeds were surface sterilized with 5% sodium hypochlorite for 15 minutes. They were soaked for 2 days with sterile distilled water before germinating in sterile petri dishes. Homogenous and healthy seedlings were moved to a plastic bucket with a polystyrene foam sheet as a hydroponic system. They were maintained in a greenhouse at the Department of Biology, Faculty of Science, Khon Kaen University from 17 January to 19 February 2022. The average air temperature, photosynthetically active radiation, and relative humidity were 24.92 ± 2.15 °C, 305.58 ± 79.56 µM m−2 s−1, and 77.01 ± 2.15%, respectively. The experiment was carried out in a factorial completely randomized design with five replications. Rice seedlings were grown in each bucket containing 2 L of tap water, half-strength, and full-strength Yoshida nutrient solution (Yoshida et al., 1976) for 4, 8, and 9 days, respectively until they were 21 days old. The pH of Yoshida nutrient solution was adjusted to 5.5 using sulfuric acid (H2SO4) and sodium hydroxide (NaOH).
Then, the rice plants were subjected to various treatments, including (i) control (absence of drought or salt stress) + 0 mM Si, (ii) control + 1.5 mM Si, (iii) control + 2.0 mM Si, (iv) control + 2.5 mM Si, (v) drought + 0 mM Si, (vi) drought + 1.5 mM Si, (vii) drought + 2.0 mM Si, (viii) drought + 2.5 mM Si, (ix) salinity + 0 mM Si, (x) salinity + 1.5 mM Si, (xi) salinity + 2.0 mM Si, and (xii) salinity + 2.5 mM Si. The drought, salinity, and silicon treatments were created by adding 20% W/W polyethylene glycol (PEG) 6000, 120 mM sodium chloride (NaCl), and various levels (1.5, 2.0, and 2.5 mM) of sodium metasilicate (Na2SiO3). The hydroponic solution with 1.5, 2.0, and 2.5 mM Na2SiO3 contained approximately 0.15, 0.20, and 0.25 gL−1 of plant-available absorbed form [silicic acid (H4SiO4)], respectively.
The physiological and growth parameters were measured, and the thermal images were captured 7 days after treating all conditions or when the plants showed some signs of stress such as leaf rolling or lower leaf dying.
. Measurements
. Growth parameters
Shoots and roots of three rice plants selected from each replication were weighed for recording shoot fresh weight (SFW) and root fresh weight (RFW), respectively. The samples were oven-dried at 80 °C for 72 hours in a hot air oven. Shoot dry weight (SDW) and root fresh weight (RDW) of these samples were subsequently measured using analytical balances (Mettler Toledo, Columbus, OH, USA). Shoot length (SL) and root length (RL) were measured using ImageJ software (National Institutes of Health, USA).
. Leaf gas exchange measurement
The photosynthetic parameters such as the net photosynthetic rate (PN), transpiration rate (E), and stomatal conductance (gs) of the first fully expanded leaf of three rice plants selected from each replication were measured during 11.00 am–01.00 pm using an LI-6400XT portable photosynthesis system (Li-Cor Inc., Lincoln, NE, USA). All measurements were taken at 1,200 µmol photons m−2 s−1 photosynthetic photon flux density, 400 ppm CO2, and 25 ± 2 °C. In addition, water use efficiency (WUE) was calculated following the formula according to Ma et al. (2004):
. SPAD measurement
The greenness of rice leaves (SPAD value) was assessed using a SPAD-502 chlorophyll meter (Spectrum Technologies Inc., USA) in the first fully expanded leaf of three rice plants randomly selected from each replication. In each plant, SPAD values were measured at the basal, middle, and apical parts of the leaf (Can et al., 2021).
. Relative water content (RWC)
In each treatment, 10 mid-leaf sections with 2 cm length each were cut and immediately weighed using an analytical balance for fresh weight (FW) measurement. The leaf sample was then submerged in a plastic petri dish containing deionized water for 8 hours; after that, it was taken out, put in a microtube, and weighed immediately to obtain turgid weight (TW). Subsequently, the leaf sample was oven-dried at 70-80 °C for 48 hours and weighed for dry weight (DW) measurement. This method was adapted from Siddiqui et al. (2014). RWC was calculated using the following formula according to Siddiqui et al. (2014):
. Membrane injury (MI)
Approximately 0.1 g of rice leaves were cut and washed with deionized water to remove surface-adhered electrolytes and lightly swabbed. Subsequently, the sample was immersed in 10 mL of deionized water in 15 mL conical centrifuge tubes at room temperature (20–25 °C) for 24 hours. The electrical conductivity of the effusion was measured using an electrical conductivity meter (PL-700C, Gondo, GonDo EzDo, Taipei, Taiwan) and considered as EC1. Subsequently, the leaf tissue sample was incubated at 100 °C in water bath for 25 minutes and cooled to room temperature. The electrical conductivity of the effusion was measured again (EC2). Membrane injury from electrolyte leakage was calculated following Zhang et al. (2017).
. Malondialdehyde (MDA) content
The amount of MDA was quantified with the thiobarbituric acid reactive substances (TBARS) assay. 0.1 g of shoot samples were homogenized in 1 mL of 0.1% trichloroacetic acid (TCA) and centrifuged at 15,000 rpm at 4 °C for 10 minutes. 0.5 mL of the supernatant was mixed with 1.5 mL of 0.5% thiobarbituric acid (TBA) dissolved in 20% TCA. Then, the mixture was incubated in 95 °C water bath for 25 minutes and cooled in an ice bucket. Subsequently, the MDA content was determined by measuring the absorbance of the supernatant in a UV–VIS spectrophotometer (Spectrocord 200 plus, Analytik Jena, Analytik Jena GmbH, Jena, Germany) at 532 and 600 nm. The method was adapted from Heath and Packer (1968). The MDA content was calculated using the following formula (Heath & Packer, 1968):
where 155 is the extinction coefficient (mM−1 cm−1) at 532 nm.
. Na+, K+, and Si content
The oven-dried shoot sample in each replication was ground into powder using a mortar and pestle. Then, approximately 2 g of the powder was subjected to nitric perchloric digestion. The Na+ and K+ concentrations were quantified using an Analytik-Jena ContrAA 800 atomic absorption spectrophotometer (Analytik Jena GmbH, Jena, Germany) (Hesse, 1972). Additionally, 50 mg of the powdered sample was digested by autoclave-induced sodium hydroxide digestion (Elliott & Snyder, 1991). The Si content was measured by inductively coupled plasma optical emission spectrometry (ICP-OES) using an Analytik-Jena PQ 9000 ICP-OES analyzer (Analytik Jena GmbH, Jena, Germany) at the Department of Agronomy, Faculty of Agriculture, Khon Kaen University.
. Infrared thermal imaging
Plant temperatures were observed when the rice plants showed some signs of stress using a FLIR C2 thermal camera (Teledyne FLIR LLC, OR, USA) from 9.00 am to 11.00 am. The distance for taking the thermal image was approximately 1 m from the thermal camera to the rice plants. The dry and wet references were used in this experiment for ratifying temperature from different circumstances. The dry reference was a cloth with a stick representative as leaves with fully closed stomata and the wet reference was that stick sprayed with water to create a moisture surface representative as leaves with fully opened stomata; these principles were adapted from Takashima et al. (2021). Canopy temperature (Tcanopy), wet reference temperature (Twet), and dry reference temperature (Tdry) were exhibited as line-shown average temperatures selected from three lines of each thermal image using FLIR Tools software (Siddiqui et al., 2014). The emissivity value and reflected temperature were set at 0.95 and 20 °C, respectively.
The crop water stress index (CWSI) was calculated by the following equations (Costa et al., 2013):
. Statistical analysis
Data were analyzed by analysis of variance (ANOVA). Multiple mean comparison was performed using the least significant difference (LSD) in Statistix 10 software (Analytical Software, FL, USA). Principle component analysis (PCA) was conducted on 16 and 17 parameters in the drought and salt conditions, respectively, using R (R Foundation, New Zealand) with “FactoMineR” package. The PCA biplot was constructed using the “factoextra” and “ggplot2” packages.
. Results
. KDML105 rice growth
In all concentrations of the Si-applied control condition, the SFW, SDW, RFW, and SL parameters of the rice plants were significantly enhanced. Another important result was that 2.0–2.5 mM Si also significantly improved RDW and RL, producing an approximately six-fold increase in RDW and a 30% increase in RL (Table 1). The shoot growth was significantly retarded by the drought conditions. The amelioration of the drought stress-reduced SFW was provided by adding 2.0 mM Si. RFW and RDW showed a slightly reducing trend in the stressful conditions compared with the control group. Si slightly improved RFW in the drought and salt stress conditions. The addition of 2.5 mM Si in the salinity condition increased RDW significantly. Si seemed to improve SL and RL in the stress conditions. However, a significant effect was observed only in SL of plants treated with 1.5 or 2.0 mM Si under salt stress (Table 1).
Table 1
Shoot fresh weight (SFW), shoot dry weight (SDW), root fresh weight (RFW), root dry weight (RDW), shoot length (SL), and root length (RL) in KDML105 rice plants exposed to drought and salinity conditions with various silicon levels.
. Physiological parameters
The salinity stress significantly increased EL and MDA content in the rice plants. Si considerably decreased EL of KDML 105 under salinity. Si at 2.5 mM significantly reduced EL by half under salt stress. Since drought stress had no significant impacts on EL and MDA content in this study, we could not observe any amelioration of drought by Si. The RWC significantly declined (approximately by 8%) in the rice plants exposed to both stressful situations, compared with the highest RWC of 95.30% in the control group. The Si application at 2.0 and 2.5 mM significantly improved the water status reaching around 92% in rice exposed to salt stress, while the RWC under drought was significantly retrieved at 1.5–2.5 mM Si (i.e., increased by around 5%) (Table 2).
Table 2
Effects of different silicon concentrations on electrolyte leakage (EL), malondialdehyde (MDA) content, and relative content (RWC) in KDML105 rice plants in drought and salinity conditions.
The effects of Si on SPAD values varied with growth conditions. For the non-stressed plants, the supplementation with 2.5 mM Si resulted in a significant reduction in SPAD, while no significant changes were observed in the drought condition. Under salinity, only 1.5 mM Si significantly enhanced leaf greenness. The gs and E values significantly declined by approximately 10 times under salinity. PN presented a reducing trend in both stressful treatments, compared with the control without Si. However, the salinity-exposed rice plants were positively influenced by the Si applications. A significant surge of PN, gs, and E were exhibited in the 2.0 mM exogenous Si-supplemented rice plants. PN, gs, E, and WUE were not changed under drought with or without Si. The result demonstrated the increment of WUE in rice plants under salt and drought stresses. Reduced WUE was observed in the saline rice plants supplemented with 2.0 mM Si, while the drought Si-supplemented groups tended to have higher WUE (Table 3).
Table 3
Mean comparison of the net photosynthesis rate (PN), stomatal conductance (gs), transpiration rate (E), SPAD reading, and water use efficiency (WUE) of KDML 105 rice plants under drought and salinity conditions.
The proportion of Na+ and K+ was altered, significantly increasing 36 times in the salinity conditions. The Si application slightly reduced the Na+ to K+ ratio in the salinity group. The amount of Si in the rice plants increased with the increasing exogenous Si concentrations in all conditions. The drought- and salt-stressed rice plants accumulated greater amounts of Si in the shoots than those in the control group (Table 4).
Table 4
Na+ to K+ ratio and Si content in KDML 105 rice plants. The Na+ to K+ ratio was quantified in non-stressed and salt-stressed rice plants, while the Si content was analyzed in rice plants in all treatments.
. Seeding temperature
Drought and salinity increased the canopy temperature of the rice plants (Figure 1, Table 5). The canopy temperatures were slightly altered among the Si concentrations. The temperature difference (ΔT) disclosed non-similar alleviated patterns under both stresses, obviously decreasing in the salt variant supplemented with 2.0–2.5 mM Si. However, the decrease was not revealed to have a significant difference (Table 5).
Figure 1
FLIR C2 thermal images of rice plants subjected to 0, 1.5, 2.0, and 2.5 mM Si under (A) control, (B) drought, and (C) salinity conditions.
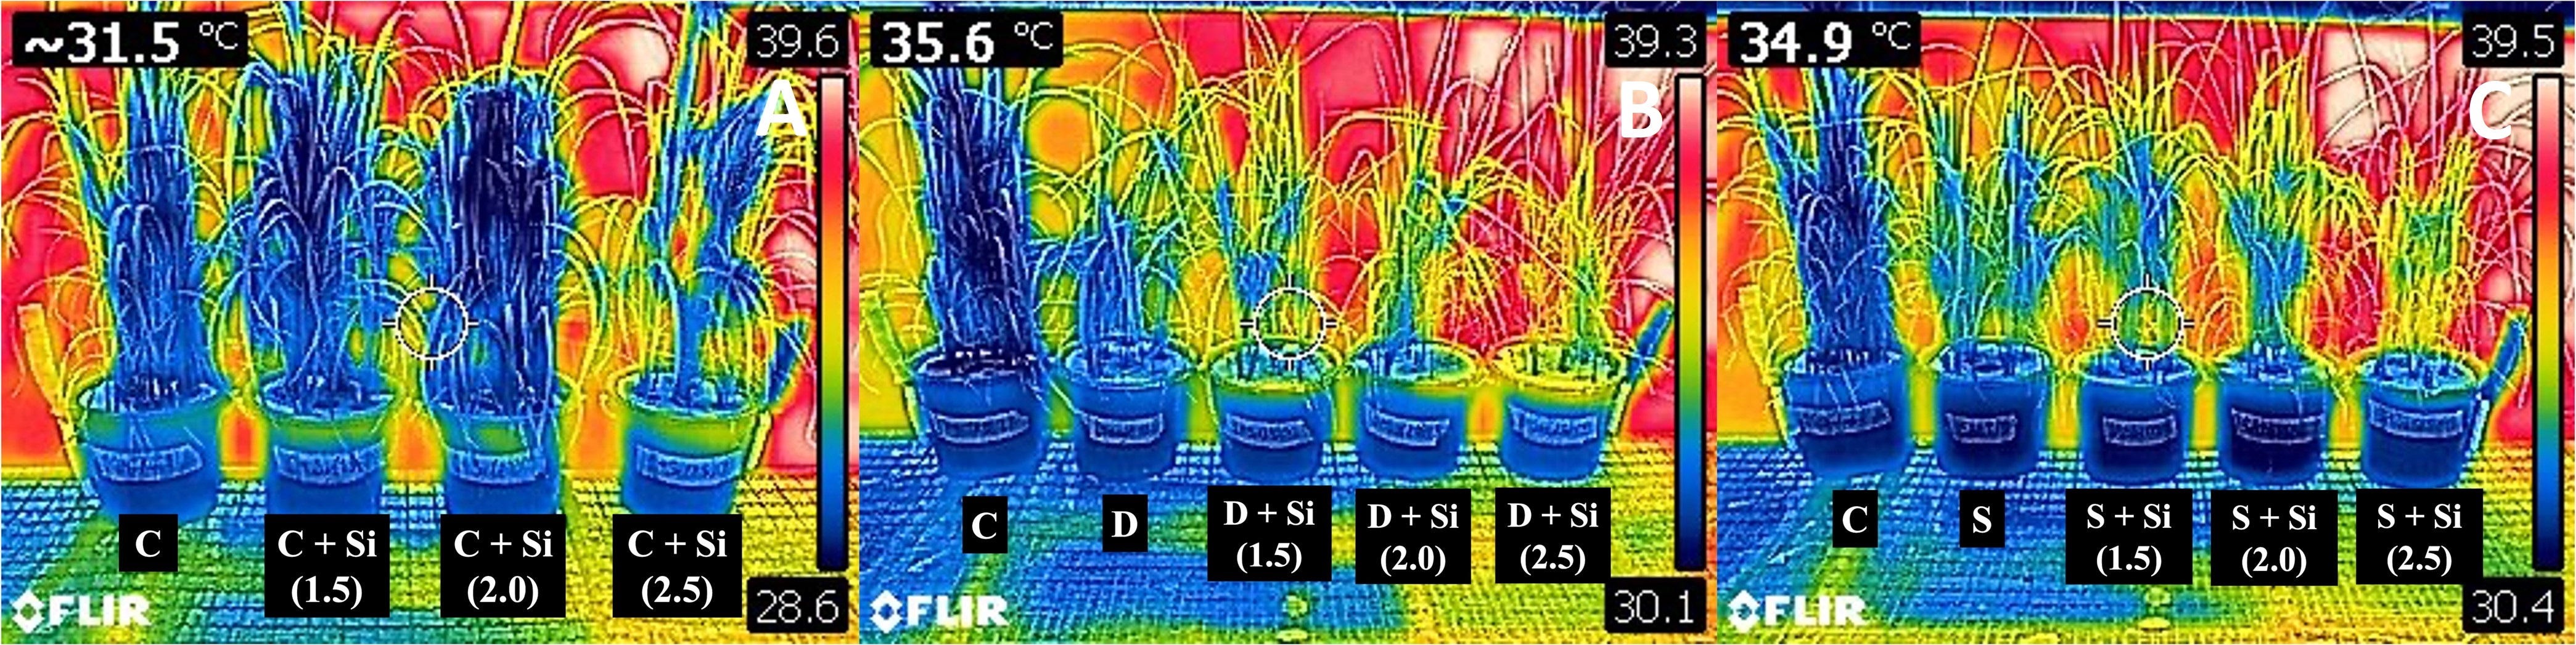
Table 5
Effect of silicon on the temperature of KDML 105 rice plants under drought and salinity conditions.
| Si concentration | Condition | |||||
|---|---|---|---|---|---|---|
| Control | Drought | Salinity | ||||
| T (°C) | ΔT (°C)* | T (°C) | ΔT (°C) | T (°C) | ΔT (°C) | |
| 0 mM | 30.77 | - | 31.58 | - | 33.61 | - |
| 1.5 mM | 30.19 | −0.59 AB a | 33.67 | 0.11 A a | 33.77 | 0.16 A a |
| 2.0 mM | 29.81 | −0.97 B a | 33.78 | 0.16 A a | 33.24 | −0.37 A a |
| 2.5 mM | 31.18 | 0.41 A a | 33.83 | 1.11 A a | 33.51 | −0.10 A a |
. Principal component analysis (PCA)
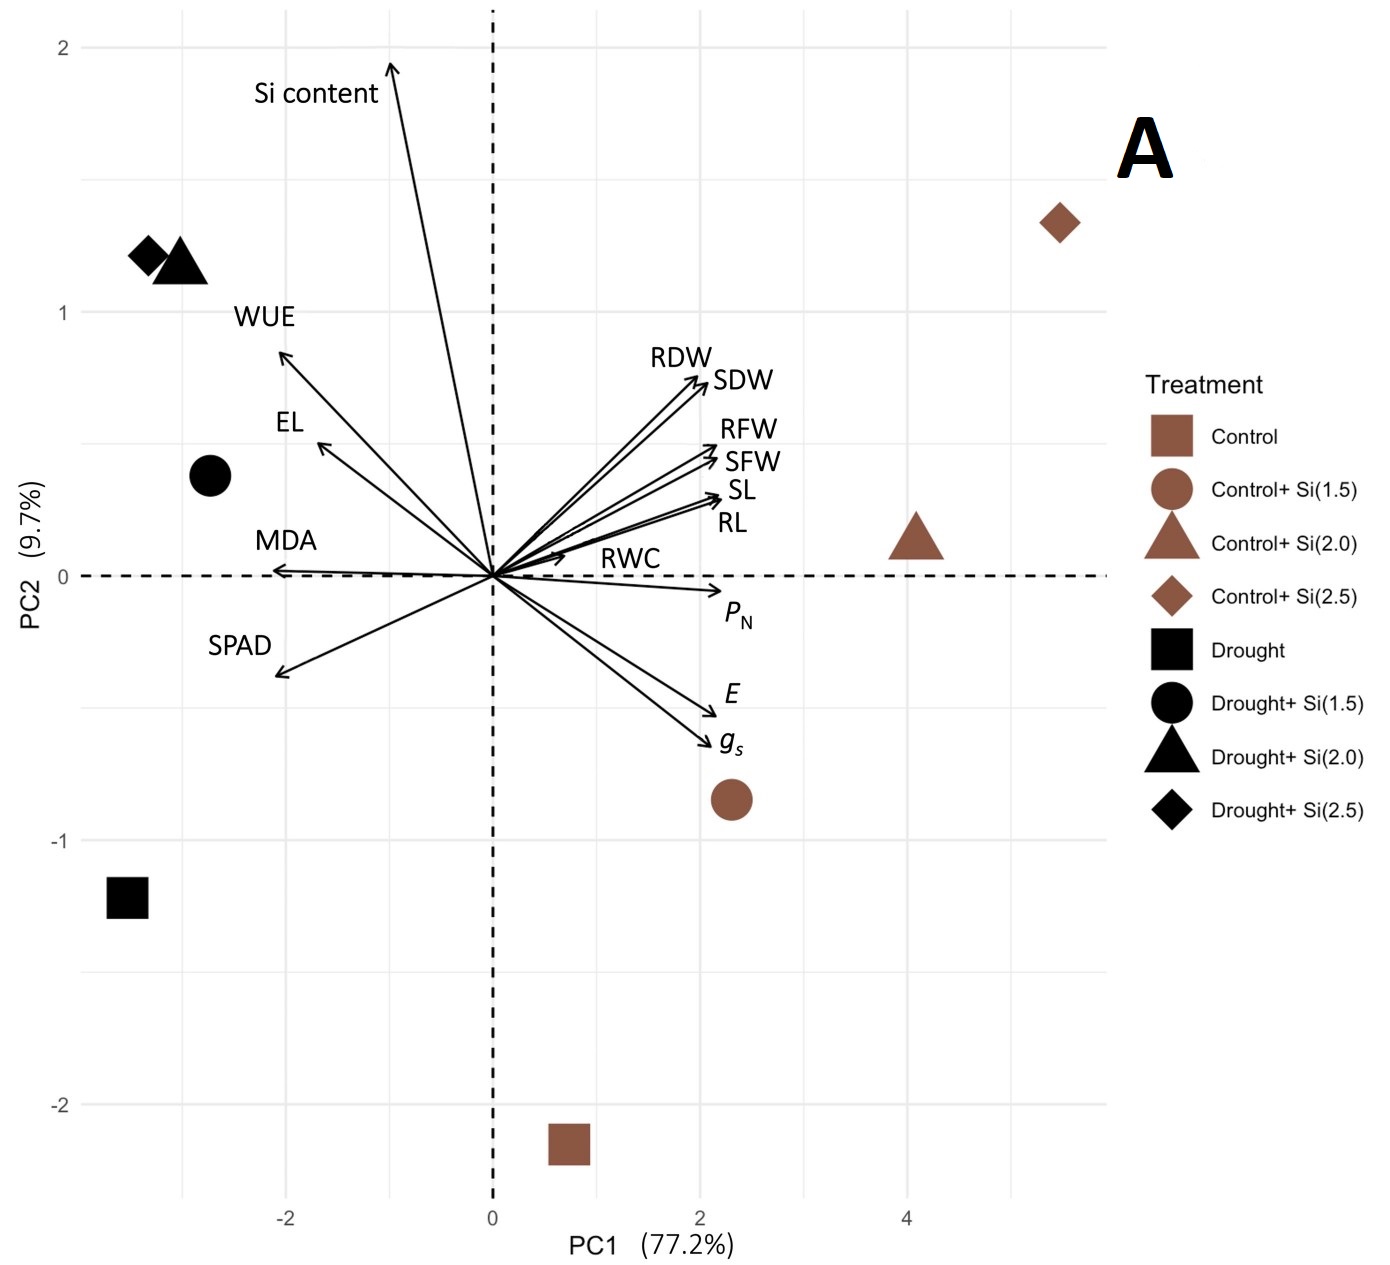
To minimize the dimensionality of the data and discover potential relationships among the observed features in the control and stressful conditions, 16 growth and physiological variables were subjected to PCA. The Na+ to K+ ratio was included in the analysis for the salinity experiment. In the control and drought conditions, the first three principal components (PC) with eigenvalues greater than one represented 96.08% of the total variations. The selected PC1 and PC2 explained 77.2% and 9.7% of the overall trait variability, respectively (Figure 2A). RL, PN, and SL were the top three highest-contributing parameters in PC1 (Figure 2B), whereas the Si content, WUE, and RDW were associated with PC2 (Figure 2C). According to the PCA biplot shown in Figure 3A, a separation between the control and drought groups was observed. In the non-stressed condition, the Si treatments were clearly separated from the non-Si treatment. However, no clear separation between the non-Si and Si treatments along PC1 was observed.
Figure 2
Scree plots showing the variance proportion (%) of the first seven principal components from PCA biplots based on control and (A) drought or (D) salt stress datasets. The top 10 measured variables that contributed to PC1 (B and E) and PC2 (C and F) in the control and drought (B and C) or salt stress (E and F) conditions. The important contributing variables are marked with the referent red dashed line.
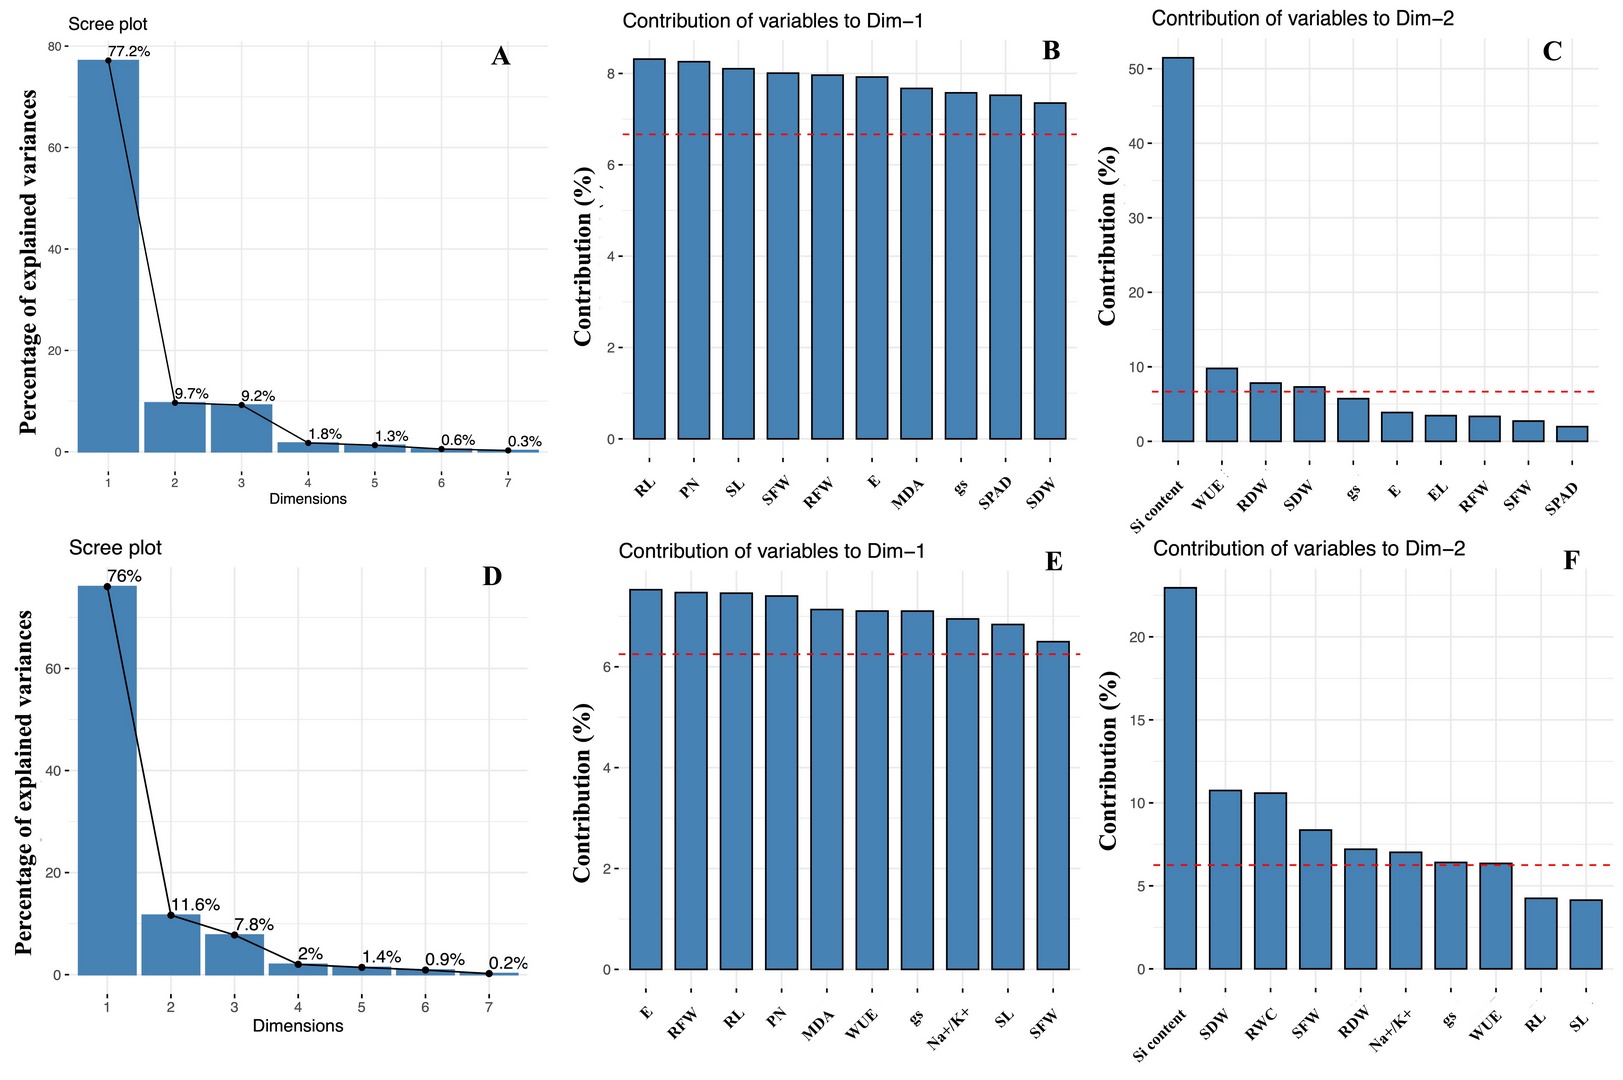
Figure 3
PCA biplots derived from the variance of 16 or 17 growth, physiological, and biochemical traits of KDML105 rice plant in the control and (A) drought or (B) salinity conditions, respectively. Arrows indicate the powerful strength of the trait impact on the first two components in the plot.
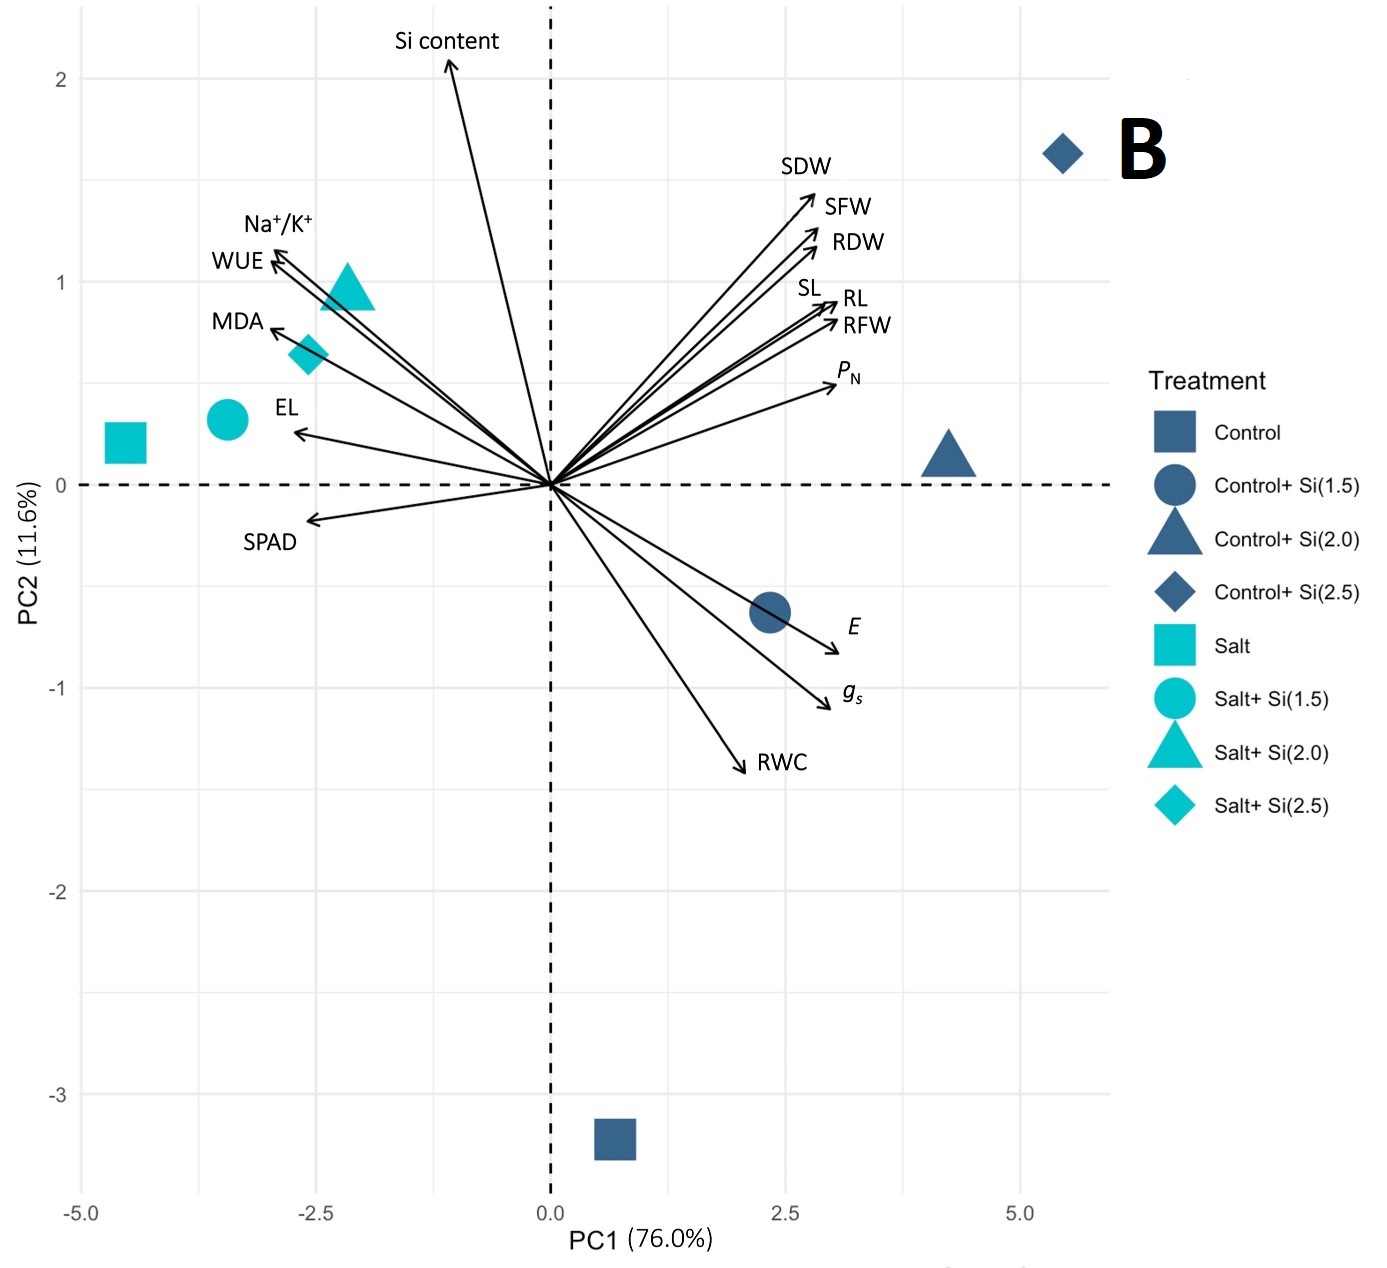
The PCA results of the control and salinity conditions showed that the first three PCs with eigenvalues larger than one accounted for 95.45% of the total variations (Figure 2D). The PC1 and PC2 were expressed at 76.0% and 11.6%, respectively, and were selectively used in the PCA biplot. The top three highest-contributing traits in PC1 were represented by E, RFW, and RL, whereas PC2 demonstrated the Si content, SDW, and RWC (Figure 2E and 2F). A clear separation between the control and salinity groups is shown in Figure 3B. Various Si-treated groups were separated from the non-Si-treated groups. In addition, the Si-applied salt groups showed a trend to be close to all the Si-control groups, exhibiting a clearer positive Si influence on the reduction of the harmful salt stress effects than drought (Figure 3B).
. Discussion
In general, Si is presented as a beneficial element stimulating plant growth. Rice highly accumulates silicon up to 10% of shoot dry weight. Deposition of Si in rice shoots improves plant structural strength and light interception by keeping the erectness of leaves and preventing lodging (Ma et al., 2002). Similar to a recent study, we found that all growth parameters of the rice plants in the control condition were enhanced by the Si application. The results are in agreement with Zaimenko et al. (2018), who reported that silicon-mixed fertilizers stimulated corn seedling growth.
Drought and salt stress have a synergistic impact reducing plant growth. The severe damaging effects of drought stress are caused by insufficient water relations, while salinity powerfully stimulates plant ion imbalance (Leanasawat et al., 2021; Oraee & Tehranifar, 2022; Panfilova et al., 2021). In the current study, both stress circumstances negatively affected the growth parameters. The drought and salt stresses result in a lack of water absorption, leading to a decrease in water content and, consequently, affecting cell membrane functions as well as cell turgidity and enlargement (Farooq et al., 2019; Wei et al., 2022). Abdelaal et al. (2020) and Ahmed et al. (2021) reported that the water potential decline was caused by reducing turgor pressure and increasing osmotic pressure in roots, resulting in insufficient water supply along with interruption of ion cellular balance in salinity conditions.
The application of Na2SiO3 can improve shoot weight under drought and salt stress, particularly the best concentration which enhanced SFW was 2.0 mM Si. The capability of Si to promote plant growth in stressful conditions has been reported in rice seedlings (Yan et al., 2021). These positive effects were also described by Etesami et al. (2022). They found that Si reduced water loss by forming silica cuticle double-layers located in leaf epidermis, modifying suberin and lignin location and surging water uptake in the root. Si modified the plant structure to resist salt stress damage by producing polymer gel, which hindered high Na+ toxicity in plants (Ali et al., 2019). As reported by Zaimenko et al. (2018), collaboration between natural silicates and organic fertilizers resulted in salt stress resistance in corn seedlings by stimulating growth and up-regulating antioxidants. Moreover, Si expedites mineral accumulation, especially facilitating K+ translocation from root to shoot for counteracting excess toxic ions (Rizwan et al., 2015).
Drought and salt stresses cause water scarcity-related damage and physiological alterations in plants. Other researchers reported that various traits in rice and barley, including RWC, were negatively affected by drought and high salinity concentrations (Aslam et al., 2022; Farooq et al., 2009; Kojonna et al., 2022; Torun et al., 2022). The reduction in osmotic and turgor pressure caused by PEG and excess ions was found to lead to reduced water availability in plants (Ahmed et al., 2021; Aslam et al., 2022; Farooq et al., 2009). As shown by our results, RWC significantly decreases in rice plants treated with drought and salt stresses. Si application can obstruct water loss by adjusting plant morphology through increasing leaf thickness, up-regulating aquaporin gene expression, and reducing transpiration from various forms of Si deposition (Bhardwaj et al., 2022). RWC of bread wheat treated with 1.0–2.0 mM Si under salinity was significantly mitigated (Nadeem et al., 2022). Similarly, we found that 2.0 mM Na2SiO3 significantly ameliorated water relations in the rice leaves. In addition, all concentrations of Si significantly increased RWC in the drought-stressed rice plants in this study. This investigation was supported by results obtained by Desoky et al. (2021), who reported that exogenous 1.5 mM Si improved water status of beans in waterless fields.
Drought and salinity circumstances impair cell membrane stability resulting in ion leakage (Bijanzadeh et al., 2022; Sapre et al., 2022). Over-production of reactive oxygen species (ROS) triggered by stress results in metabolic disorders, specifically lipid peroxidation (Khan et al., 2022). Although the EL parameter was significantly increased by salt, the drought stress induced non-significant changes in the present study. Moreover, Si did not reduce the drought stress-stimulated electrolyte leakage. This result contrasted with the findings reported by Bijanzadeh et al. (2022), as the ion leakage percentage in PEG-injured maize was decreased by 1.0 mM Si solutions. This might be due to the shorter treatment time for drought-induced cell breakdown, similar to Jungklang et al. (2017), who found that EL exhibited non-significant changes in ginger plants exposed to water stress for 20 days. Conversely, the ion leakage in 2.5 mM Si-applied rice plants was significantly ameliorated under salt solutions. Somaddar et al. (2022) found that salt-tolerant and sensitive rice cultivars were positively affected from 1.0–2.0 mM Si, which hampered increasing ion leakage. Si tended to slightly reduce MDA, a bio-indicator of membrane damage, in both stresses at all concentrations. This observation was similar to that described by Xu et al. (2022), who reported that MDA contents in Si-applied maize declined in water insufficient soils. The antioxidant genes and antioxidant enzyme activities were up-regulated by Si to eliminate ROS. Si-stimulated peroxidase and catalase were able to reduce lipid peroxidation by catalyzing H2O2 destruction (Zhang et al., 2018). These former observations are in agreement with our findings. All the Si concentrations used in this experiment tended to slightly reduce the MDA contents in rice plants exposed to both stresses.
In this study, PN, gs, and E were significantly reduced under drought and salt stresses without Si application. The challenging water deficit, even resulting from drought and salinity induction, stimulates up-regulation of chlorophyllase genes and down-regulates enzymes for chlorophyll synthesis, resulting in a decrease in net photosynthesis rates (Begum et al., 2022). As reported by Larkunthod et al. (2022), salinity stress drastically influenced the photosynthesis traits of rice seedlings. Water insufficiency severely decreased the photosynthetic potential indicators in rice at the heading stage. All these pieces of evidence were supported by Challabathula et al. (2022), who observed that the leaf gas exchange characters of rice seedlings were significantly reduced under salt and drought stress. There is also a report clearly exhibiting that the net photosynthetic rate of detrimentally drought-exposed barleys significantly dwindled (Harb & Samarah, 2015).
Exogenous Si can surge chlorophyll pigments and regulate the rigidity of the leaf structure to increase light perception under abiotic stress (Singh et al., 2022). The present results showed that the activity of Si can improve PN, gs, and E in rice plants exposed to salinity; however, no amelioration was noted under drought stress. These findings are in agreement with the report by Shi et al. (2013), who elucidated the development of PN, gs, and E in rice seedlings after supplementation with exogenous Si under salinity. In this study, we found that WUE was increased in the drought and salt treatments, and no alterations in WUE were induced by exogenous Si under drought. This was caused by the intrinsically Si-improved net photosynthesis corroborated with dramatically reducing transpiration under stress. Alternatively, silicon doses of 2.0 mM significantly decreased the salt negative-stimulated WUE in this study.
Leaf temperature has been used to predict various stress symptoms in many plants (Das et al., 2021; Pradawet et al., 2022; Ramírez-Cuesta et al., 2022). Changes in this indicator were related to transpiration adjustment (Pradawet et al., 2022). Severe stress-induced signals according to decreased water relations were transferred to accelerate stomatal closure, leading to an increase in the leaf-surrounding temperature (Pineda et al., 2020). The present investigation demonstrated that the canopy temperature increased by around 10% in the non-Si drought and salt stress. The Si-supplemented rice plants exhibited a decline in the canopy temperature in the control and salinity group, especially those supplemented with 2.0 and 2.5 mM Na2SiO3. A rise in the canopy temperature has been demonstrated to be closely related to stress effects. This knowledge was supported by Pipatsitee et al. (2021), who declared that CWSI was enlarged with increasing leaf temperatures in water-less induced maize. In turn, in high salinity water, the CWSI of Euonymus japonica was significantly enhanced (Gómez-Bellot et al., 2015). Moreover, Pradawet et al. (2022) reported a powerful correlation between CWSI and stomatal efficiency in maize response to water shortage. Accumulated Si deposited in the leaf and stem epidermis of salt-stressed plants can decrease transpiration to prevent water loss and stimulate higher K+ uptake to induce stomatal activity (Avestan et al., 2019). In drought conditions, we found stable gs along with slightly increasing temperatures in rice plants.
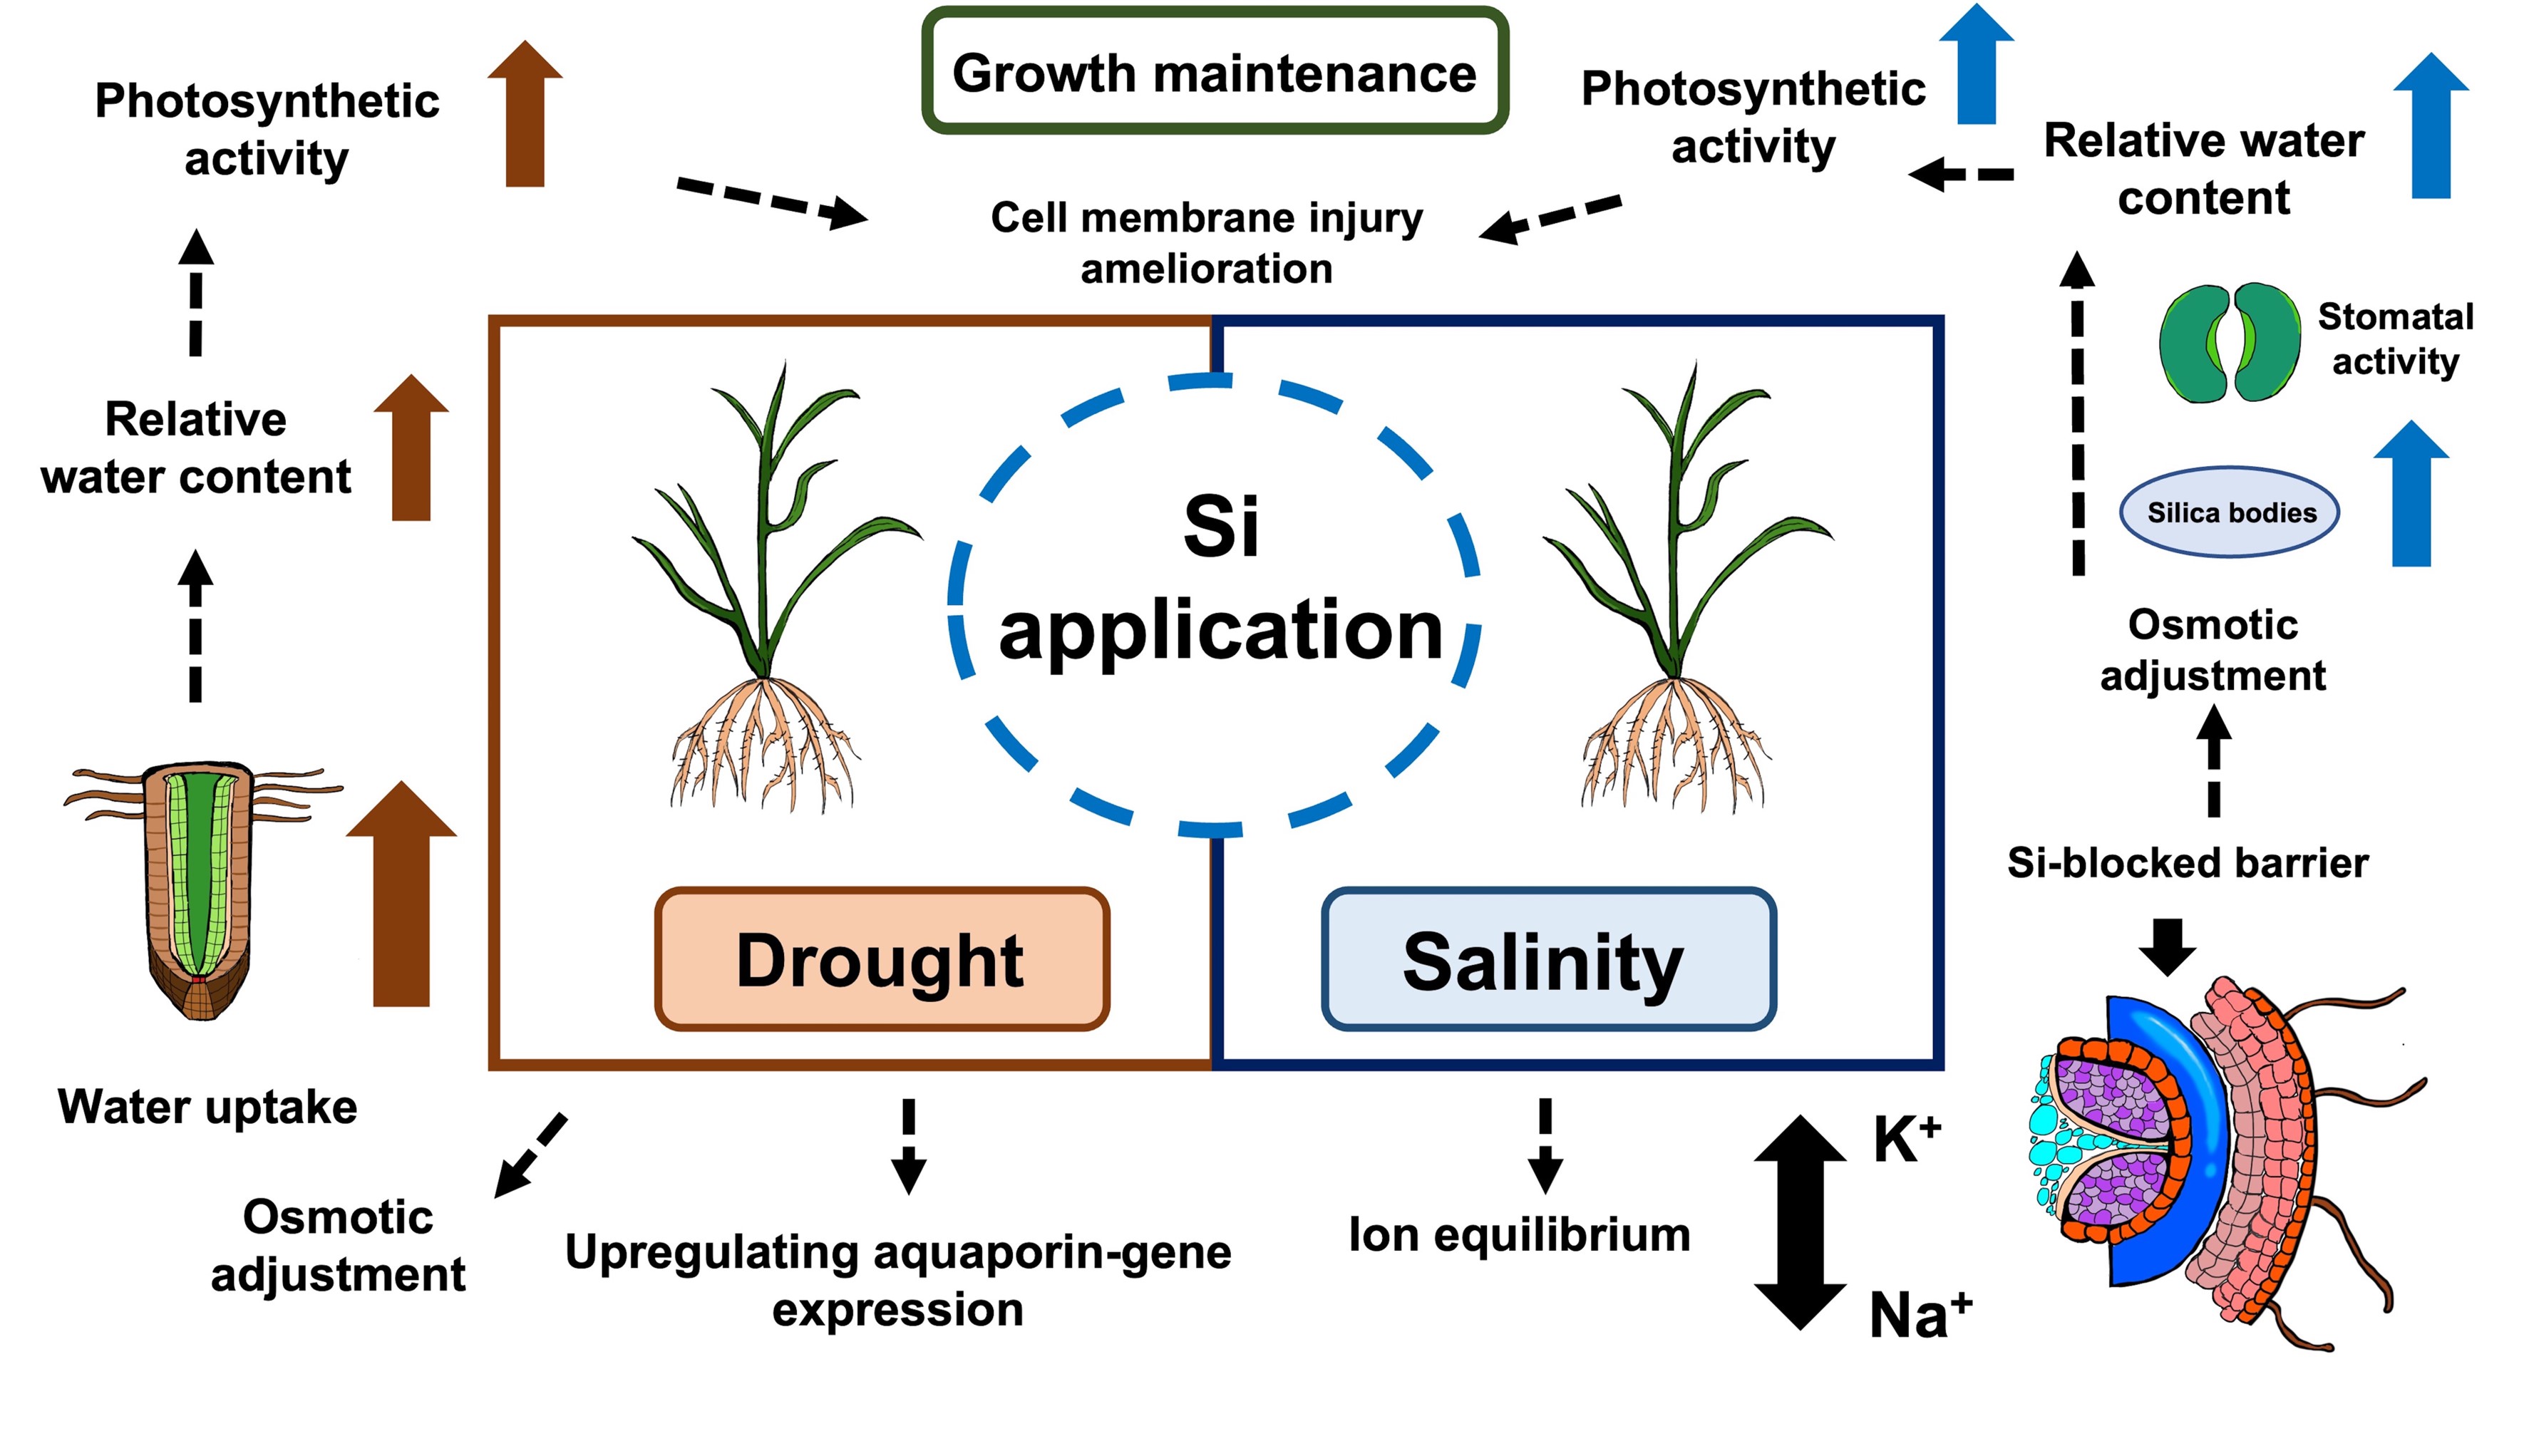
Generally, cellular toxicity caused by excess Na+, disturbing other nutrient equilibrium, is induced by salt stress (Shahzad et al., 2021). Si can prevent the disturbance of the Na+ and K+ equilibrium by adjusting Na+ accumulation. The Si accumulation significantly increased in all conditions, whereas the Na+ to K+ ratio tended to decline under salinity when the rice plants were treated with 1.5 and 2.0 mM Si. The results are in line with those reported by Yan et al. (2021). They found that exogenous Si up-regulated Si transport genes (OsLsi1 and OsLsi2), which encode Si transporters OsLsi1 and OsLsi2. OsLsi1 and OsLsi2 locate in endodermis, regulate Si uptake via roots, and defend Na+ root-to-shoot translocation as an apoplastic barrier. In addition, Si improved the activity of the K+ transporter and intensively stimulated H+-ATPase to decrease osmotic stress substantially (Jam et al., 2022; Oraee & Tehranifar, 2022). As mentioned above, when applied at proper concentrations, silicon was able to alleviate the drought and salinity effects on rice through mechanisms depicted in Figure 4.
Figure 4
Overall Si-mediated stress mitigating mechanisms in rice plants in drought and saline conditions.
The multivariate analysis using PCA indicated that the growth, photosynthetic, and water status parameters in the control group treated with Si and in both drought and salt-stressed groups were highly correlated, as well as receiving amelioration from all Si concentrations. The PCA results also implied that Si produced greater improvement in alleviation of salt stress than drought, as shown by the separation of the Si-supplemented salt treatments from the non-Si salt group along PC1.
. Conclusion
Rice plants under drought and salt stress must confront critical physiological damage causing growth reduction, including reduced water relations, increasing stress bio indicators, and cellular electrolyte leakage, particularly an imbalance of ion contents in plant tissues exposed to high salt solutions. In this study, 2.0 mM Na2SiO3 was the best concentration for relieving drought and salinity effects. The Si application significantly retrieved several growth and physiological parameters, especially positively adjusting the Na+/K+ equilibrium. However, unsuitable concentrations of Si might exhibit an insufficient capability to handle stress. Hence, the Si administration as 2.0 mM Na2SiO3 might be appropriate for application to the KDML105 rice cultivar. From our perspective, these results will support further investigation in various cultivars and forms of Si, answering unknown questions in the future.
