. Introduction
Around the world, there is a total of 230 million hectares of agricultural land, with 20% being saline and salinized areas and extensively increasing each year (Abd El-Samad & Taha, 2022; C. Liu et al., 2021). Moreover, the global population is projected to grow by over 9 billion people by 2050, making it essential to increase rice production to meet the increasing global food demand (T. Chen et al., 2021). Vietnam plays a significant role in the international rice market as one of the leading rice exporters, supplying this cereal to more than 160 countries and territories and holding 15% of the global rice market share. In Vietnam, there are two major regions dedicated to rice cultivation and production: The Mekong River Delta contributes 51% of the country’s rice production, while the Red River Delta accounts for 15%. Presently, in the Mekong River Delta region, 1.7 million hectares of agricultural land are affected by saline water, which constitutes 45% of the area. This is primarily caused by seawater intrusion (Bich Ha & Cong, 2015).
Plants have developed various mechanisms to combat stress, including biochemical and metabolic processes. Firstly, they activate and produce antioxidants, such as enzymes and non-enzymatic compounds, to directly neutralize ROS (reactive oxygen species). Secondly, plants synthesize different isoform proteins (Ngoc et al., 2022). Thirdly, a defense mechanism involves programmed cell death to prevent the spread of oxidative stressors (Demidchik & Maathuis, 2007). Lastly, plants activate biosynthetic systems to repair cellular components damaged by oxidation (Møller et al., 2007). Plants also possess effective antioxidant systems, which consist of antioxidant enzymes (SOD, CAT, and POD) (Chakraborty & Bhattacharjee, 2015) and non-enzymatic compounds (Gill & Tuteja, 2010) to cope with salt stress. For example, SOD converts superoxide into less harmful forms like H2O2 and O2∙− (Kliebenstein et al., 1998). POD plays a vital role in responding to salt stress, converting H2O2 into H2O, and is involved in the loosening of cell walls (Møller et al., 2007). Catalase helps remove the toxic product H2O2 generated by SOD (Møller et al., 2007). Various low-molecular-weight sugars, organic acids, polyols, and nitrogen-containing compounds like amino acids, amides, and imino acids are important in osmotic regulation. They prevent ROS radicals from emerging, thus controlling oxidation and osmotic regulation (Ghosh et al., 2016). To combat the adverse effects of salinity stress and improve salt tolerance, the profile of certain biologically active compounds which significantly affect plant growth and development has changed, such as amino acids and sugars. According to Dubey and Singh (1999), salinity altered the profile of non-reducing and reducing sugars and the activity of enzymes related to sugar metabolism in rice, which provides a linkage between sugar content and salt stress. Sugar was found to act as a crucial molecular signal during the response to salinity stress via controlling gene expression, scavenging free radicals, maintaining intracellular stability, and preventing cell dehydration (Dubey & Singh, 1999; Feng et al., 2019). Sugars also support cellular defense mechanisms against pathogens and contribute to the synthesis of secondary compounds like lignins, stilbenes, and flavonoids (Jeandet et al., 2022; Sami et al., 2016). Furthermore, sugars cause an increase in the accumulation of amino acids, particularly proline, which plays a vital role in osmosis regulation, preventing redox reactions, stabilizing plant membranes, enzymes, and proteins, and providing energy and nitrogen in response to salt stress (Jeandet et al., 2022; Sami et al., 2016). Plants respond to high levels of salt by producing a number of reducing sugars such as fructose, glucose, and sucrose, which further provide tolerance against salinity. By modifying cell osmoticum, sugar alcohols like inositol, sorbitol, and mannitol also contribute to salinity tolerance (Arif et al., 2020).
Amino acids are important components of plant cell proteins and are also important osmotic regulators in the cytoplasm. They can increase cell water retention and biostimulants, eliminate ROS produced during photosynthesis and respiration, improve physiological characteristics, significantly boost salt tolerance, and reduce the inhibition of salt stress on the growth and development of plants (Zhang et al., 2020). Some amino acids, such as isoleucine, aspartic acid, cysteine, proline, serine, and glutamic acid, also contribute to plant defense against salinity stress (Farooq et al., 2023). Aspartic acid restores SOD and CAT enzyme activity under salt stress and activates specific genes (FtNHX1 and FtSOS1) during the response to salt stress in Tartary buckwheat (Zhang et al., 2020). Branched amino acids were also enhanced, which act as stress reducers and an alternative to the mitochondrial electron transport chain (Arif et al., 2020). Although many studies have investigated the amino acid profiles of rice cultivars, the results are varied among the cultivars due to the variation of origins, genetic makeup, and immune levels (Farooq et al., 2023).
Rice cultivars Pokkali and IR 29 are commonly used as model rice varieties in various studies focused on biotic and abiotic stress, particularly salinity stress (K.-S. Lee et al., 2003). Pokkali is known for its high tolerance to salt and its ability to thrive in coastal marshes with high salinity and acidity levels (Shamna & Vasantha, 2017). In turn, IR 29 is a salt-sensitive rice cultivar displaying clear susceptibility to salinity, as evidenced by lesions on its plant tissues (Safitri et al., 2018). In this study, we studied the effect of salinity stress on three rice cultivars, which are extensively grown in Vietnam with high yields and have different degrees of susceptibility to salinity stress. Among the three rice cultivars, Dai Thom 8 is salt-sensitive (Phuoc & Ngoc, 2013; Quang Hoang & Thi Kim, 2018), OC 10 demonstrates moderate salt tolerance (Thanh et al., 2019), and OM 9577 is a salt-tolerant rice variety with a salinity level ranging from about 5 to 6%0 (Thi Cuc et al., 2013). Moreover, the salinity tolerance traits in rice vary throughout different growth stages of the plant (Safitri et al., 2018). Research has shown that rice is tolerant to salinity during the seeding stage, highly sensitive during transplanting, resistant during panicle formation, susceptible during pollination and flowering, and ultimately tolerant again during maturity. Therefore, it is essential to thoroughly study the mechanisms of salt tolerance in rice at each growth stage (Chang et al., 2019). In this study, we investigated the metabolic responses to salt stress of roots at the seedling stage to understand their physiological reactions. Roots play a vital role in adapting to salinity. Root length, diameter, and number regulate root performance and improve the crop to increase water and nutrient uptake during stress. During salinity, roots proliferate and increase in size (Arif et al., 2020). Furthermore, the root is the first organ to perceive the salt signal (Y. Liu et al., 2017); therefore, investigation of root amino acids and sugars under salt stress is critical and essential.
Salinity exerts adverse effects on plant growth, impacting various aspects, including: (1) Growth rate (Ngoc et al., 2022), (2) Increase in O2∙− leading to the formation of H2O2, OH, and other ROS (reactive oxygen species) (Gill & Tuteja, 2010), (3) Activity of antioxidant enzyme complexes (isozymes) (Garg & Manchanda, 2009), (4) Lipid peroxidation and damage to cell membranes (Kong-ngern et al., 2012), (5) Synthesis of certain amino acids (Zhang et al., 2020), (6) Synthesis of certain sugars (Ghosh et al., 2016). These indicators have been examined and compared among rice cultivars with varying abilities to respond to salinity stress: salt-tolerant rice cultivars (Pokkali, OM 9577), a moderately salt-tolerant rice cultivar (OC 10), and salt-sensitive rice cultivars (Dai Thom 8 and IR 29). However, the salt tolerance of OM 9577, OC 10, and Dai Thom 8 rice cultivars in correlation with amino acids, sugars, and antioxidant enzymes has not been thoroughly investigated yet. Hence, the current study aims to analyze and evaluate the physicochemical and biochemical reactions of these rice cultivars to identify potential biochemical indicators for selecting salt-tolerant rice varieties. The ultimate goal is to enhance, propagate, and produce salt-tolerant rice using sustainable traditional breeding methods and transgenic approaches.
. Materials and methods
. Sterilization and salinity treatments for rice seeds
The study involved three rice cultivars: Dai Thom 8 (salt-sensitive), OC 10 (moderately salt-tolerant), and OM 9577 (salt-tolerant). These were compared with two control samples consisting of the salt-tolerant Pokkali rice cultivar and the salt-sensitive IR 29 rice cultivar. All rice cultivars were obtained from the Loc Troi Group (Vietnam) and the Ben Tre Hi-tech Application Center (Vietnam). The researchers adopted the IRRI evaluation scoring system to assess the salinity tolerance of these cultivars visually at the seedling stage (Ngoc et al., 2022).
The sample preparation procedure followed the methodology outlined by Yeh et al. (2007). Rice seeds underwent sterilization with 5% NaOCl. Subsequently, the grains were placed in Petri dishes (9 cm) with 20 ml of water and incubated in darkness at 37 °C for 3 days. Then, they were transferred to another Petri dish (9 cm) containing filter paper and 15 ml of water and further incubated in darkness at 26 ± 2 °C. After 3 days, grains with a root length of 2.5 ± 0.5 cm were used for all subsequent analyses (Yeh et al., 2007).
. Effect of NaCl concentration on growth in rice
The roots of six-day-old rice seedlings were treated with NaCl solutions at various concentrations: 0, 50, 100, 150, 200, 250, and 300 mM. After 72 hours, the shoot and root lengths were measured. Two experiments were conducted using 15 different seedlings to calculate the mean of root and shoot lengths (Ngoc et al., 2022).
. ROS accumulation and lipid peroxidation in rice roots
ROS accumulation was assessed using histochemical methods (Ngoc et al., 2022). DAB (diaminobenzidine) was oxidized by H2O2, resulting in a dark brown color (Thordal-Christensen et al., 1997), while NBT was reduced by O2∙−, producing green formazan products (Doke, 1983). The presence of aldehydes resulting from lipid peroxidation on the root surface was detected by the Schiff reagent (Yamamato et al., 2001). Rice roots were soaked in the Schiff reagent for 20 minutes and then washed with 0.5% (w/v) K2S2O5 (K2S2O5 dissolved in 0.05 M HCl). The stained roots were observed and photographed using a stereo microscope Olympus SZ61 (Olympus, Japan).
. Determination of O2∙− and H2O2 concentration in rice roots
The hydrogen peroxide concentration was assessed using titanic sulfate according to the method outlined by Chakraborty and Bhattacharjee (2015). Fresh roots (0.5 g) were ground with 5 ml of cold acetone, and the mixture was then centrifuged at 10,000 rpm for 10 minutes. The supernatant extract was collected, and H2O was added to bring the total volume to 10 ml. Subsequently, 1 ml of 5% titanic sulfate (in 20% H2SO4) and 2 ml of NH4OH were added, followed by centrifugation at 6,000 rpm for 10 minutes. The mixture was washed with 5 ml of acetone three times and then centrifuged at 6,000 rpm for 10 minutes. The resulting pellet was dissolved with 3 ml of H2SO4 2 N, and its absorbance was measured at 420 nm. The superoxide concentration was determined following the method proposed by Chakraborty and Bhattacharjee (2015) with slight modifications. Fresh roots (0.25 g) were ground with 2.5 ml of a solution containing 0.2 M sodium phosphate buffer and diethyldithiocarbamate (10−3 M). The mixture was then centrifuged at 10,000 rpm at 4 °C for 10 minutes, and the supernatant was collected. The superoxide concentration was determined using the NBT reduction capacity (2.5 × 10⁻⁴ M), and the absorbance of the end product was determined at 540 nm.
. DPPH and ABTS+ free radical scavenging ability
A fresh root weighing 0.5 g was finely ground with 3 ml of methanol and then centrifuged at 10,000 rpm at 4 °C for 20 minutes. The resulting supernatant was collected to assess the DPPH and ABTS+ free radical scavenging ability, following the procedure used by Chakraborty and Bhattacharjee (2015). The total antioxidant capacity (TAC) of DPPH was calculated using the following formula: TAC (%) = (1 − (Ai − Aj)/Ac) × 100%, where Ai = 1 ml sample + 3 ml DPPH, Aj = 1 ml sample + 3 ml methanol, Ac = 1 ml methanol + 3 ml DPPH. Similarly, the ABTS+ (%) was determined using a different formula: ABTS+ (%) = (1 − (Ai − Aj)/Ac) × 100%, in which Ai = 0.2 ml sample + 1.8 ml ABTS+, Aj = 0.2 ml sample + 1.8 ml ABTS+, Aj = 0.2 ml sample + 1.8 ml methanol, and Ac = 0.2 ml methanol + 1.8 ml ABTS+.
. Enzyme activity on native polyacrylamide gel electrophoresis (Native-PAGE)
The Dai Thom 8 cultivar was exposed to a 50 mM NaCl solution, while the OC 10 and OM 9577 cultivars were treated with 100 mM (the half-maximum inhibitory concentration - IC50). In a study carried out by Ngoc et al. (2022), native polyacrylamide gel electrophoresis was conducted to separate enzyme isomers. 10 µg of total protein was analyzed using Native PAGE, employing a stacking gel with a concentration of 4.5% and a separating gel with a concentration of 10%. The process involved applying a voltage of 100 V for 2.5 hours at a temperature of 4 °C. The activities of peroxidase (POD), catalase (CAT), and superoxide dismutase (SOD) were analyzed and observed. For CAT activity determination, the gel was incubated with 0.3% H2O2 for 30 minutes, and then washed and stained with a mixture of 1% K3[Fe(CN)6] and 1% FeCl3 for 15 minutes (Y.-S. Wang & Yang, 2005). In the case of POD activity, the gels were incubated with 80 ml of 0.1 M phosphate buffer at pH 7.0 for 20 minutes, and then a solution containing 20 ml of 0.5% p-phenylenediamine and 20 ml of 0.01% H2O2 was added (Kumar et al., 2008). For SOD activity, the gels were washed and incubated in the dark for 30 minutes with a mixture of phosphate buffer at pH 7.8, including 1 mM EDTA, 0.05 mM riboflavin (in 0.1 M NaOH solution), 0.1 mM NBT, and 0.3% TEMED. Afterward, the gel was washed with water and shaken under light conditions (Wang & Yang, 2005). Coomassie blue staining gel was used to monitor the protein balance in the gel during the NaCl treatment period.
. Antioxidant enzyme assays
Isoenzyme activity was evaluated using total proteins extracted from rice roots (Ngoc et al., 2022). SOD, CAT, and POD activities were determined following the procedure outlined by Kumar et al. (2008).
. Gas Chromatography–Mass Spectrometry (GC–MS) analysis
Six-day-old rice roots were subjected to a 100 mM NaCl solution treatment for 72 hours. To prepare the samples, 0.5 g of fresh roots were ground and mixed with 10 ml of a 2 M Trifluoroacetic acid solution, and then incubated at 37 °C for 5 hours. The sample was later evaporated to a constant mass and dissolved in 1.0 ml of DMSO. Further, 300 µl of acetic anhydride and 60 µl of 1-methylimidazole were added, followed by a 20-minute ultrasound treatment. Subsequently, 1,200 µl of water and 1500 µl of chloroform were added, leading to the separation of the resulting solution into two phases. The lower phase, consisting of 800 µl with 200 µl of acetone in the vial, was collected for analysis after derivatization using the SCION 456-GC system.
GC–MS analysis was performed using the SCION 456-GC system equipped with a SCION (SQ) mass spectrometer (SCION Instruments-UK). The analysis employed a fused silica capillary Rxi®;-5MS column with dimensions 30 m × 0.25 mm × 0.25 µm. Helium was used as the carrier gas with a flow rate of 1 ml/min. The injection temperature was set at 250 °C, the MSD transfer line at 290 °C, and the ion source at 230 °C. The heat program started with an initial oven temperature of 160 °C maintained for 10 minutes, followed by an increase of 10 °C per minute until it reached 210 °C. The temperature was then raised to 230 °C for 4 minutes and further increased to 280 °C from 2 to 12 minutes. The analysis was performed in the split ratio mode with a split ratio of 50:1, and mass spectra ranging from 150 to 500 m/z were recorded (Xia et al., 2018).
. Determination of amino acid levels using High-Performance Liquid Chromatography with Diode-Array Detection (HPLC-DAD)
In this experiment, six-day-old rice roots were subjected to a 100 mM NaCl solution for 72 hours. A sample of fresh roots weighing 0.5 g was collected to quantify amino acids. The extraction of free amino acids was performed using a MeOH:ACN (acetonitrile):H2O ratio of 2:2:1. Subsequently, the amino acids were derivatized with dansyl chloride. After derivatization, the samples were analyzed using an HPLC-DAD system operating at 250 nm. The HPLC was conducted on an Agilent HPLC 1200 coupled liquid chromatographic system (Agilent, USA) equipped with a diode-array detector (DAD). The analytical column employed was a Zorbax extended Agilent column (250 mm × 4.6 mm, 5.0 µm). The column temperature was set to 30 °C, with a flow rate of 1 ml/min, and an injection volume of 20 µl. The elution solvent system consisted of Mobile phase A (pH 2.7): 5% ACN, 5% IPA (isopropanol alcohol), 90% of 0.1% (v/v) TFA (trifluoroacetic acid) with pH correction using TEA (triethyl amine). Mobile phase B (pH 2.0) contained 40% ACN, 40% IPA (isopropanol alcohol), and 20% of 0.14% (v/v) TFA (trifluoroacetic acid) with pH correction using TFA (trifluoroacetic acid). The concentration gradient program included 10% A for 30 minutes, 40% A for 15 minutes, 50% A for 5 minutes, 50–70% A for 5 minutes, 70–100% A for 1 minute, hold 100% A for 4 minutes, 100–0% A for 1 minute, and hold 1% A up to the 74th minute (Fountoulakis & Lahm, 1998).
. Statistical analysis
The study followed a fully randomized experimental design with three replicates for each treatment (n = 3). ANOVA was employed for statistical analysis, and the disparities among the mean values were evaluated using Statgraphics software. A significance level of P ≤ 0.05 was deemed as indicating statistical significance.
. Results
. Effect of NaCl on the growth of rice plants
The present findings indicated that the tolerance to salinity varied among the five different rice cultivars in terms of both root and shoot lengths (Figure 1A). When exposed to NaCl concentrations ranging from 0 mM to 100 mM, the root length displayed a continuous increase (Figure 1B). Notably, Pokkali and OM 9577 exhibited the most substantial root length growth, followed by OC 10, Dai Thom 8, and IR 29. However, as the NaCl concentrations reached levels between 150 mM and 300 mM, the root growth ceased in all rice cultivars.
Figure 1
Effect of NaCl on the growth of rice plants. Images of rice plants affected by NaCl (A). Effect of NaCl concentration on root and shoot lengths (B and C). Six-day-old rice plants were treated with different concentrations of NaCl (mM) for 72 hours, the shoot and root lengths were then measured. Data are the mean of 15 independent samples (n = 15) and follow one-way ANOVA. (*) It was found that the mean was markedly different from the control p ≤ 0.05 by using the Tukey test with similarity measurements. White bar: 2 cm.
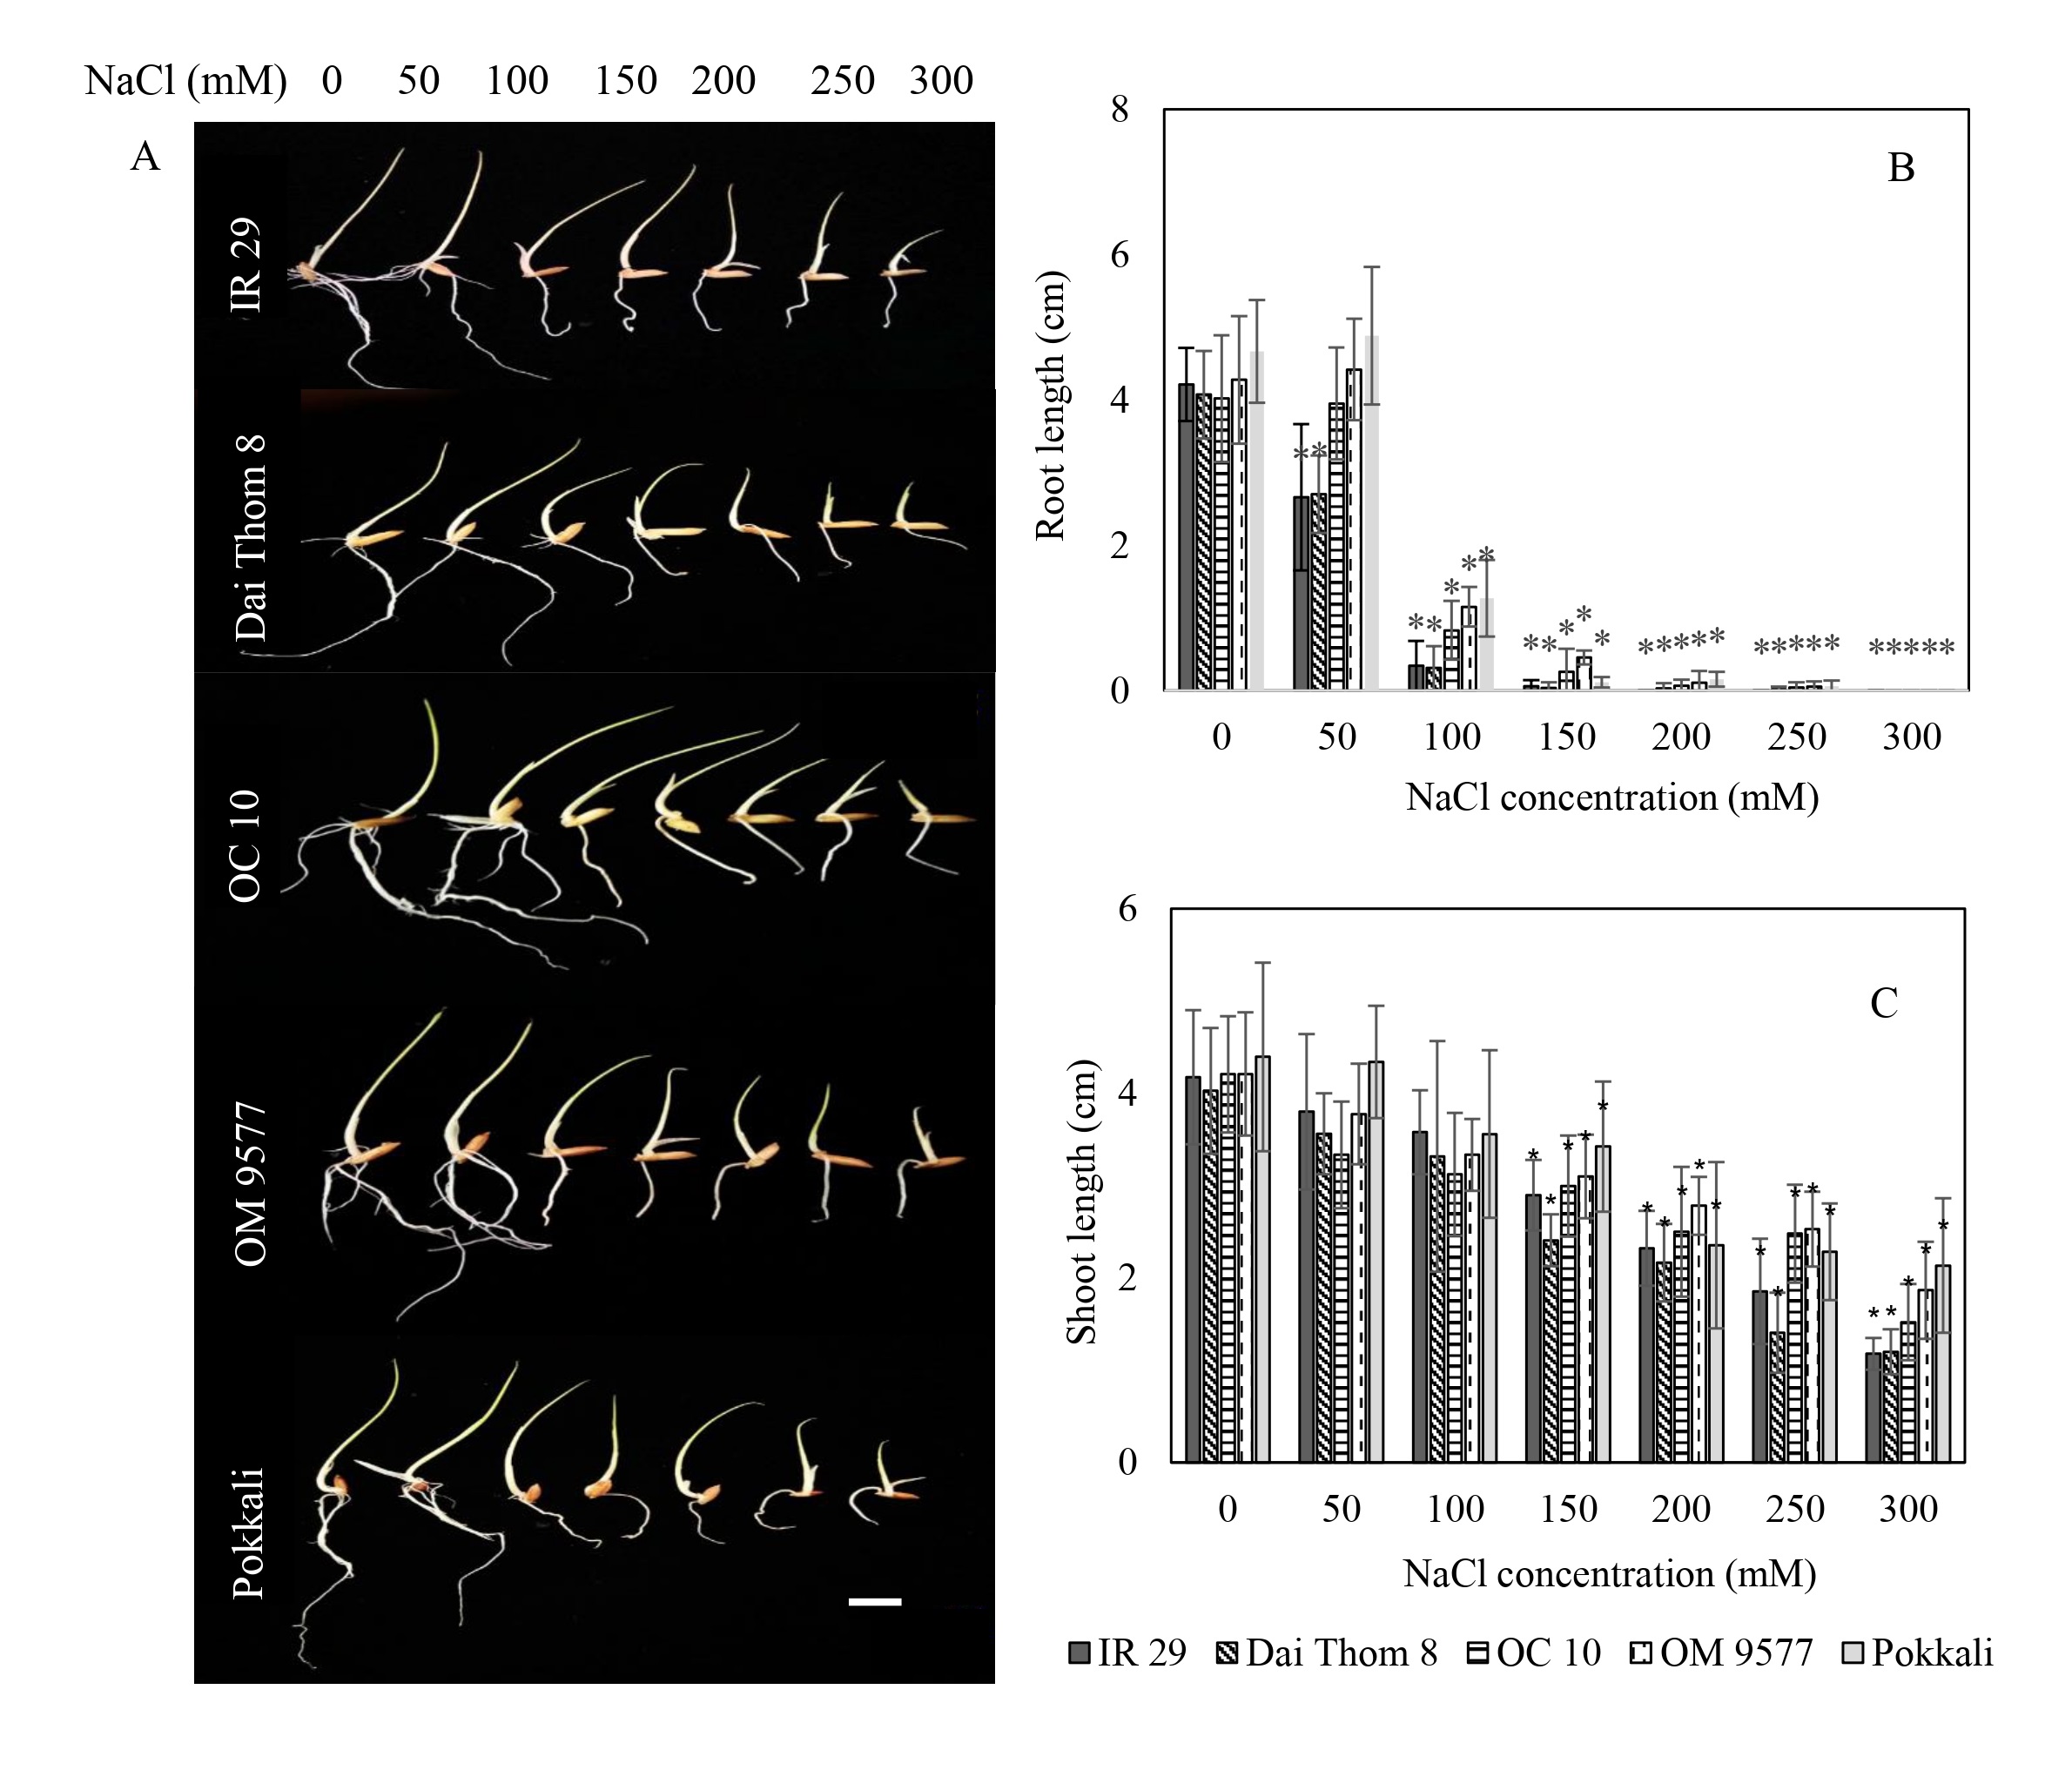
As for shoot length, there were no notable differences between OM 9577 and Pokkali when exposed to NaCl concentrations from 0 mM to 150 mM (Figure 1C). Conversely, at NaCl concentrations ranging from 200 mM to 300 mM, the shoot length notably decreased compared to the 0 mM level. In the case of Dai Thom 8 and IR 29, a significant difference in shoot length was observed, with a sharp decrease in response to NaCl concentrations between 150 mM and 200 mM, followed by further reductions at higher NaCl concentrations. Similarly, in OC 10, the shoot length declined at the 150 mM NaCl concentration and decreased considerably at NaCl concentrations from 200 mM to 300 mM.
. In situ localization of H2O2, O2∙− and lipid peroxidation in root seedlings
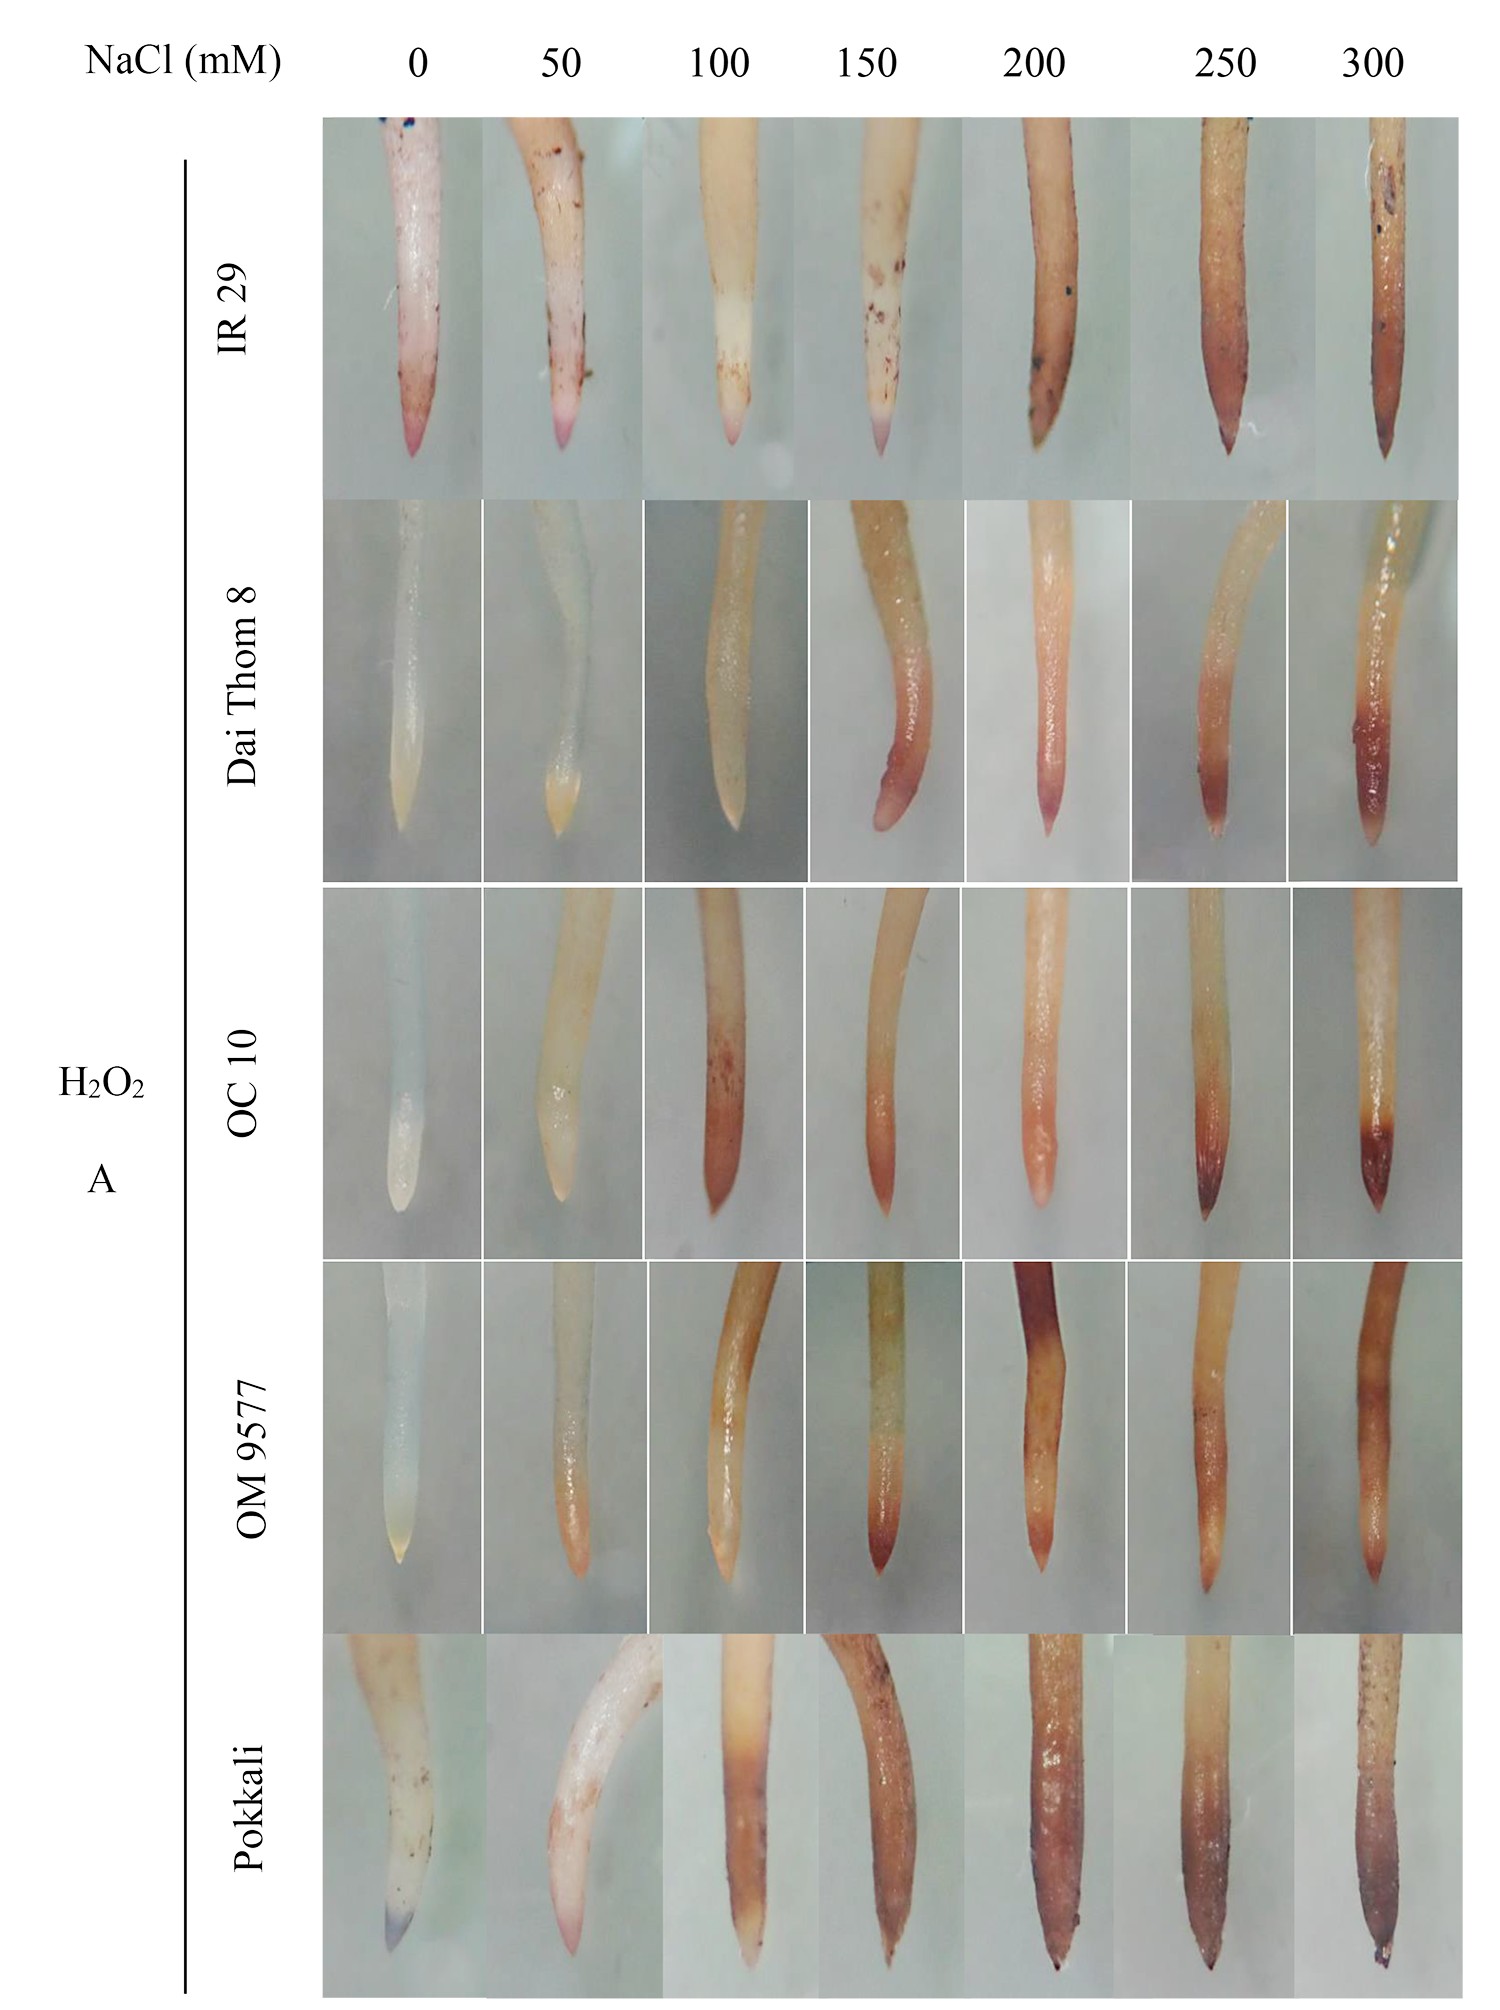
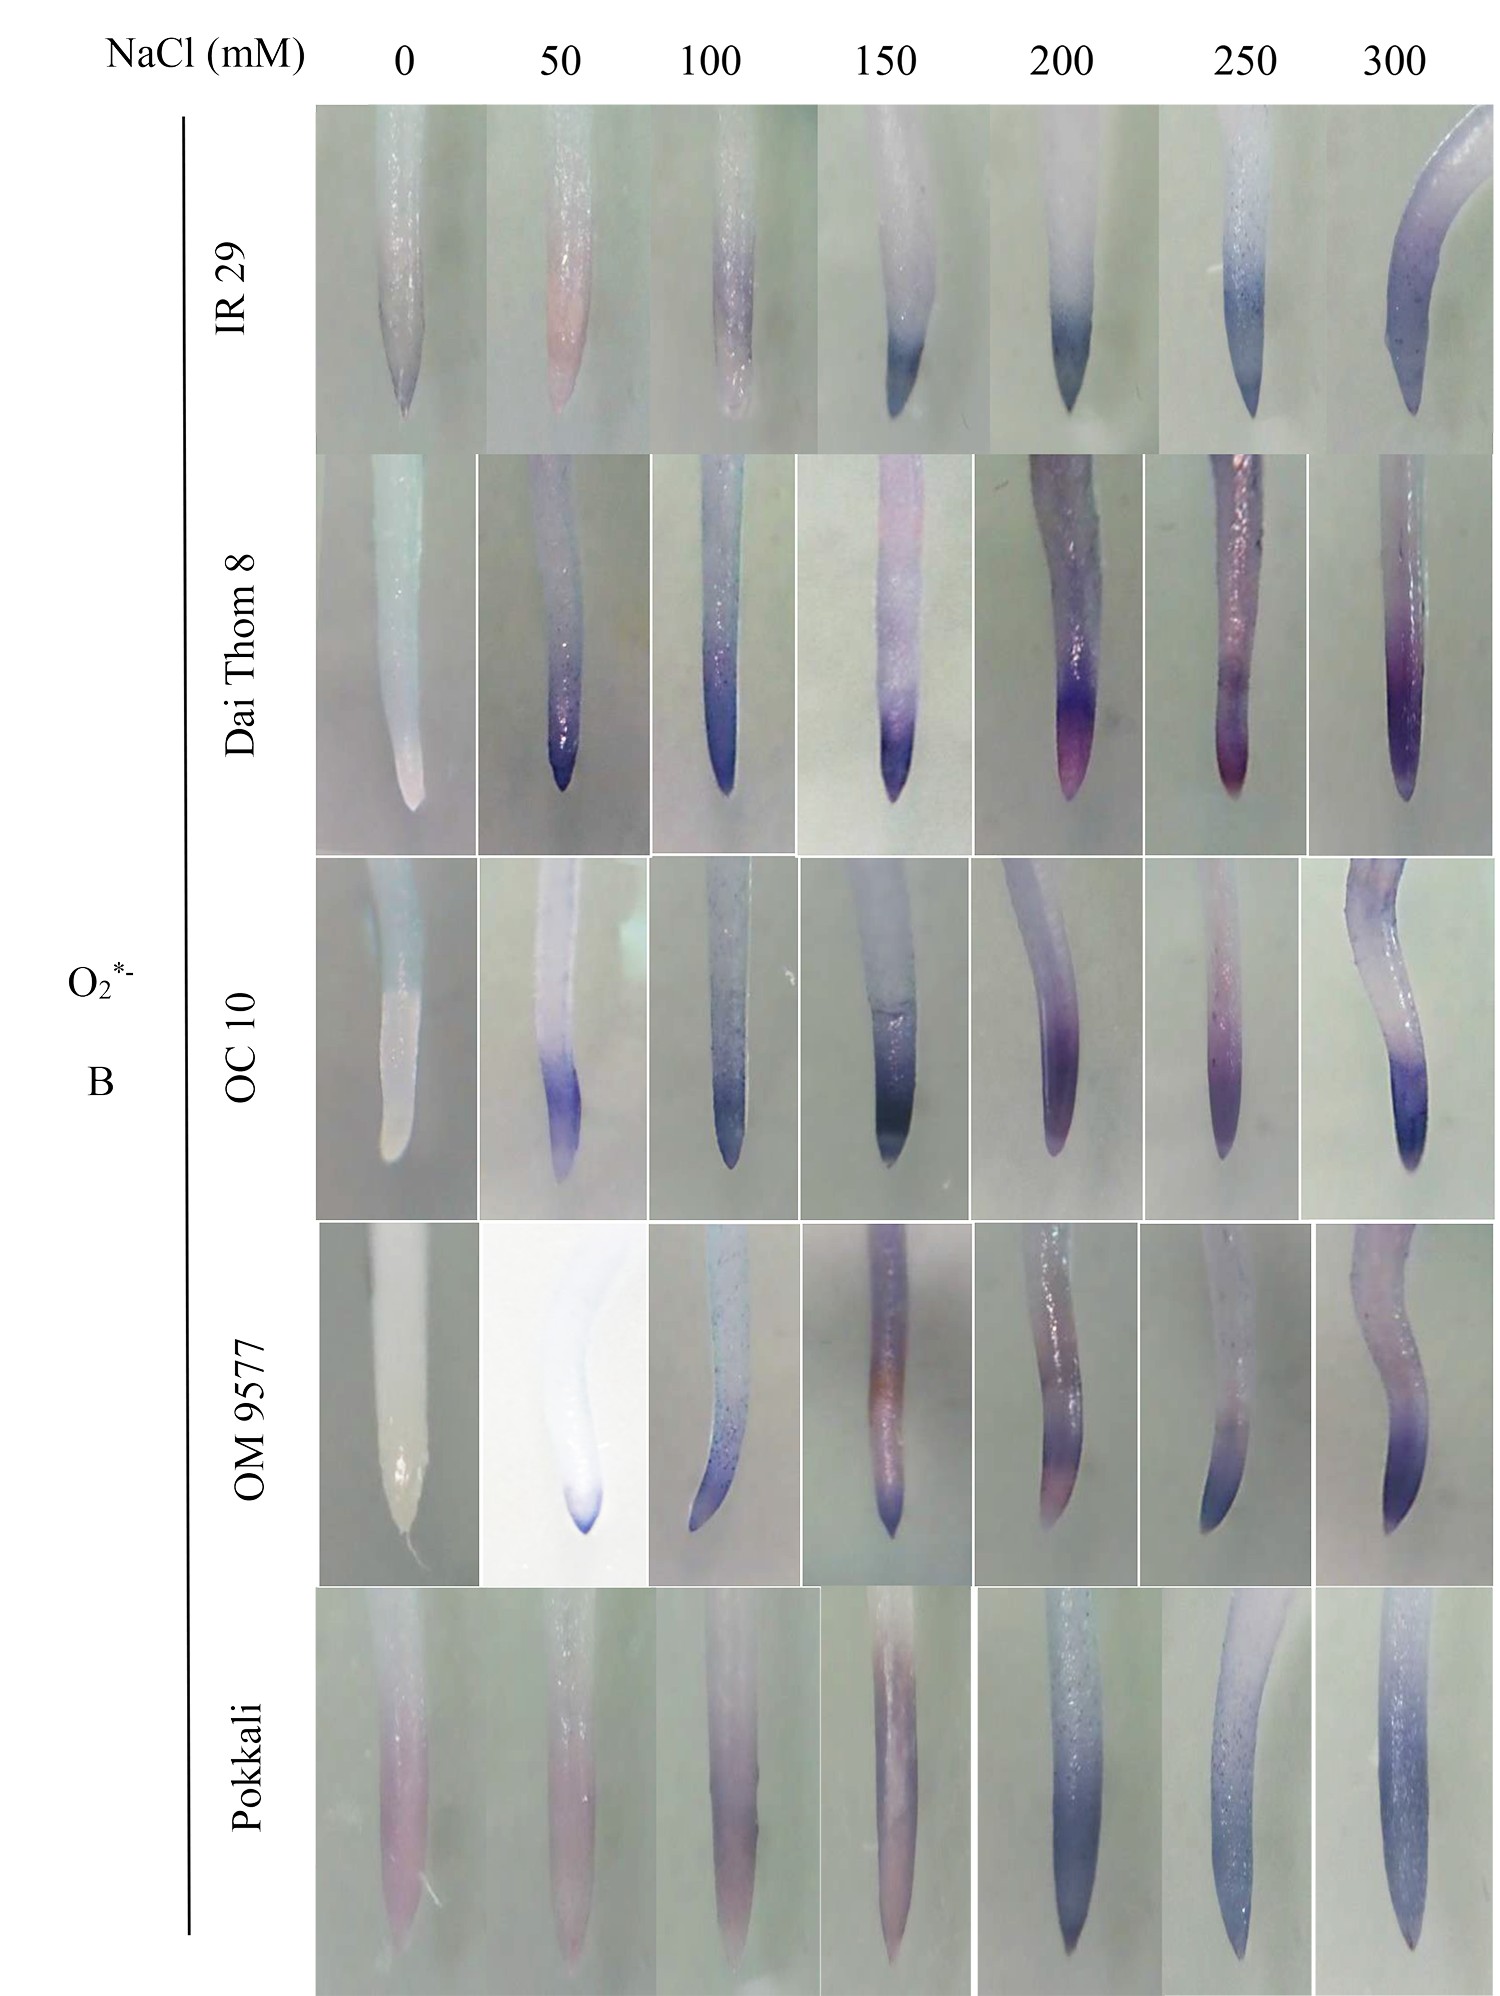
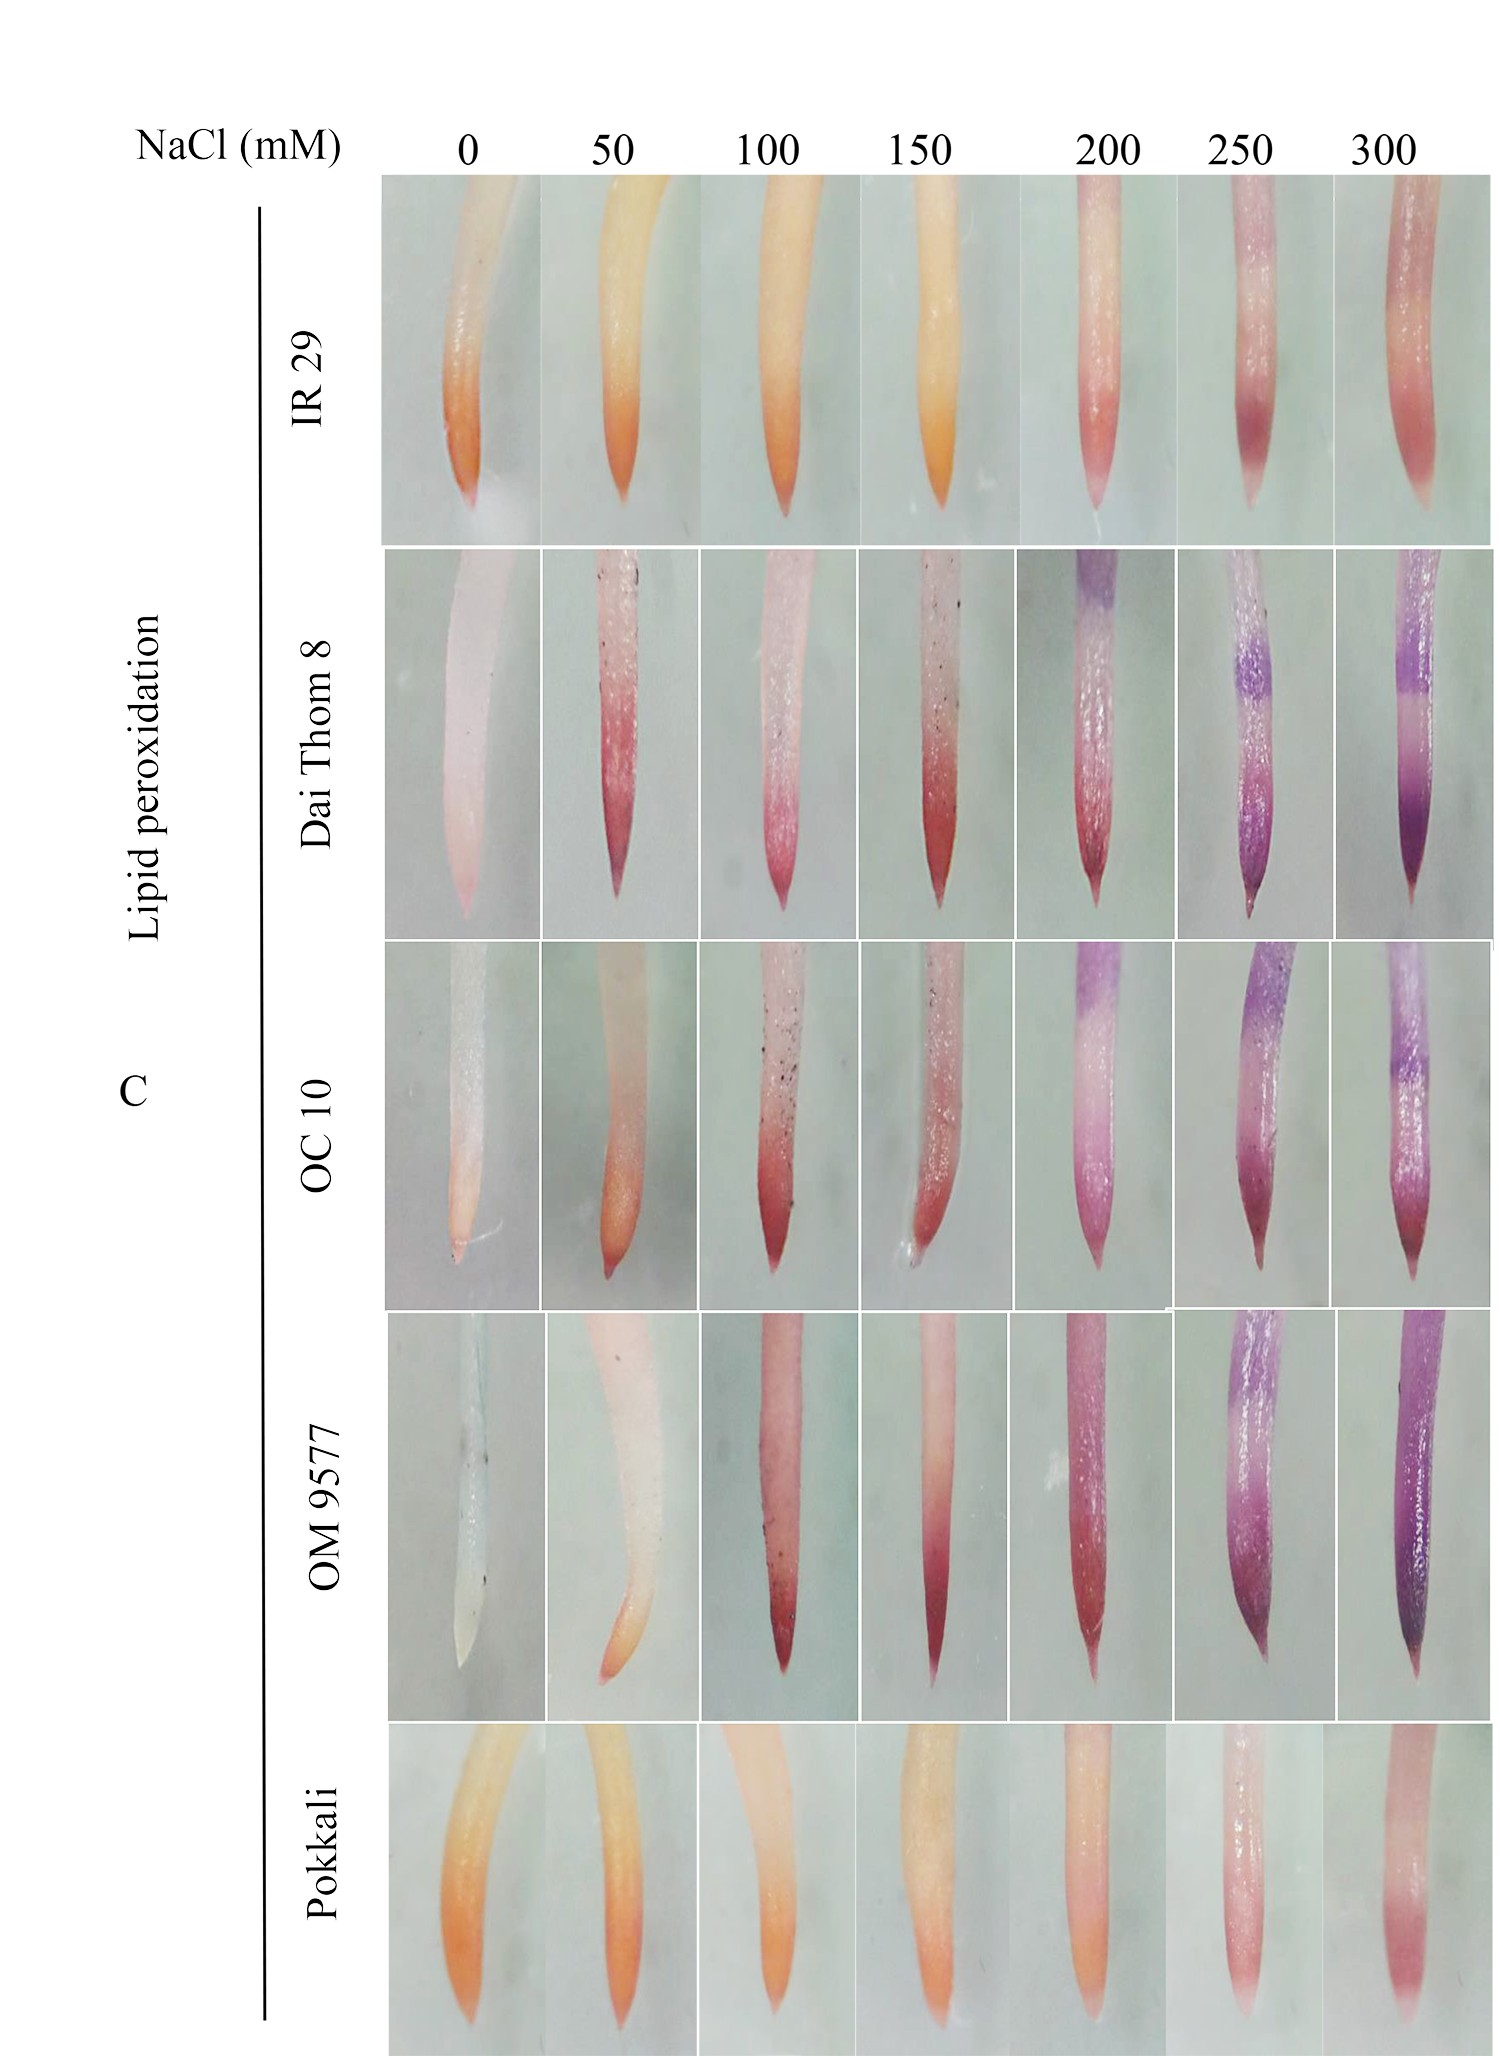
The findings revealed significant variations in ROS accumulation among the different rice cultivars (Figure 2A and Figure 2B). Specifically, OM 9577 and Pokkali showed a lesser accumulation of H2O2 and O2∙−, resulting in lighter brown and green colors in their roots. Conversely, OC 10 displayed darker brown and green roots at NaCl concentrations ranging from 0 mM to 150 mM, which intensified further when the NaCl concentration increased from 200 mM to 300 mM. In turn, Dai Thom 8 and IR 29 exhibited the highest ROS accumulation, leading to the darkest brown and green colors in their roots. The Schiff staining results indicated a correlation between the level of lipid peroxidation and the NaCl concentration (Figure 2C). When comparing the different rice cultivars, it was observed that Pokkali and OM 9577 had the lowest degree of lipid peroxidation, followed by OC 10 with moderate lipid peroxidation, while Dai Thom 8 and IR 29 exhibited severe lipid peroxidation.
Figure 2
Accumulation of H2O2 (A), O2∙− (B) and lipid peroxidation (C) on rice root surface when treated with NaCl. H2O2 and O2∙− were detected with DAB and NBT dyes. Lipid peroxidation was detected with Schiff reagent. The intensity of staining corresponds to different concentrations of NaCl in six-day-old rice plants. Black bar: 0.5 cm.
. O2∙− and H2O2 content
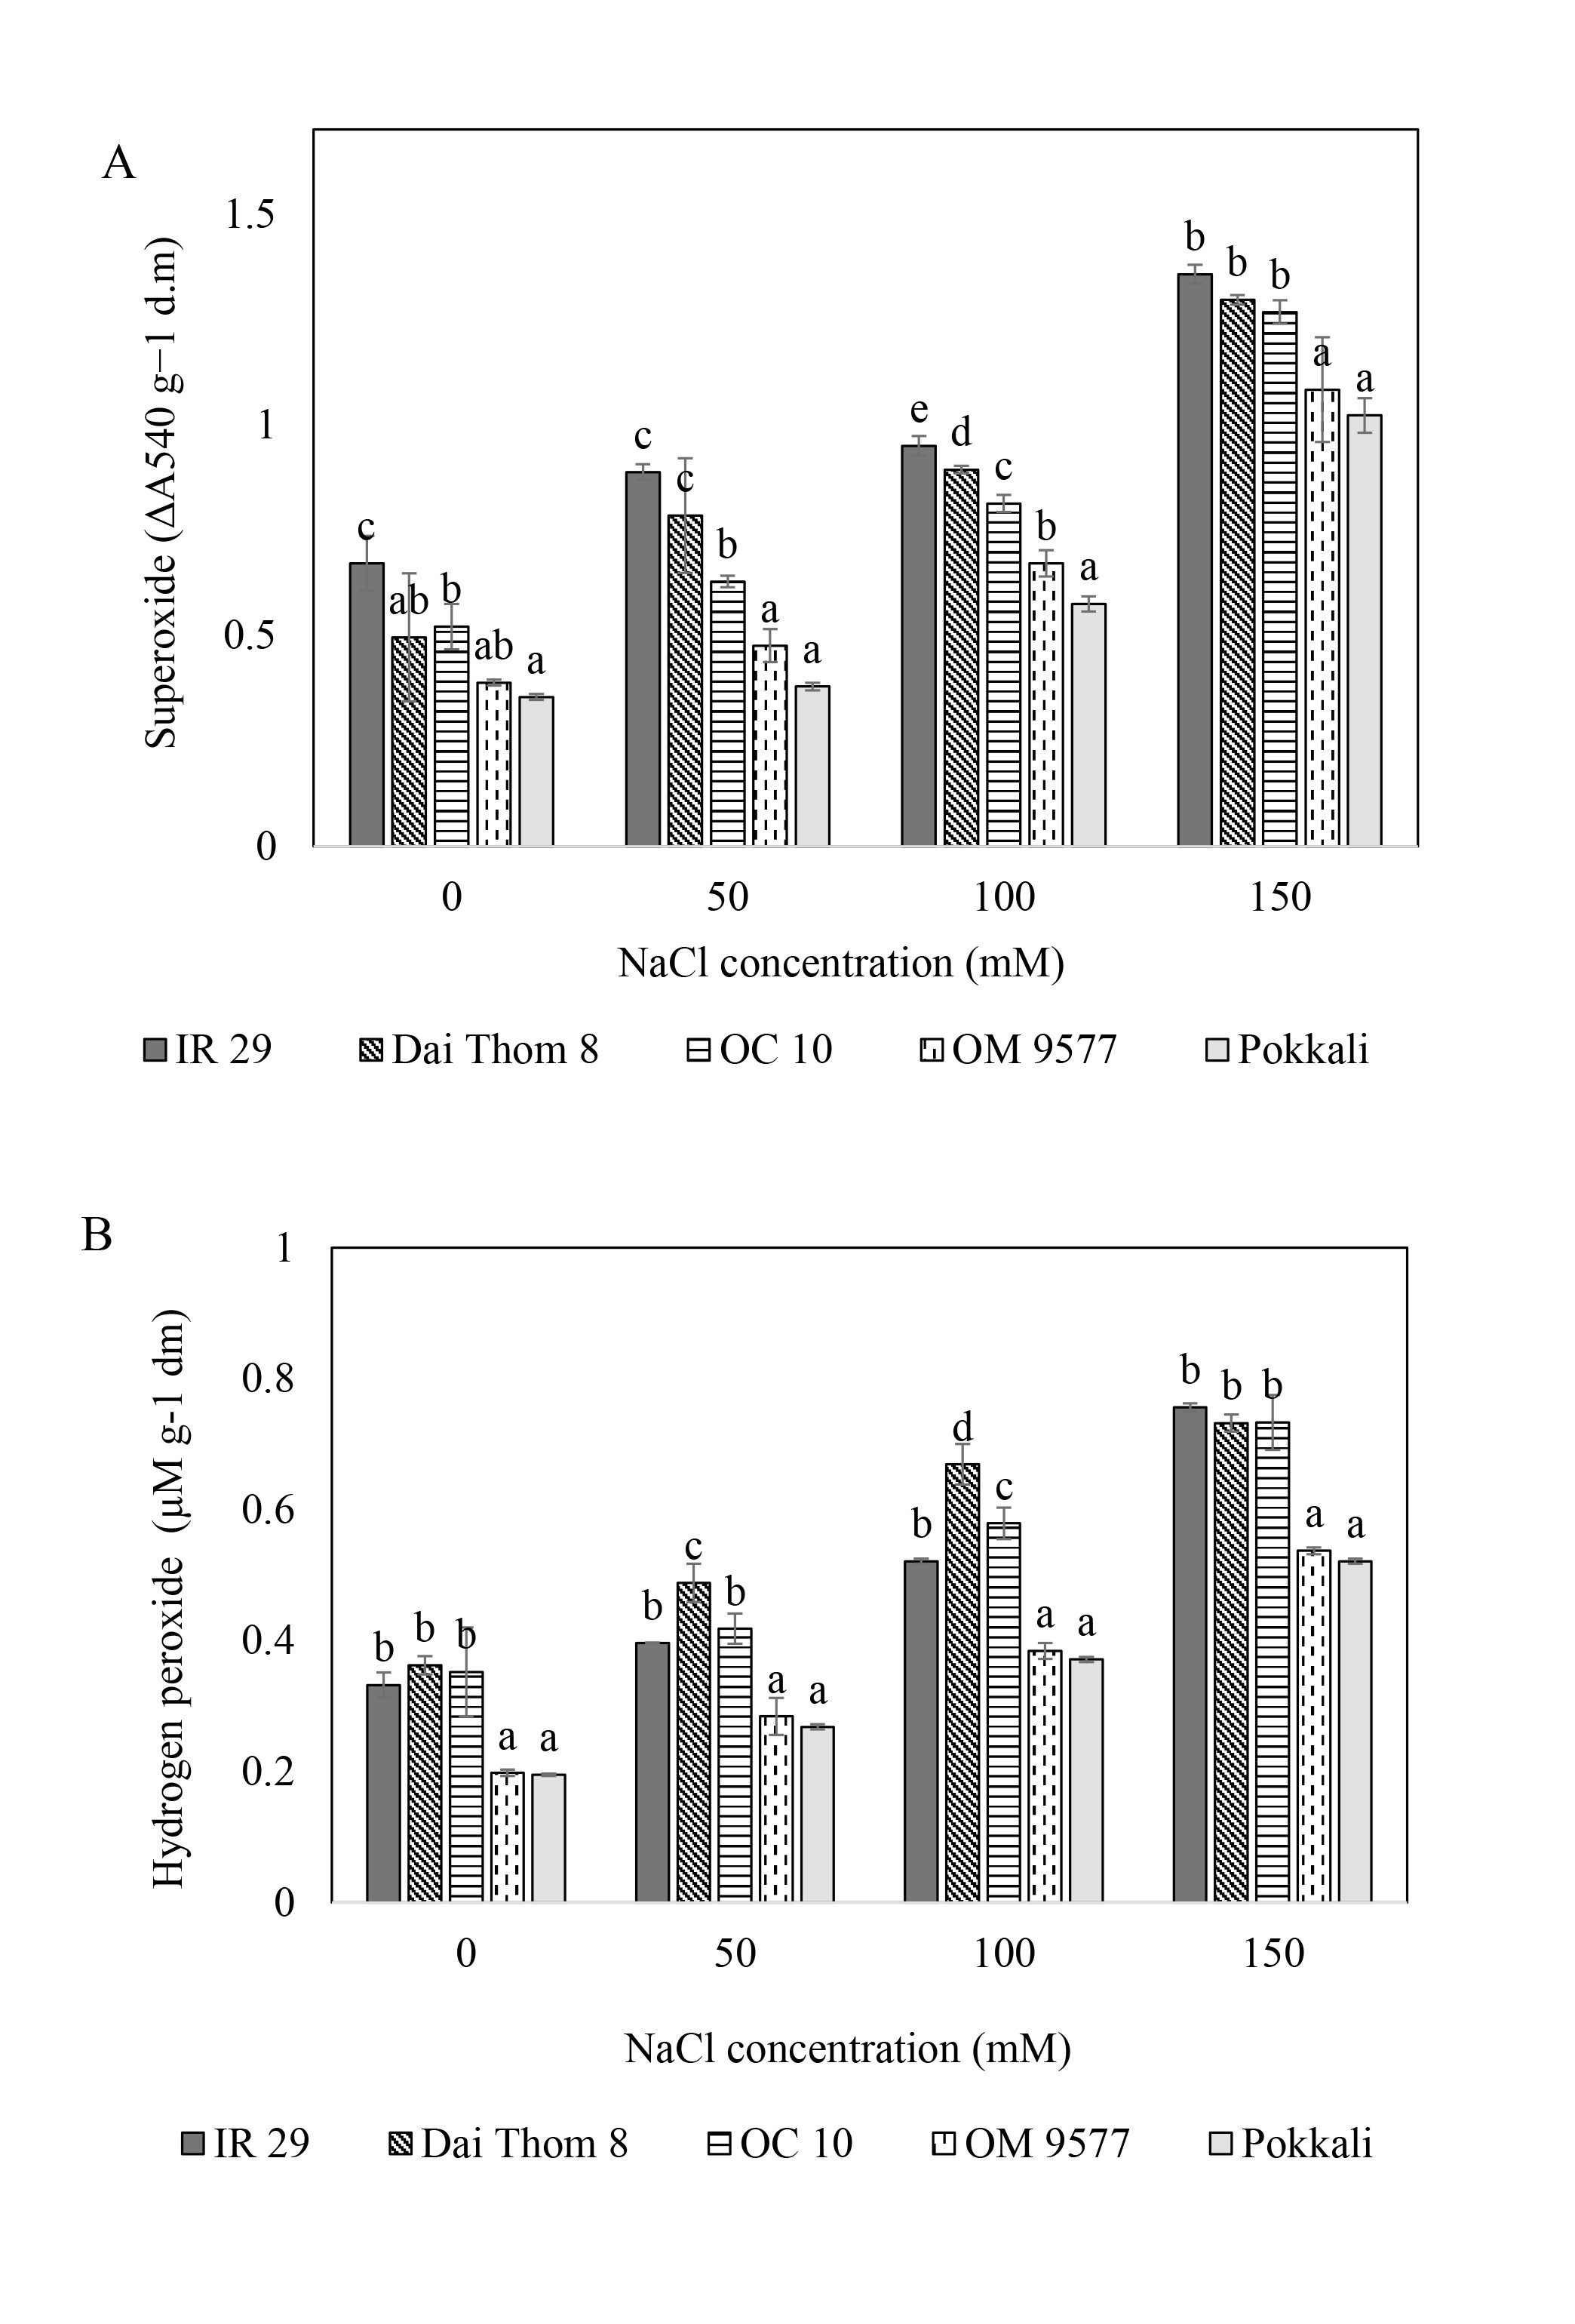
The results showed that (Figure 3) all rice cultivars increased the accumulation of H2O2 and O2∙− when the concentration of NaCl increased. Among them, Pokkali and OM 9577 displayed the lowest accumulation of H2O2 and O2∙−. Following them, OC 10 showed slightly higher levels, while IR 29 and Dai Thom 8 had the highest levels of H2O2 and O2∙− among the tested cultivars. Notably, the salt-sensitive rice cultivars (IR 29 and Dai Thom 8) accumulated H2O2 and O2∙− at a rate 1.5 to 2 times higher than the salt-tolerant rice cultivars (Pokkali and OM 9577), and this accumulation continuously increased at higher NaCl concentrations.
Figure 3
H2O2 (A) and O2∙− (B) concentrations in the roots of five rice cultivars when treated with NaCl. Rice roots were treated with NaCl (mM) at different concentrations for 72 hours. The graphs are the mean (± SE) of three replicates (n = 3) and follow one-way ANOVA. Using the Tukey test for multiple comparisons, various characters represent a significant change at p ≤ 0.05.
. Estimation of antioxidant enzyme activities
The findings indicated that the antioxidant enzyme activity in the rice cultivars varied significantly and changed with the different NaCl concentrations (mM) (Table 1). For instance, at 100 mM NaCl, OC 10 displayed SOD, POD, and CAT activities of 3.343, 17.973, and 386.667 Units mg−1 protein, respectively. However, these enzyme activities decreased at the concentration of 150 mM NaCl, reaching 2.83, 17.5, and 236.667 Units mg−1 protein, respectively. In contrast, at 150 mM NaCl, OM 9577 and Pokkali exhibited the highest enzyme activities of SOD (3.27 and 3.36 Units mg−1 protein, respectively) and POD (19.573 and 20.027 Units mg−1 protein, respectively). Nevertheless, the CAT activity of OM 9577 and Pokkali gradually increased from 50 mM to 100 mM NaCl and then decreased at 150 mM NaCl. At a concentration of 50 mM NaCl, Dai Thom 8 and IR 29 had the highest enzyme activity of CAT (297 and 240 Units mg−1 protein, respectively). From 50 mM to 100 mM NaCl, the enzyme activity (SOD and POD) of Dai Thom 8 and IR 29 steadily increased after decreasing at 150 mM NaCl.
Table 1
Effect of NaCl on enzymatic activities in the roots of five rice cultivars.
. Enzyme activity on native polyacrylamide gel electrophoresis
The analysis of SOD in the roots of three rice cultivars revealed the presence of four isoforms (Figure 4A). OC 10 and OM 9577 exhibited the strongest SOD-a and SOD-b activities, with an increase in the activity observed from 6 to 24 hours. However, Dai Thom 8 showed a decline in SOD-a and SOD-b activities. As for SOD-c, OC 10 and OM 9577 displayed the highest activity, which started increasing from six hours, while Dai Thom 8 had the weakest SOD-c activity, also increasing from six hours. SOD-d was present in all three rice cultivars and exhibited a robust increase in activity from six to 24 hours.
Figure 4
Antioxidant enzyme activity on native polyacrylamide gel electrophoresis (Native-PAGE). When six-day-old rice roots were treated with NaCl for different periods of time, the gel staining process showed many enzyme isomers SOD (A), POD (B) and CAT (C). Enzyme analysis (SOD, POD and CAT) showed the existence of multiple isomer bands corresponding to the concentration and time of treatment of rice roots with NaCl. The data presented herein are the means of three replication and significantly different from the control. Equal amounts of protein at each time point were assessed by Coomassie blue staining (D).
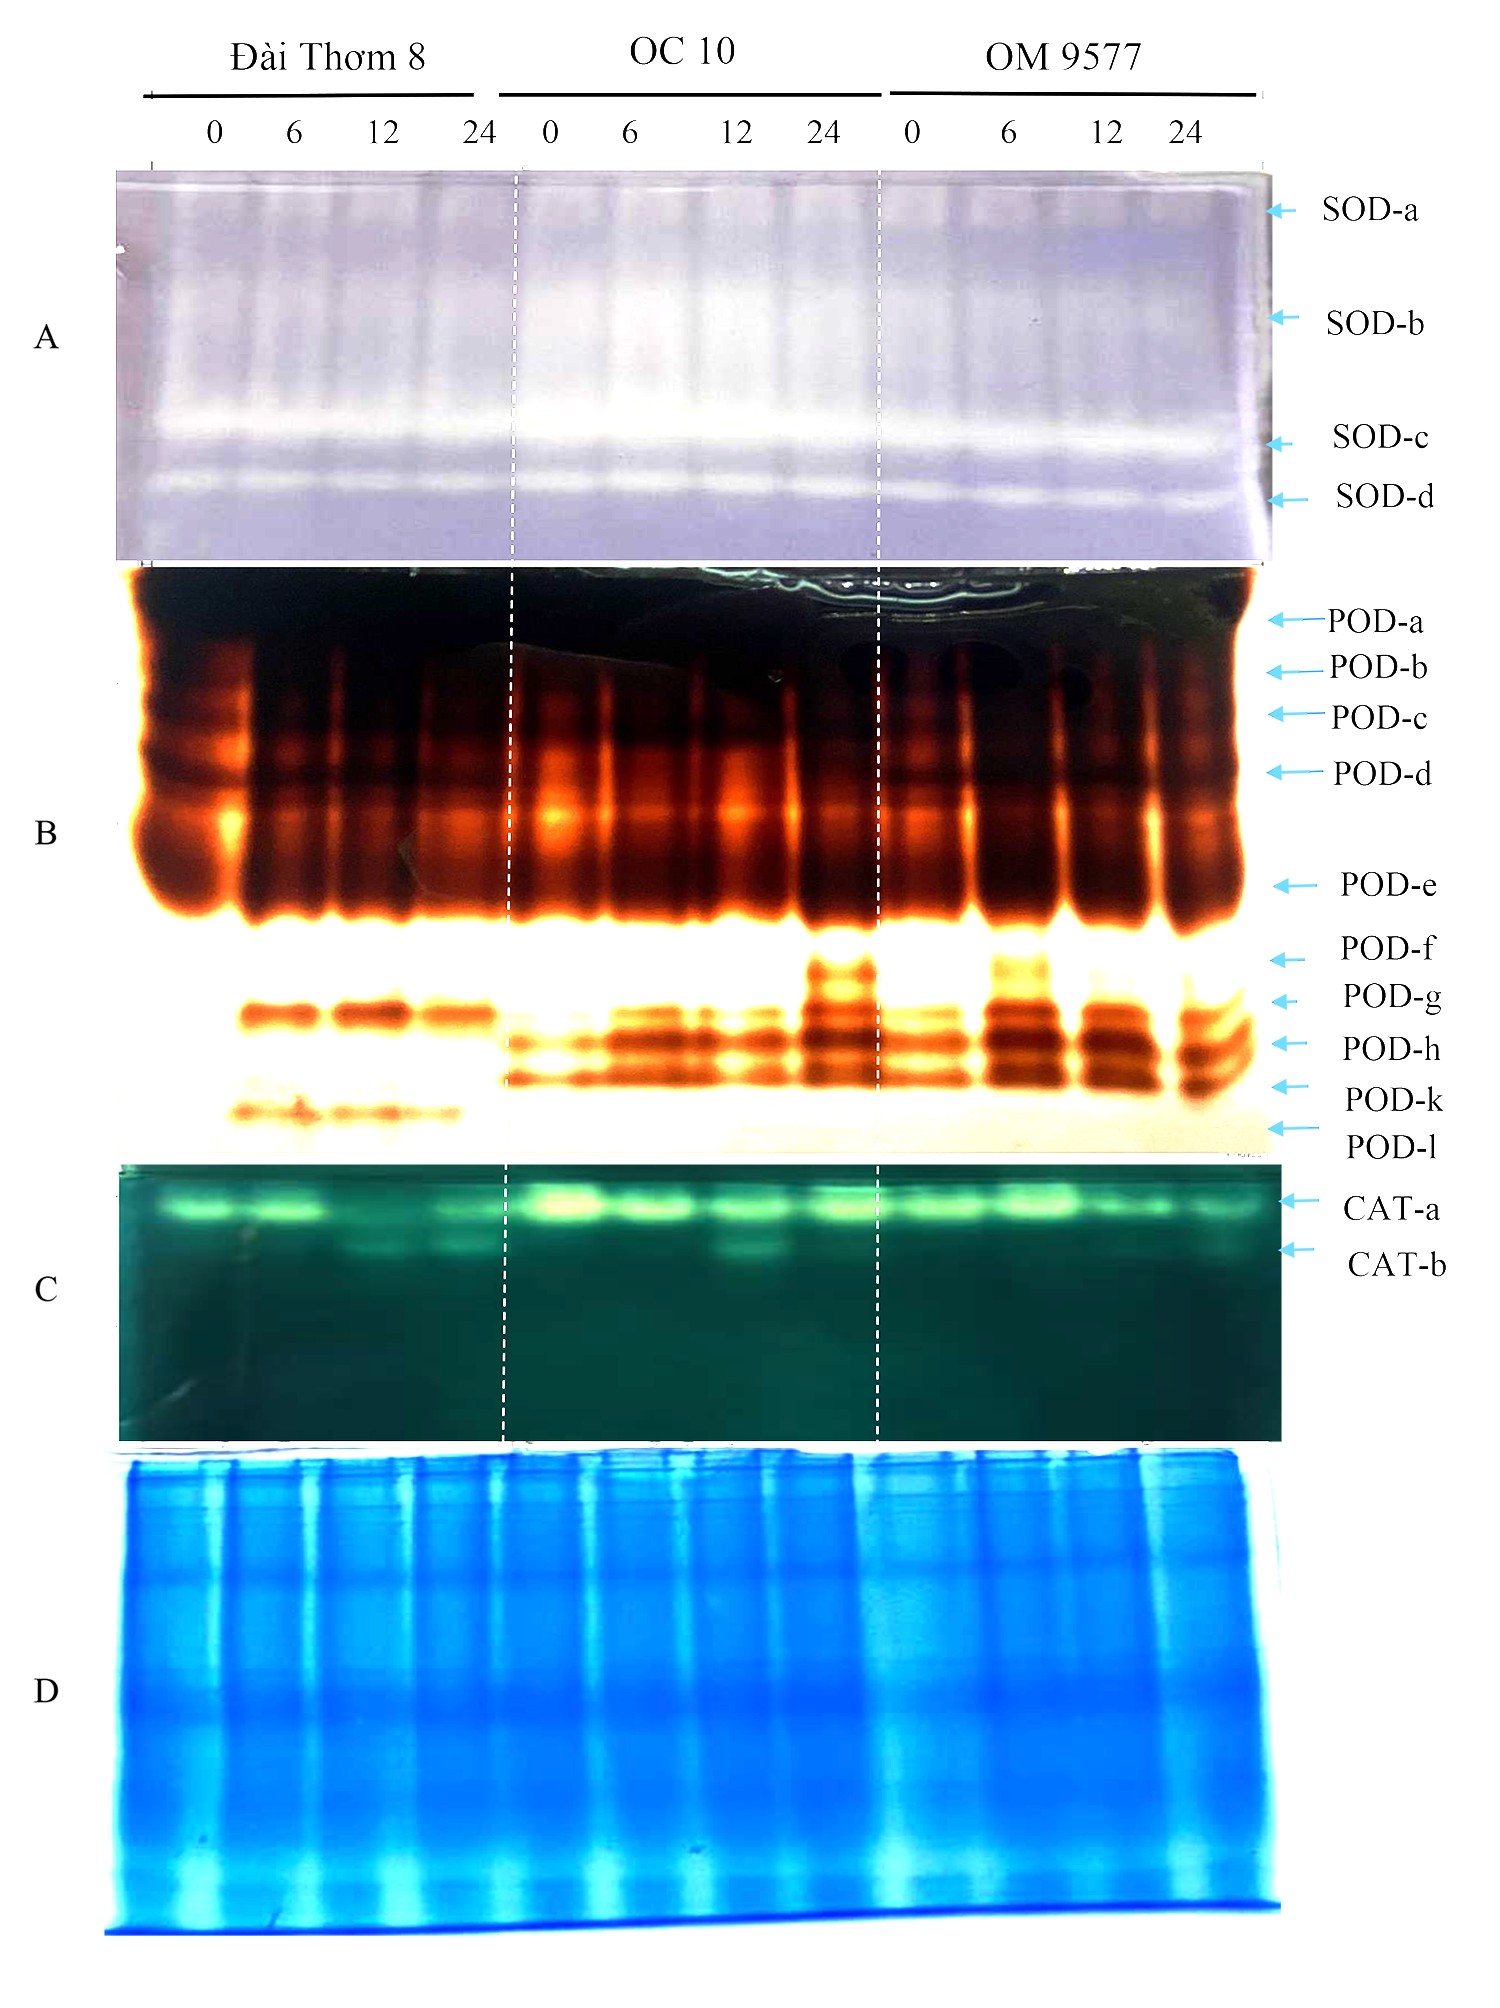
In the case of POD, ten isoforms were identified in the rice roots (Figure 4B). Specifically, POD-a, POD-b, POD-c, and POD-e were present in all three rice cultivars, with increased activity at six, 12, and 24 hours. POD-d was found in Dai Thom 8 and OM 9577 but not in OC 10. POD-f was absent in Dai Thom 8 but present in OC 10 and OM 9577. POD-g was detected in most rice cultivars, showing the strongest enhancement at six, 12, and 24 hours in OM 9577 and at 24 hours in OC 10. POD-h and POD-k were not observed in the Dai Thom 8 rice cultivar but were present in the OC 10 and OM 9577 rice cultivars. Additionally, POD-l did not appear in OM 9577 and OC 10 but was present only in Dai Thom 8.
As for CAT, two isoforms were identified in the rice roots, namely CAT-a and CAT-b (Figure 4C). CAT-a was present in all three rice cultivars, with Dai Thom 8 showing an increase in CAT-a activity at six hours, followed by a decrease at 12 and 24 hours, while OC 10 exhibited an increased activity. In OM 9577, CAT-a activity increased from six to 24 hours, with the most obvious increase observed at six hours. CAT-b was detected in all three rice cultivars but was absent at zero hour and six hours, only appearing at 12 hours and 24 hours.
. DPPH and ABTS+ free radicals
The DPPH free radical scavenging ability varied significantly among the different rice cultivars (Table 2). The lowest DPPH free radical scavenging percentage was observed in Dai Thom 8 (41.95%) and IR 29 (42.49%), followed by OC 10 (55.38%). In turn, Pokkali and OM 9577 displayed the highest percentages of DPPH free radical scavenging (62.81% and 60.11%, respectively). When exposed to NaCl concentrations ranging from 50 mM to 100 mM, Pokkali, OM 9577 and OC 10 showed an increase in DPPH free radical scavenging activity. However, the percentage of DPPH free radical scavenging decreased in these cultivars at the concentration of 150 mM NaCl. On the contrary, IR 29 and Dai Thom 8 exhibited a decrease in the DPPH radical scavenging percentage at the concentration of 100 mM NaCl.
Table 2
Effect of NaCl on DPPH and ABTS+ scavenging ability of five rice cultivars.
Regarding the ABTS+ free radical scavenging, there were significant variations among the rice cultivars (Table 2). At a NaCl concentration of 100 mM, the percentage of ABTS+ free radical scavenging in Pokkali (63.714%), OM 9577 (49.108%), and OC 10 (48.8263%) was 1 to 2 times higher than that of IR 29 (30.256%) and Dai Thom 8 (40.699%). Moreover, the percentage of ABTS+ free radical scavenging in the IR 29 and Dai Thom 8 samples, which were treated with the 150 mM NaCl concentration, decreased to 0.69 and 0.83 times, respectively, compared to those exposed to 0 mM NaCl.
. Gas Chromatography–Mass Spectrometry (GC–MS) analysis
The results revealed the presence of several sugars in the roots of the three rice cultivars (Figure 5 and Table 3). The content percentages of seven sugars were determined as follows: lyxopyranose ranging from 16.52% to 17.34%, β-D-ribopyranose ranging from 27.38% to 31.88%, a-l-sorbopyranose ranging from 5.784% to 6.399%, d-mannitol ranging from 3.234% to 3.790%, d-galactofuranose ranging from 1.303% to 1.555%, β-D-galactopyranose ranging from 1.920% to 2.357%, and β-D-fructopyranose ranging from 1.383% to 1.587%. Notably, OM 9577 exhibited higher content percentages of six sugars compared to OC 10 and Dai Thom 8. These sugars were identified as d-lyxofuranose (3.268%), a-D-xylopyranose (5.727%), mannopyranose (12.86%), α-D-glucopyranose (6.399%), β-D-glucopyranose (5.509%), and D-arabinose (1.512%).
Figure 5
Results chromatogram of sugars of the rice samples: Dai Thom 8 rice cultivar (A), OC 10 rice cultivar (B), OM 9577 rice cultivar (C).
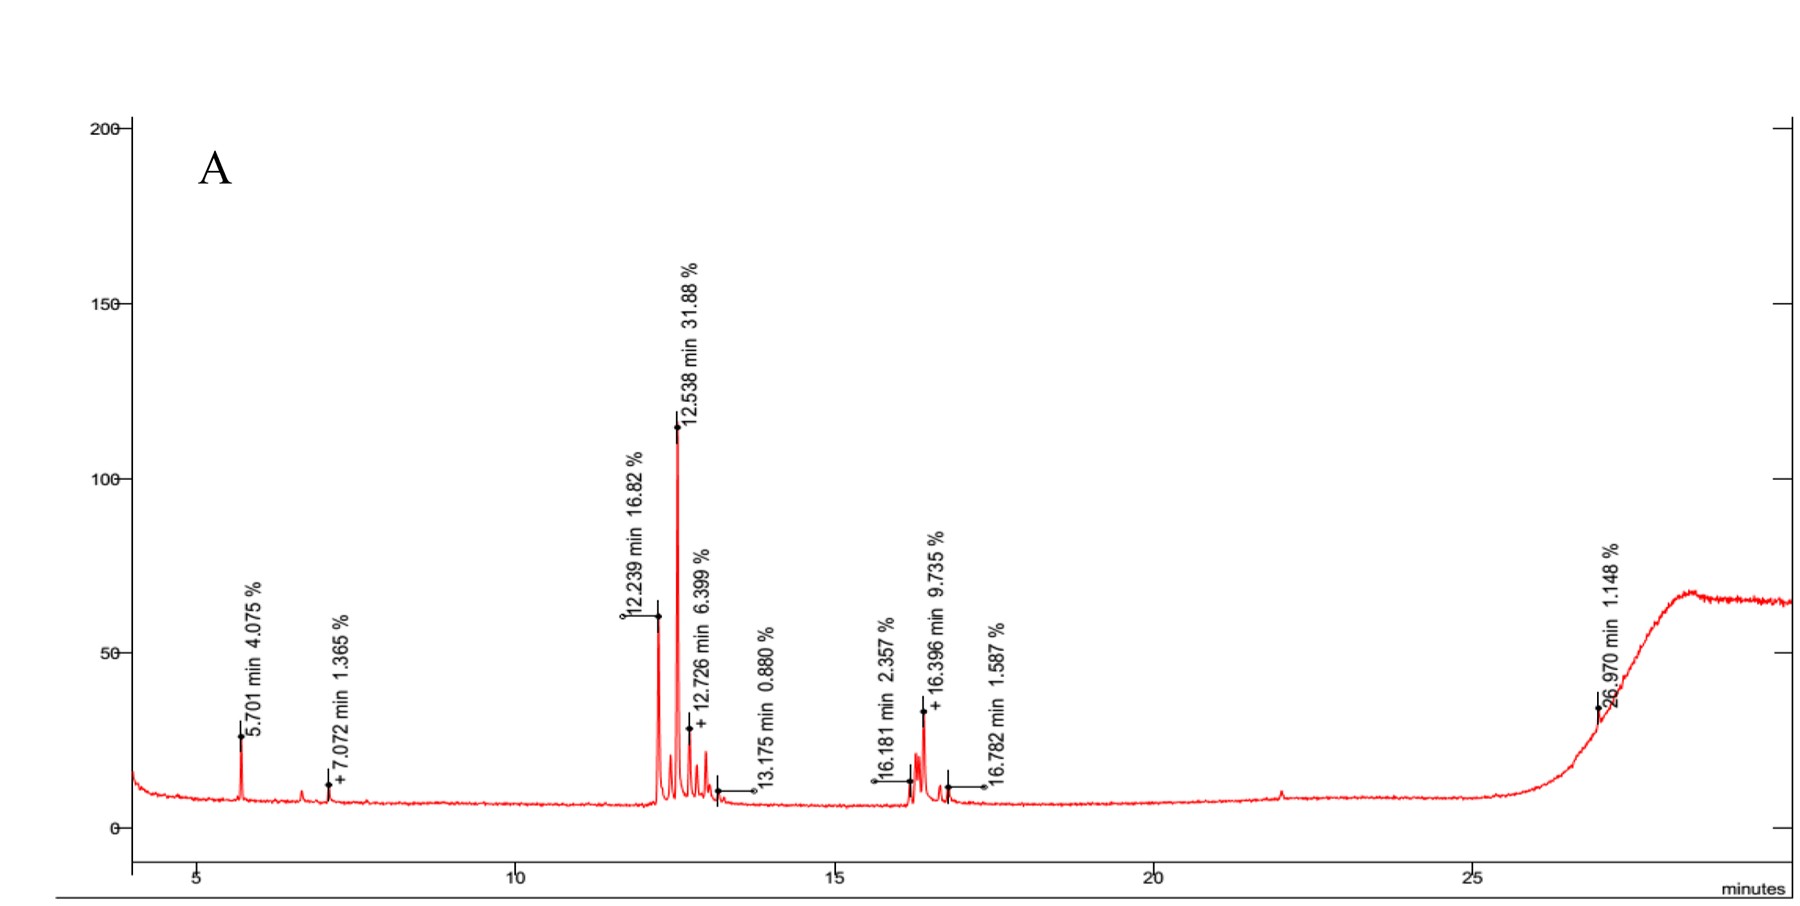
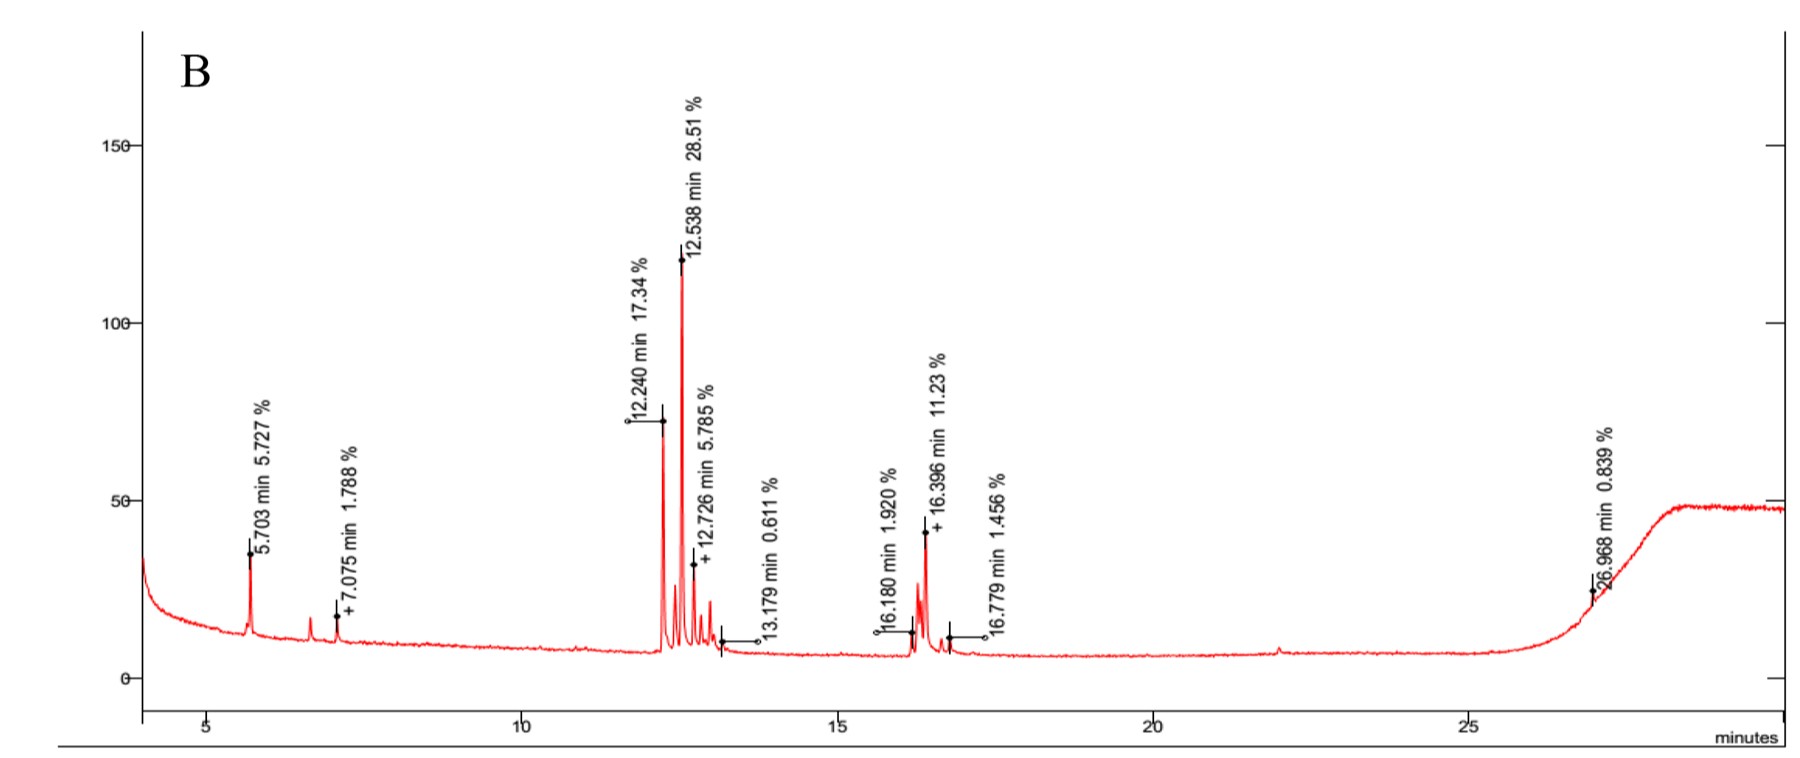
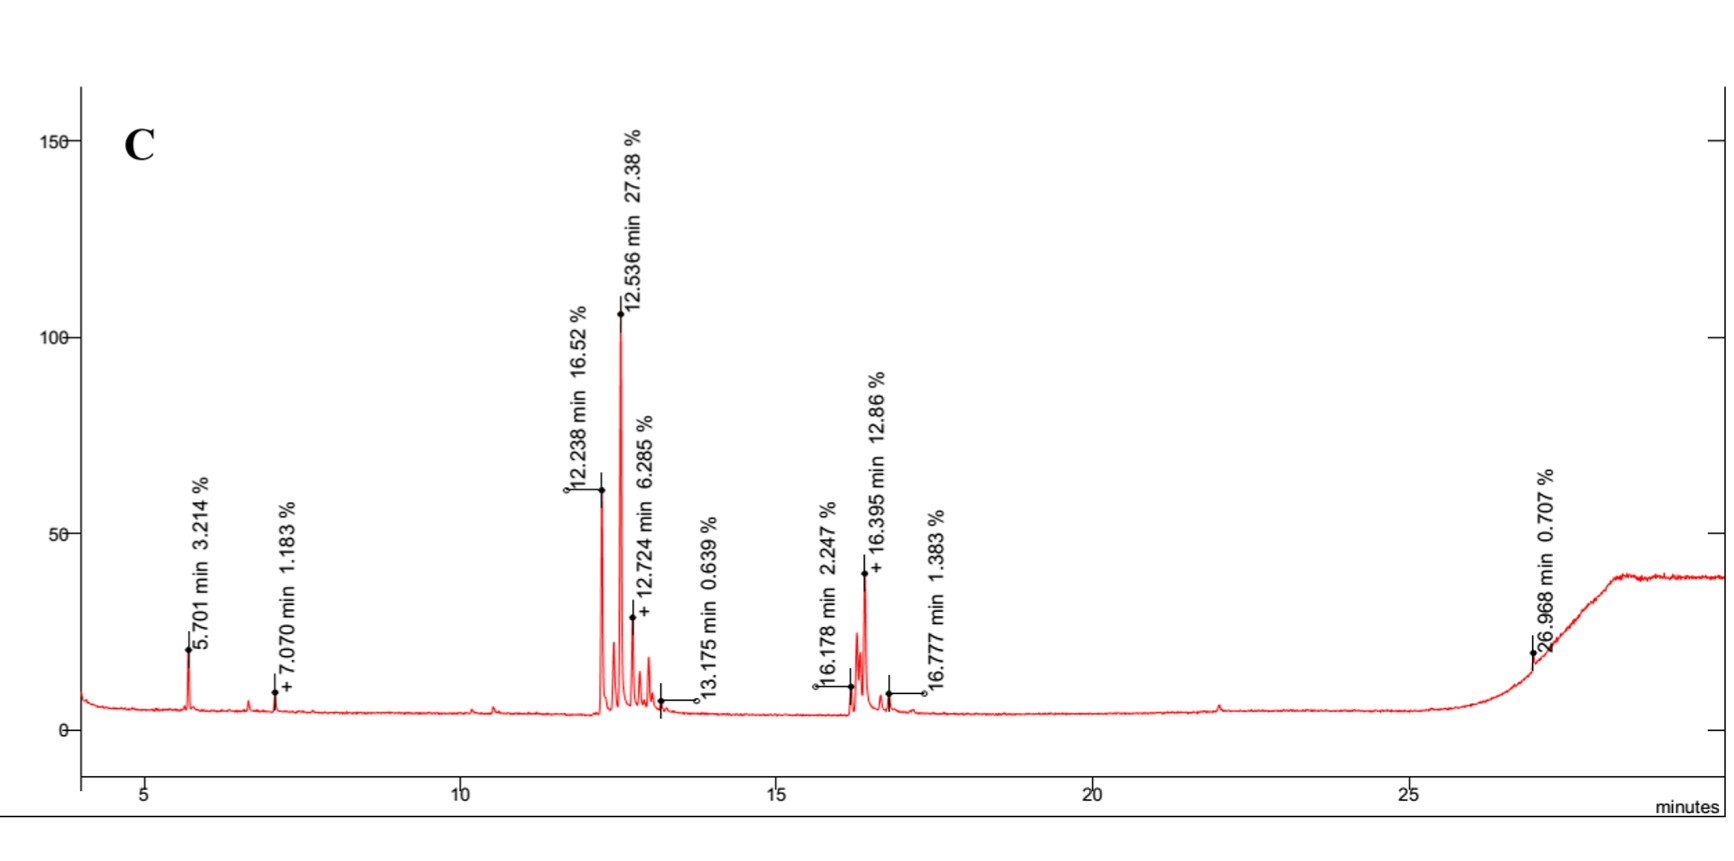
Table 3
Composition of rice roots by GC-MS after derivatization and content (%) of substances.
. Amino acid analysis
The quantification of 25 free amino acids using HPLC-DAD revealed significant variations in the total free amino acid content among the five rice cultivars (Table 4). OC 10 exhibited the highest content of free amino acids (1228.69 µg/g), followed by OM 9577 (1041.98 µg/g) and Pokkali (1094.65 µg/g). In contrast, IR 29 showed the lowest content (588.21 µg/g), while Dai Thom 8 had a slightly higher content (900.86 µg/g). The 25 free amino acids were categorized into three groups based on their accumulation in the rice roots in response to salinity stress (Table 4). Notably, group I did not appear in any of the five rice root samples in the salt stress conditions. Group II comprised amino acids with low content ranging from 2 µg/g to 40 µg/g, with arginine being the most prominent with a concentration of 42.56 µg/g, predominantly found in Dai Thom 8 (42.56 µg/g) and IR 29 (14.73 µg/g). The content of the remaining six amino acids in group II did not differ among the five rice cultivars. Group III encompassed 11 amino acids with relatively high content, ranging from 50 µg/g to 228 µg/g. The results indicated that group III, with the high amino acid content, was primarily concentrated in Pokkali and OM 9577, followed by OC 10 and, finally, by IR 29 and Dai Thom 8.
Table 4
The content of free amino acids in the roots of five rice cultivars.
. Discussion
Rice is a salt-sensitive crop because it is a glycophyte. Therefore, excess salt severely affects rice growth (Thorat et al., 2018). Studying the morphological and physiological aspects allows us to observe how plants respond to NaCl stress (Ghosh et al., 2016). In this research, five rice varieties representing different levels of salt tolerance were examined to serve as comparative models for understanding physiological and biochemical responses to NaCl stress. The findings from our morphological analysis revealed that salinity stress significantly affects the growth rate of both roots and shoots (Figure 1). Notably, the salt-sensitive rice cultivars (IR 29 and Dai Thom 8) were more affected than the salt-tolerant (OM 9577 and Pokkali) and moderately salt-tolerant (OC 10) rice cultivars. These findings align with previous research studies (Ngoc et al., 2022) showing that salt stress reduces morphological parameters like root and shoot lengths in rice (Amirjani, 2011; Chang et al., 2019; Ngoc et al., 2022; Uddin et al., 2021). Consequently, it becomes essential to further explore the differences in salinity tolerance among the five rice varieties in terms of their physiological and biochemical characteristics.
The results from the physiological and biochemical analysis demonstrated that the salt-tolerant rice cultivars (OM 9577 and Pokkali) and the moderately salt-tolerant rice cultivar (OC 10) were less affected by salinity than the salt-sensitive rice cultivars (IR 29 and Dai Thom 8). This was manifested via the lower lipid peroxidation in the salt-tolerant samples. Furthermore, the salt-tolerant cultivar exhibited less cell membrane damage, lower generation of reactive oxygen species, and more efficient free radical scavenging activity compared to the salt-susceptible cultivar. These results are consistent with earlier studies (Amirjani, 2011; Chang et al., 2019; Kong-ngern et al., 2012; Ngoc et al., 2022; Pongprayoon et al., 2019), which demonstrated that as the NaCl concentration rose, rice plants lost their capacity to control and steadily accumulated higher levels of hydrogen peroxide and superoxide. This leads to a significant alteration in physiological and biochemical processes in rice (Ghosh et al., 2016). In this study, the determination of antioxidant enzyme activity and enzyme analysis (CAT, POD, and SOD) on native polyacrylamide gel electrophoresis (Native-PAGE) showed that the antioxidant enzyme activity of the salt-tolerant rice cultivars (Pokkali and OM 9577) and the moderately salt-tolerant rice cultivar (OC 10) was higher than that of the salt-sensitive rice cultivars (Dai Thom 8 and IR 29). Since these enzymes have many isomers, the enzyme activity is constantly enhanced and stable for a long time. Our research revealed that, under NaCl stress, the salt-tolerant rice cultivars (OM 9577 and Pokkali) and the moderately salt-tolerant rice cultivar (OC 10) produced less H2O2 than the salt-sensitive cultivars (Dai Thom 8 and IR 29) (Figure 3A). H2O2 is related to POD and CAT activity regulation, which aids in H2O2 removal. The O2∙− content in the salt-sensitive rice cultivars (Dai Thom and IR 29) was higher than that in the salt-tolerant rice cultivars (Pokkali and OM 9577) and in the moderately salt-tolerant rice cultivar (OC 10) (Figure 3B). The O2∙− content is involved in the regulation of SOD enzyme activity. The presence and increased levels of CAT, POD, and SOD contributed to the lower accumulation of H2O2 and O2∙− in OC 10 and OM 9577 compared to Dai Thom 8 (Table 1, Figure 3 and Figure 4). These findings align with previous research studies (D. H. Lee et al., 2001; Ngoc et al., 2022) showing that the activity of SOD, POD, and CAT enzymes is essential for maintaining oxidative balance in rice roots under saline stress (Amirjani, 2011; Chakraborty & Bhattacharjee, 2015; Kong-ngern et al., 2012; Ngoc et al., 2022; Pongprayoon et al., 2019). Enzymes like CAT, SOD, and POD are crucial in removing reactive oxygen species in salt-tolerant rice species. Therefore, they are one of the important markers in studies of the NaCl stress response mechanism (Bhowmik et al., 2021).
In plants, the response to oxidative balance under both biotic and abiotic stresses is a complex process regulated by a variety of non-enzymatic and enzymatic antioxidants (Ghosh et al., 2016). To assess the removal of reactive oxygen species through a chain-breaking mechanism and measure non-enzymatic antioxidants, stable free radicals in methanol, such as DPPH and ABTS+, are employed (Chakraborty & Bhattacharjee, 2015). Our study revealed that the salt-tolerant rice cultivars (Pokkali and OM 9577) and the moderately salt-tolerant cultivar (OC 10) exhibited higher percentages of ABTS+ and DPPH free radical scavenging compared to the salt-sensitive cultivars (IR 29 and Dai Thom 8). These findings are in line with several previous studies (Banik & Bhattacharjee, 2020; Chakraborty & Bhattacharjee, 2015) indicating that salt-tolerant rice cultivars possess superior antioxidant retention and capture higher rates of free radicals compared to salt-sensitive ones. These antioxidants effectively scavenge ABTS+ and DPPH radicals by forming reduced forms, mainly originating from specific non-enzymatic compounds present in plant tissues (Chakraborty & Bhattacharjee, 2015).
In response to salt stress, various non-enzymatic biochemical compounds, including sugars and amino acids, act as effective osmotic and antioxidant defenses in plants (Chang et al., 2019; Y. Chen et al., 2021). The analysis and identification of specific sugars are crucial when studying the mechanisms of salt stress response, since sugars serve as indicative markers of characteristic biochemical changes (Amirjani, 2011; Chang et al., 2019; Fu et al., 2018; W.-S. Wang et al., 2016; Zhao et al., 2014). In our study, we employed GC–MS to identify 13 types of sugars in rice roots under NaCl stress (Figure 5 and Table 3). Among these sugars, β-D-ribopyranose, lyxopyranose, and β-D-mannopyranose were found in the highest concentrations, with β-D-mannopyranose showing significant differences among the rice varieties under NaCl stress. Additionally, six sugars, including d-lyxofuranose, a-D-xylopyranose, β-D-mannopyranose, α-D-glucopyranose, β-D-glucopyranose, and D-arabinose, were present in higher concentrations in OM 9577 compared to OC 10 and Dai Thom 8 (Table 3). These sugars were hallmark biochemical markers in this study, because they play a crucial role in the salt stress response and could be potential target metabolites for salt-tolerant cultivars. Although our analyzed biochemical markers were consistent with many previous studies, each study exhibited characteristic biochemical indicators corresponding to different rice varieties (Arif et al., 2020; Chang et al., 2019; Fu et al., 2018; Goharrizi et al., 2021; W.-S. Wang et al., 2016; Zhao et al., 2014). For example, Goharrizi et al. (2021) reported that salt stress significantly altered the accumulation of various carbohydrates, including sucrose, glucose, mannose, galactose, erythrose, sorbose, and xylose. Chang et al. (2019) employed GC–MS to determine some sugars in the roots of three rice varieties (Dendang, Fatimawati, and Nipponbare) in response to NaCl stress. Trehalose, raffinose, sucrose, and mannitol are significant markers. Fu et al. (2018) identified sugars in rice roots using GC-TOF/MS and found that lyxose, galactose, fructose, mannose, lactose, and ribose accumulated under NaCl stress (100 mM and 150 mM). Similarly, W.-S. Wang et al. (2016) identified specific sugars (glucose, raffinose, fructose, and fructofuranose) that were particularly associated with certain primary metabolites in plant cells responding to NaCl stress. Physiologically, sugars may act as compatible solutes in plant cell fluids during the salt stress response, enhancing cell fluid permeability in roots to prevent water loss and protect proteins from denaturation caused by salt (Chang et al., 2019).
In salt stress conditions, specific metabolites have an impact on 20 metabolic pathways, including phenylalanine, tyrosine, tryptophan biosynthesis, alanine metabolism, aspartic acid, glutamic acid, and the TCA cycle (Chen et al., 2021). Through the HPLC-DAD method, we identified 25 free amino acids in the roots of the five rice varieties; however, only 20 of them were detected. Among them, group II was represented by high levels of amino acids such as phenylalanine, tyrosine, threonine, and glycine, mainly in the salt-tolerant rice varieties. Notably, in the salt-tolerant rice varieties (OM 9577, Pokkali, and OC 10), there was significant accumulation of amino acids from group III, which play a crucial role in differentiating the salt tolerance mechanisms among these rice varieties. These amino acids include serine, valine, isoleucine, ornithine, histidine, glutamic acid, asparagine, alpha-alanine, aspartic acid, glutamine, and especially proline. Similar findings were reported by Arif et al. (2020), showing changes in amino acid levels in response to salinity in plants. Some amino acids, such as phenylalanine, methionine, ornithine, glutamate, dihydroxy isoleucine, L-methionine, L-homomethionine, 3-methoxytyramine, tetra-homomethionine, 1-(3-aminopropyl)-4-aminobutanal, feruloylagmatine, and methionine derivatives, increased under salt stress. Goharrizi et al. (2021) reported that osmotic protective amino acids such as proline, glutamate, aspartate, isoleucine, glycine, GABA, phenylalanine, tryptophan, and alanine accumulate as a result of amino acid metabolism. Moreover, Fu et al. (2018) identified 18 amino acids in rice roots exposed to NaCl stress using GC-TOF/MS, with the greatest accumulation of tyrosine, phenylalanine, isoleucine, valine, beta-alanine, cycloleucine, citrulline, ornithine, threonine, and methionine. It is worth noting that citrulline was present at in high levels in a study conducted by Fu et al. (2018), which was not detected in our analyses. Amino acids from group III have been demonstrated to play vital roles in various plant processes in response to salt stress, including osmotic balance, oxidative balance, participation in the synthesis of other amino acids, and involvement in regulatory pathways and cell cycles (Zhang et al., 2020). According to Farooq et al. (2023), proline is one of the key compatible osmolytes under salt stress, which aids in rice salinity tolerance. As a consequence, it is no surprise that the salt-tolerant cultivar (OM 9577) possessed the highest proline content, followed by the OC 10 and Dai Thom 8 cultivars (Table 4). In a previous study, a correlation between branched-chain amino acid aminotransferase genes, the key enzymes for biosynthesis of branched-chain amino acids such as leucine, isoleucine, valine, and pantothenate as well as CoA biosynthesis pathways to adapt under salt stress has been demonstrated (Wang et al., 2020). In this study, the highest isoleucine content was detected in OM 9577, followed by OC 10 and Dai Thom 8 (moderately salt-tolerant and salt-sensitive cultivars, respectively). This implies a relationship between isoleucine and the underlying mechanism for salinity tolerance in rice cultivars. In addition, our study specifically highlighted the presence of glutamine, glutamic acid, aspartic acid, asparagine, serine, and ornithine in high concentrations, acting as crucial precursors for synthesizing other amino acids. Glutamine and glutamate serve as precursors for the synthesis of amino acids such as purine, pyrimidine, ornithine, citrulline, arginine, proline, and asparagine (Wu, 2009). Aspartate is a common precursor for essential amino acids like lysine, threonine, methionine, and isoleucine in plants (Azevedo et al., 2006). Additionally, aspartic acid serves as a precursor for several other amino acids, including arginine, methionine, threonine, and isoleucine. Increased levels of aspartic acid and asparagine indicate higher isoleucine content (Haque & Matsubara, 2018). Ornithine acts as a precursor for the synthesis of proline, glutamate, and polyamines (ÇAvuşoğlu & ÇAvuşoğlu, 2021). Serine, on the other hand, is an essential amino acid involved in the synthesis of purine, pyrimidine, ceramide, and protein (Wu, 2009). Consequently, amino acids serve as precursors, along with specific sugars (Sami et al., 2016), present at relatively high concentrations (Azevedo et al., 2006; ÇAvuşoğlu & ÇAvuşoğlu, 2021; Wu, 2009), and play a key role in promoting the rapid and efficient synthesis of amino acids (proline, isoleucine, histidine, alpha-alanine, and valine) in rice roots when responding to NaCl stress. In conclusion, amino acids (serine, valine, isoleucine, ornithine, histidine, glutamic acid, asparagine, alpha-alanine, aspartic acid, glutamine, and proline), along with antioxidant enzymes (CAT, SOD, and POD), and certain sugars (d-lyxofuranose, a-D-xylopyranose, β-D-mannopyranose, α-D-glucopyranose, β-D-glucopyranose, and D-arabinose), serve as essential indicators in rice roots when faced with NaCl stress. These factors play a significant role in enhancing and maintaining the salt tolerance observed in the salt-tolerant rice cultivars (OM 9577 and Pokkali) and the moderately salt-tolerant rice cultivar (OC 10) in contrast to the salt-sensitive rice cultivars (IR 29 and Dai Thom 8).
. Conclusion
In summary, salt stress induces significant alterations in the physiological and biochemical characteristics of rice roots. It leads to decreased shoot and root lengths, increased accumulation of reactive oxygen species and membrane lipid peroxidation, and enhanced free radical scavenging activity. Among the five rice cultivars, OM 9577 exhibited the highest accumulation of 13 sugars and 18 free amino acids, particularly displaying the highest proline content. OC 10 accumulated 13 sugars, including crucial ones in the salt stress response mechanism, e.g., glucose and mannose, along with 18 free amino acids. In turn, Dai Thom 8 had fewer amino acids, sugars, and enzyme activity compared to the OM 9577 and OC 10 rice cultivars. The results indicated significant variations in sugars (d-lyxofuranose, a-D-xylopyranose, β-D-mannopyranose, α-D-glucopyranose, β-D-glucopyranose, and D-arabinose), amino acids (serine, valine, isoleucine, ornithine, histidine, glutamic acid, asparagine, alpha-alanine, aspartic acid, glutamine, and proline), and antioxidant enzyme activity (CAT, SOD, and POD) among the rice cultivars. These differences serve as crucial direct and indirect indicators involved in the mechanism of response to salinity stress. Consequently, these factors hold potential as biochemical markers for selecting salt-tolerant rice cultivars or for enhancing rice cultivars through hybridization or transgenic approaches.
