. Introduction
Soybean (Glycine max L. Merrill) is one of the most important oilseed crops in the world as it is a grain legume of considerable dietetic, industrial, medicinal, and economic importance. It belongs to the family Leguminosae syn. Fabaceae, subfamily Papilionoideae, and genus Glycine. It is one of the world’s major crops, meeting 59% of global demand for oil seed production and 69% of protein meal consumption (SoyStats, 2020). Soybean is widely known to be cheap, readily available, and a good source of rich and cheap protein compared with expensive animal protein and other nutrients resulting in a rapid increase in its demand in the last decade (Dairyglobal.net, 2021). In order to meet this demand, various modern agricultural methods are being employed that can increase yield per unit area; these include various chemical treatments (Agarwal et al., 2013; Henry et al., 2011). Amongst the chemicals effectively used to enhance crop plant growth and production, strobilurin F500 (Pyraclostrobin-Headline®;) is a compound known to enhance growth and yield in soybean (Joshi et al., 2014). Although, its impact on antioxidant enzymes and photosynthesis is still not fully understood.
Pyraclostrobin, a strobilurin fungicide initially developed to control fungal pests, showed growth-promoting and yield-enhancing qualities on crop plants under field conditions (Kanungo & Joshi, 2014). Field trials using pyraclostrobin on healthy plants confirmed these observations on plants like fenugreek, wheat, and barley (Köehle et al., 2003; Sharma et al., 2015; Venancio et al., 2003). Cereals treated with pyraclostrobin showed significant enhancement in production, greater than those due only to its fungicidal effect (Köehle et al., 2003). Further, strobilurin treatment was found to enhance nitrate assimilation in wheat (Köehle et al., 2002; Ruske et al., 2003) as well as to enhance the net rate of photosynthesis in the treated leaves (Grossmann et al., 1999; Häuser-Hahn et al., 2004; Köehle et al., 1997b; Oerke et al., 2005). Some studies reported retention of higher chlorophyll content after strobilurin application resulting in an extension of the life of flag leaf (Habermeyer et al., 1998; McCartney et al., 2007). Changes in hormonal balance, water conservation, and delayed senescence are some of the positive physiological changes observed after applying strobilurins, which have been associated with higher yield (Vincelli, 2002). For example, wheat and soybean, when treated with strobilurins, yielded better than untreated (Butkutė et al., 2008; Ruske et al., 2003; Swoboda & Pedersen, 2009). Also, it has been reported that pyraclostrobin can cause physiological changes in plants, i.e., increased leaf greenness, chlorophyll content, photosynthetic rate, water use efficiency, and delayed senescence (Bryson et al., 2000). In addition, pyraclostrobin, in combination with epoxiconazole, increased carbon assimilation under water stress in field crops like maize and soybean (Kanungo et al., 2021; Sulewska et al., 2019). These observations related to photosynthesis indicate a higher amount of carbon fixation by the strobilurin application.
Our previous study reported enhancement in growth, nitrogen assimilation, and yield of soybean var. JS-335 (Joshi et al., 2014). In continuation of our investigation, the goal of the present study is to determine the effect of pyraclostrobin (F500) on carbon fixation and antioxidant defense system to decipher the mechanism underlying the increased growth and production of soybean.
. Material and methods
. Plant material and treatments
Seeds of soybean var. JS-335 were obtained from the Directorate of Soybean Research, Indore (M.P.), India. The experiment was conducted in a randomized block design with triplicates of five bags per treatment. The seeds were sown in plastic bags (34 cm H × 34 cm B; filled with a mixture of sand, soil, and manure -1:4:1) and kept under field conditions. Before sowing, seeds were inoculated with a slurry of Rhizobium japonicum (Bradyrhizobium japonicum, MTCC 10751) at 3 g/kg seeds. Ten seeds of uniform size were sown in each bag. A week after germination, thinning was done to two plants per bag. Field experiments under natural sunlight were conducted in the botanical garden of the School of Life Sciences, Indore (22°4′N and 75°50′E), India, from August to November 2014. The plants were watered as needed, and weeds were controlled manually.
Pyraclostrobin (F500) was sprayed on the leaves on the 10th and 20th DAE (days after emergence) using 0.05%, 0.1%, 0.25%, 0.5%, and 1% concentrations, and unsprayed plants served as control. Samples were taken on the 45th DAE for collection of the data. Each experiment was done in triplicates of five plants from each treatment. We used disease-free healthy plants for our experiments, and no disease was detected in untreated plants during our field experiments.
. Chemical details
Common name: Pyraclostrobin. A formulation of F 500 (BAS 500 F) containing 20% (w/w) active ingredient was provided by BASF Inc. (Limburgerhof, Germany).
. Biomass analysis
Fresh mass of plants was taken after removing roots. To obtain dry mass, plants were dried in an oven at 60 °C for 72 hours and weighed on an analytical balance.
. Photosynthetic pigments
The total chlorophyll and carotenoid contents were determined (using 50 mg of fresh tissue from a fully expanded third leaf from the top) by the dimethyl sulfoxide (DMSO) method (Hiscox & Israelstam, 1979). Absorbance was taken at 480, 649, and 665 nm using Shimadzu UV/VIS 1601 spectrophotometer (Kyoto, Japan). The data were calculated as per the equation of Wellburn (1994).
. Chl fluorescence measurements
Chlorophyll a (Chl a) fluorescence transients exhibited by dark-adapted (30 min) leaf (fully expanded third leaf from the top on the 45th DAE) were measured using a Handy PEA fluorimeter (Plant Efficiency Analyzer, Hansatech Instruments, King’s Lynn, Norfolk, UK). A standard protocol of 30 min dark adaptation was used (Strasserf et al., 1995). All the measurements were recorded at 25 ± 1 °C. The Chl a fluorescence transient recorded, when plotted on a logarithmic scale, clearly showed polyphasic fluorescence rise kinetics (O-J-I-P phases). OJIP transient was analyzed according to the JIP test, and parameters were calculated as Strasser et al. (2000) described using the software ‘Biolyzer HP 3’ (the chlorophyll fluorescence analyzing program by Bioenergetics Laboratory, University of Geneva, Switzerland).
. Carbonic anhydrase
Carbonic anhydrase (CA) activity was determined by the method described by Li et al. (2004). The CA activity was determined by measuring the pH decrease at 0 to 2 °C with a pH electrode. Enzyme activity was defined as 1 unit = 10 (To − T)/T, where T and To represent the time(s) needed for a pH decrease from 8.25 to 6.45, with and without enzyme, respectively.
. Gas exchange measurements
Photosynthetic parameters like rate of photosynthesis (µmol CO2 m−2 s−1), internal CO2 concentration (µmol CO2 mol−1), stomatal conductance (mol H2O m−2 s−1), and transpiration rate (mmol H2O m−2 s−1) of the leaves (fully expanded third leaf from the top on the 45th DAE) were measured by a portable infra-red gas analyzer (IRGA-LI-6400, LI-COR Inc., Lincoln, USA). Measurement was done in intact plants growing under field conditions. On clear days at noon, photosynthetic photon flux density (PPFD) was 1300–1600 µmol m−2 s−1, airflow (500 µmol s−1), and CO2 concentration (350–380 ppm). The measurements were recorded on sunny days between 9:00 a.m. and 11:00 a.m. under ambient conditions (from 30 to 35 °C temperature, 1200–1600 mM m−2 s−1 PAR at the leaf surface). IRGA was calibrated and zeroed approximately every 30 min during the measurement period. All parameters measured by IRGA were recorded three times for each treatment.
. Extraction and estimation of the antioxidant enzymes
To estimate the guaiacol peroxidase, 100 mg leaf tissue was crushed using a pre-chilled mortar and pestle in chilled 80% acetone at 4 °C. This extract was then centrifuged at 5000 rpm for 10 min. The supernatant was discarded, and the pellet was re-dissolved in 10 ml of 0.02 M phosphate buffer (pH 6.4) and again centrifuged at 10000 rpm for 15 min. This buffered supernatant was then used for the cytosolic peroxidase assay as described by Maehly (1955).
The ascorbic acid peroxidase enzyme was extracted by crushing 100 mg leaf tissue in a pre-chilled mortar with a cooled pestle in an extraction media (50 mM sodium phosphate buffer (pH 7.4), 1 mM EDTA, 1% PVP, and 1 mM ascorbic acid). This homogenate was then centrifuged at 12000 rpm for 20 min at 4 °C. The supernatant was filtered through two layers of Whatmann A-1 filter paper. The buffered filtrate acted as an enzyme extract. Ascorbate peroxidase activity was measured using the method described by Nakano and Asada (1987).
The superoxide dismutase (SOD) was extracted by homogenizing 100 mg of excised leaf tissue in 5 ml of chilled Tris HCl (50 mM, pH 7.8) consisting of 1% PVP and 1 mM EDTA. This homogenate was then centrifuged at 14000 rpm for 15 min. The resulting supernatant was used as an enzyme extract. The SOD activity was measured using the method described by Beauchamp and Fridovich (1971).
The crude enzyme extract for catalase estimation was made by grinding 100 mg soybean leaf tissues from each treatment in chilled 80% acetone in a mortar with pestle, centrifuging the homogenate at 10000 × g for 10 min at 5 °C. The supernatant was discarded, acetone evaporated at room temperature, and the pellet dissolved in 5 ml of sodium phosphate buffer (0.05 M, pH 7.0) and centrifuged at 20000 × g for 20 min at 5 °C. The supernatant was used for assaying the catalase enzyme and estimation of protein. Catalase was assayed using the method described by Aebi (1983).
Ascorbate was measured using 0.1 g of a tissue sample by the method described by Arakawa et al. (1981) and was determined according to Kataria et al. (2012). Ascorbate (ASA; the reduced form of ascorbate) and dehydroascorbate (DHA; the oxidized form of ascorbate) were measured based on the reduction of ferric to ferrous ions with ascorbic acid in acid solution followed by the formation of a red-chelate between ferrous ion and 2,2’-bipyridyl (Arakawa et al., 1981 with some modifications). Briefly, 0.1 g of tissue samples were powdered in liquid nitrogen and homogenized in 2 ml of ice-cold 5% TCA containing 4% (w/v) PVP-40. The homogenate was filtered through four layers of muslin cloth and centrifuged at 16000 × g for 15 min at 4 °C. The supernatant was used for the ASA and total ASA (DHA+ASA) assay. The reaction mixture for the ASA assay contained 20% ethanol, 4% TCA, 0.04% o-phosphoric acid-ethanol, 0.1% 2,2′-bipyridyl-ethanol, and 0.003% ferric chloride-ethanol. The reaction mixture was incubated at 30 °C for 90 min for the Fe2+-bipyridyl complex to develop, and the absorbance at 534 nm was recorded. Total ASA was determined by reducing DHA to ASA by dithiothreitol (DTT)-ethanol. After that 0.24% N-ethylmaleimide (NEM)-ethanol was added to the reaction mixture used for estimating ASA, and the absorbance of the color developed was recorded at 534 nm. DHA was measured from the difference between total ASA and reduced ASA values.
. Lipid peroxidation
Lipid peroxidation was estimated by measuring malondialdehyde (MDA) content spectrophotometrically. The MDA determination was carried out using 500 mg leaf tissue, according to the method of Heath and Packer (1968). The amount of malondialdehyde (A532–A600) was calculated from a calibration curve using malondialdehyde as a standard.
. Statistical analysis
Each experiment was performed in triplicates of five plants from each treatment. The data are expressed as mean ± SE and analyzed by the analysis of variance (one-way ANOVA) followed by post hoc Newman–Keuls Multiple Comparison Test (*P < 0.05, **P < 0.01, ***P < 0.001) using Prism 4 software (Graph Pad Software, Inc, La Jolla, CA, USA).
. Results
. Biomass accumulation
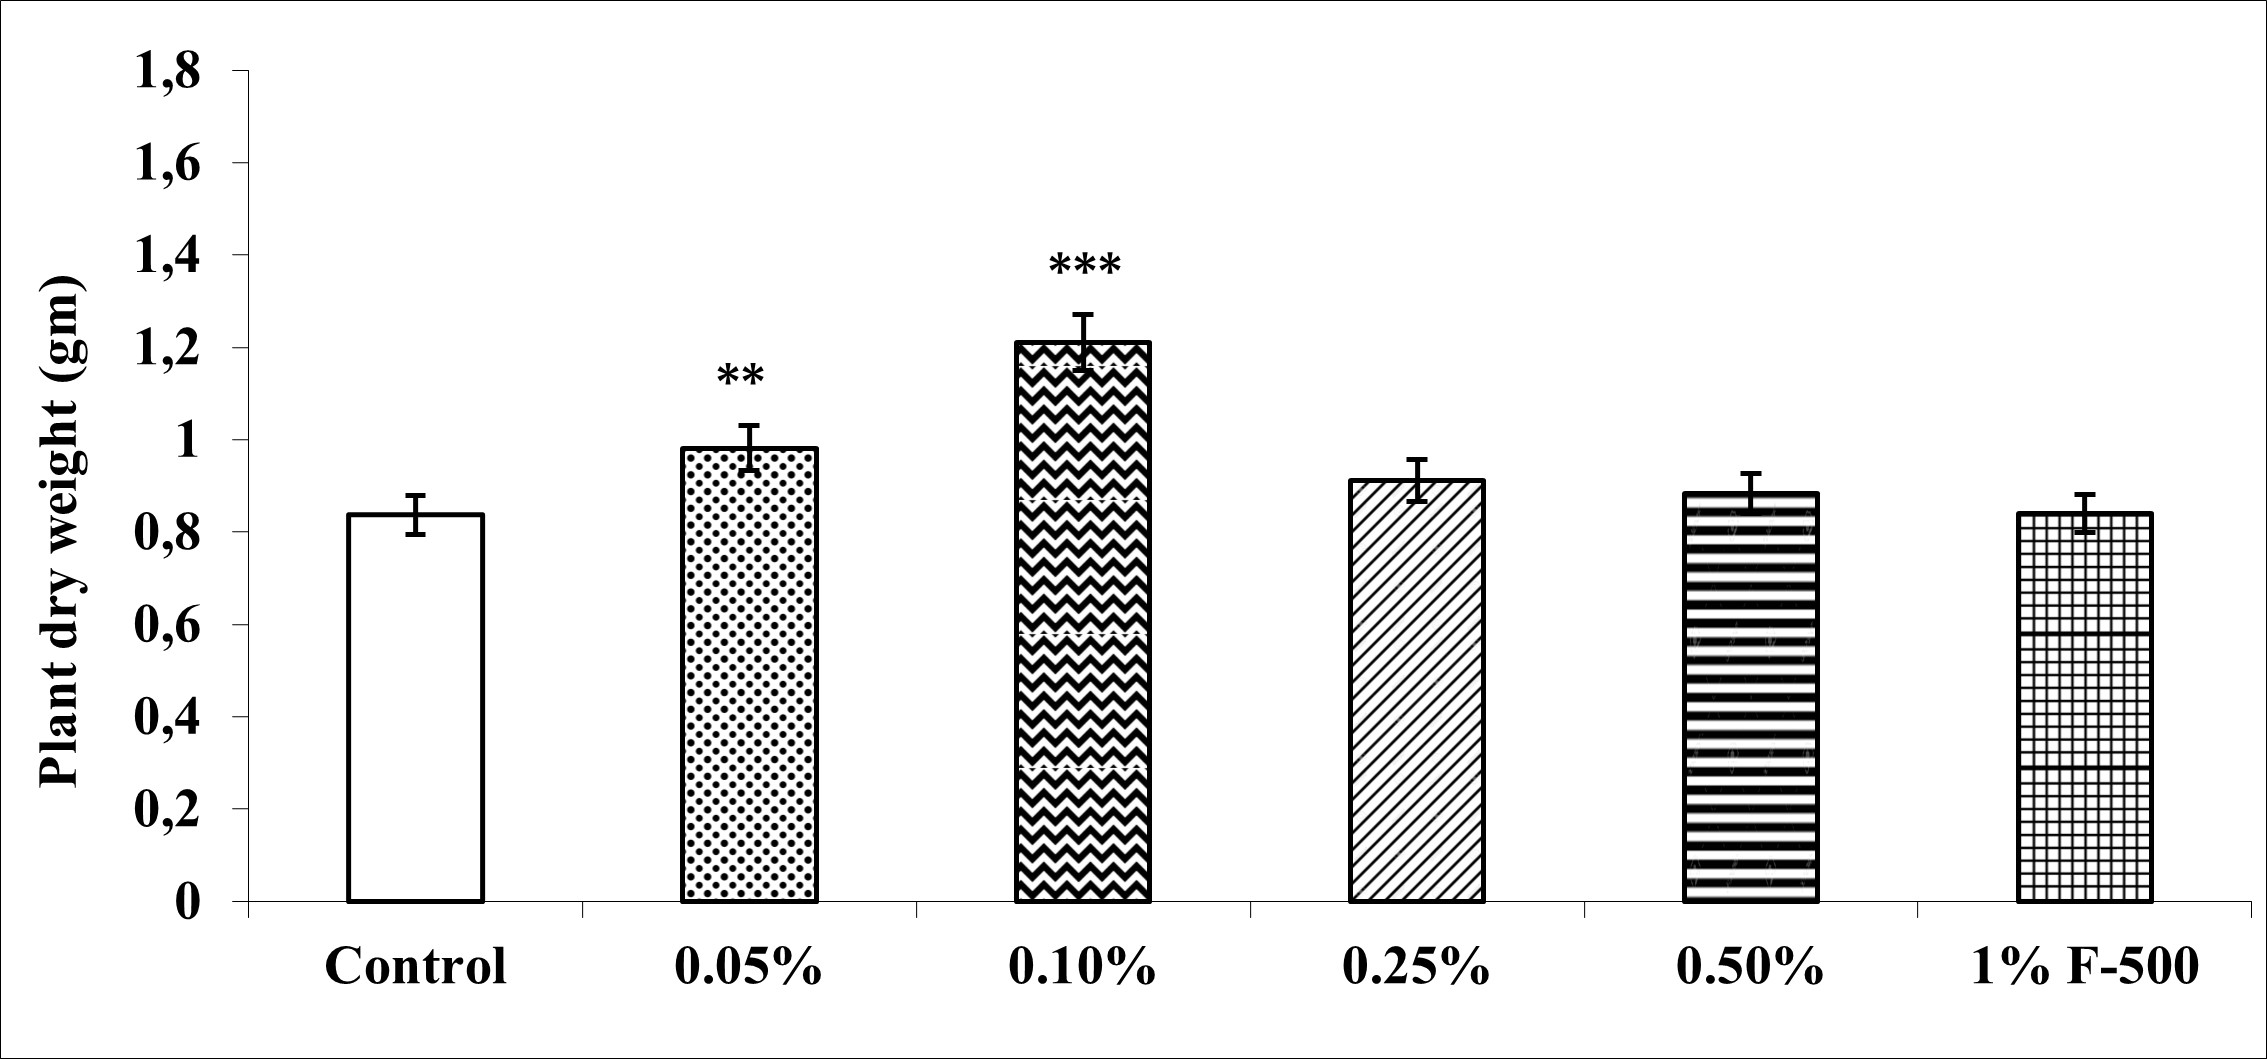
Biomass in terms of fresh and dry weight was enhanced significantly by foliar application of lower concentrations (0.05% and 0.1% F500) of pyraclostrobin (F500) as compared with control plants (Figure 1, Figure 2). Among the two concentrations, 0.1% F500 was found to be more effective in increasing fresh mass (30.9%) and dry mass (44.7%) compared to the control.
Figure 1
Effect of foliar application of pyraclostrobin (F500) on plant fresh weight of soybean at 45th DAE (the day after emergence). The vertical bar indicates mean ± SE. ***, **, and * indicate significance at P < 0.001, 0.01, and 0.05 (Newman–Keuls Multiple Comparison Test), respectively, compared to the control.
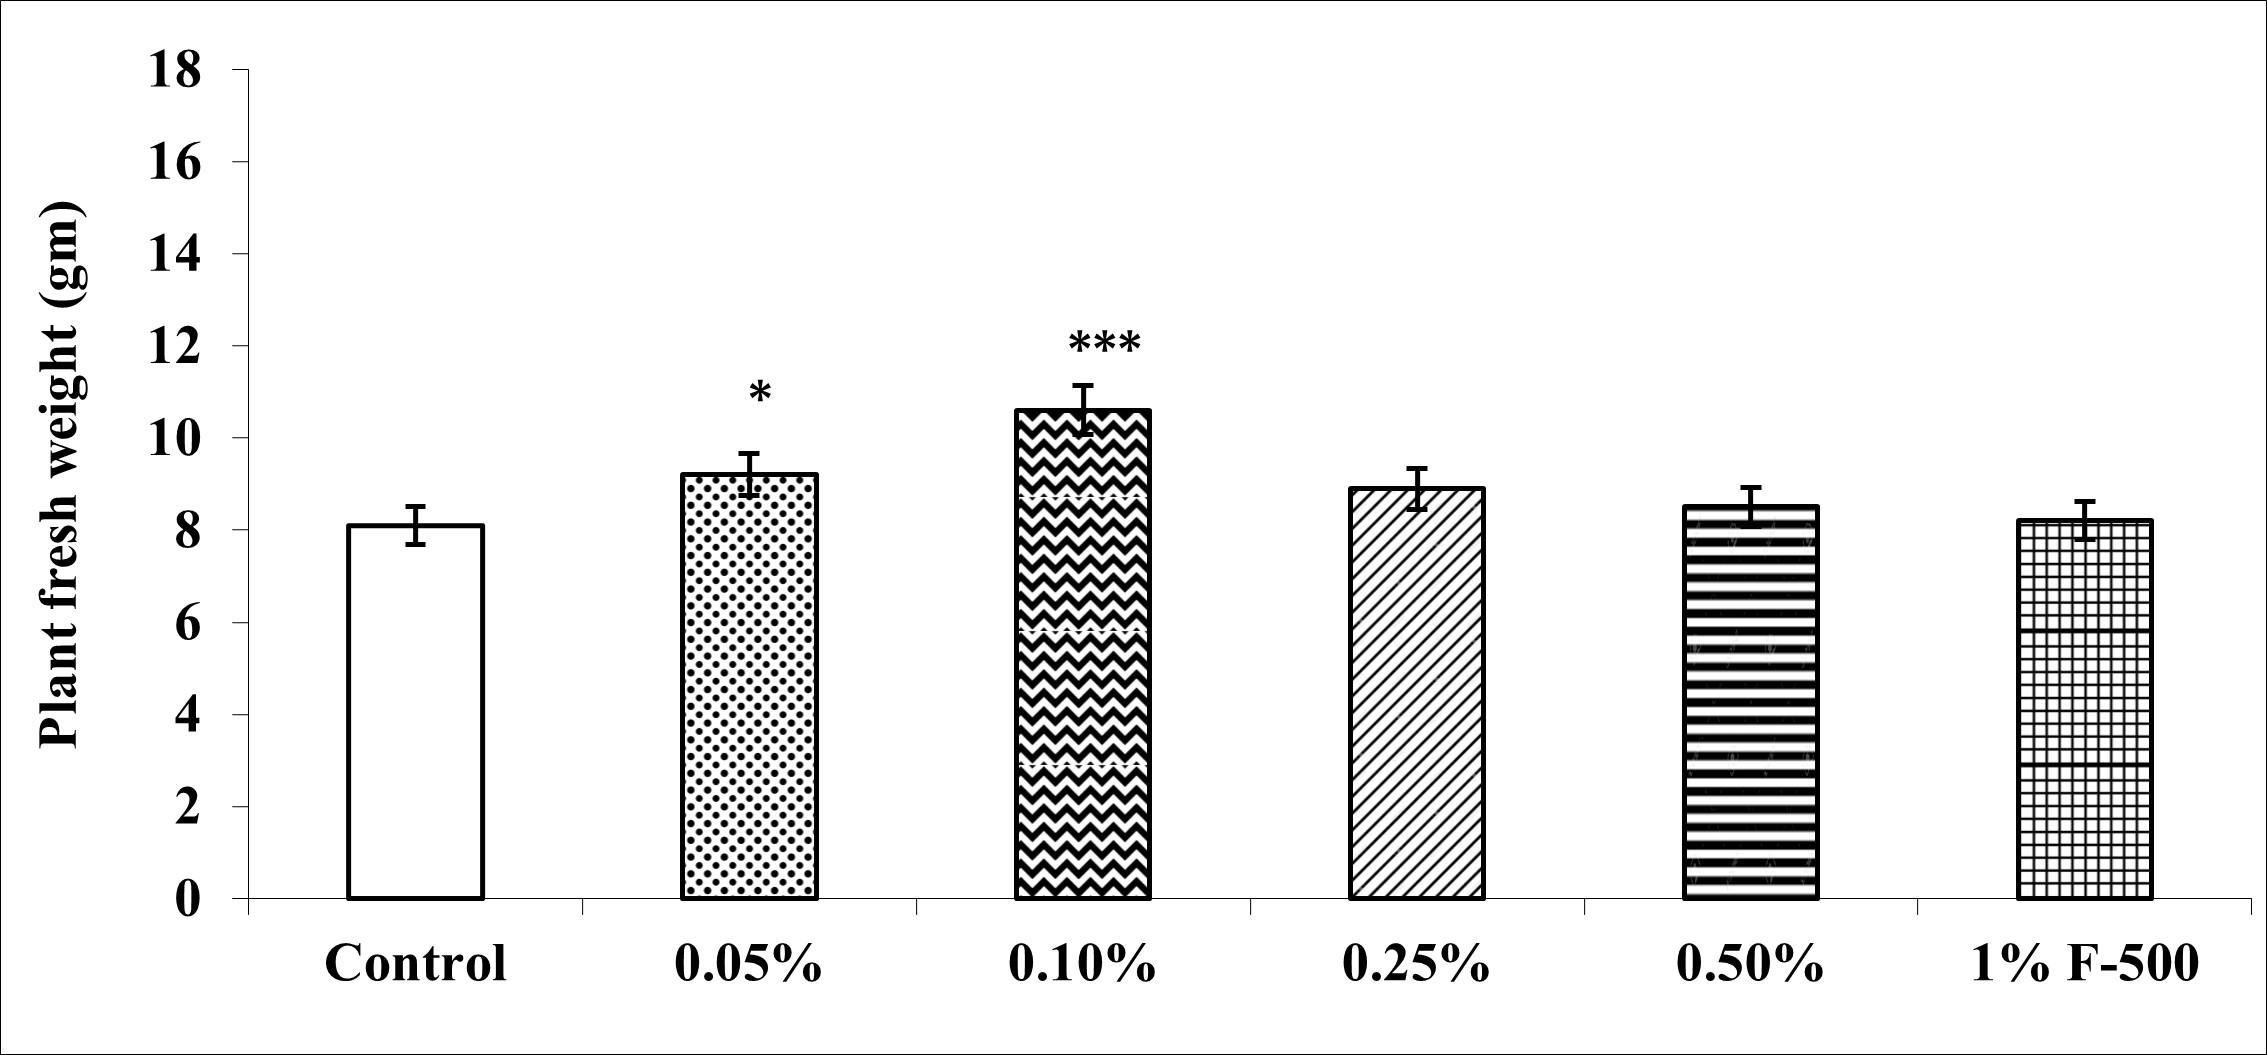
Figure 2
Effect of foliar application of pyraclostrobin (F500) on plant dry weight of soybean on 45th DAE (day after emergence). The vertical bar indicates mean ± SE. ***, **, and * indicate significance at P < 0.001, 0.01, and 0.05 (Newman–Keuls Multiple Comparison Test), respectively, compared to the control.
. Photosynthetic pigments, photosynthesis and carbon fixation
. Chlorophyll content and carotenoids
Total chlorophyll and carotenoid contents were measured in the plants after the F500 treatment. On a unit fresh weight basis, a maximum of 29% increase was recorded in total chlorophyll after 0.1% F500 treatment compared to the control. Enhancement in the level of chlorophyll b (32%) was higher than chlorophyll a (27%) after 0.1% F500 treatment. Due to this chlorophyll a/b ratio decreased by 4.2% after 0.1% F500 treatment (Figure 3). Carotenoid content was maximally enhanced by 0.1% F500 (9%) compared to the control (Figure 4).
Figure 3
Effect of foliar application of pyraclostrobin (F500) on chlorophyll content of soybean on 45th DAE (day after emergence). (A) chl a; (B) chl b; (C) total chlorophyll. (D) chl a:b. The vertical bar indicates mean ± SE. ***, **, and * indicate significance at P < 0.001, 0.01, and 0.05 (Newman–Keuls Multiple Comparison Test), respectively, compared to the control.
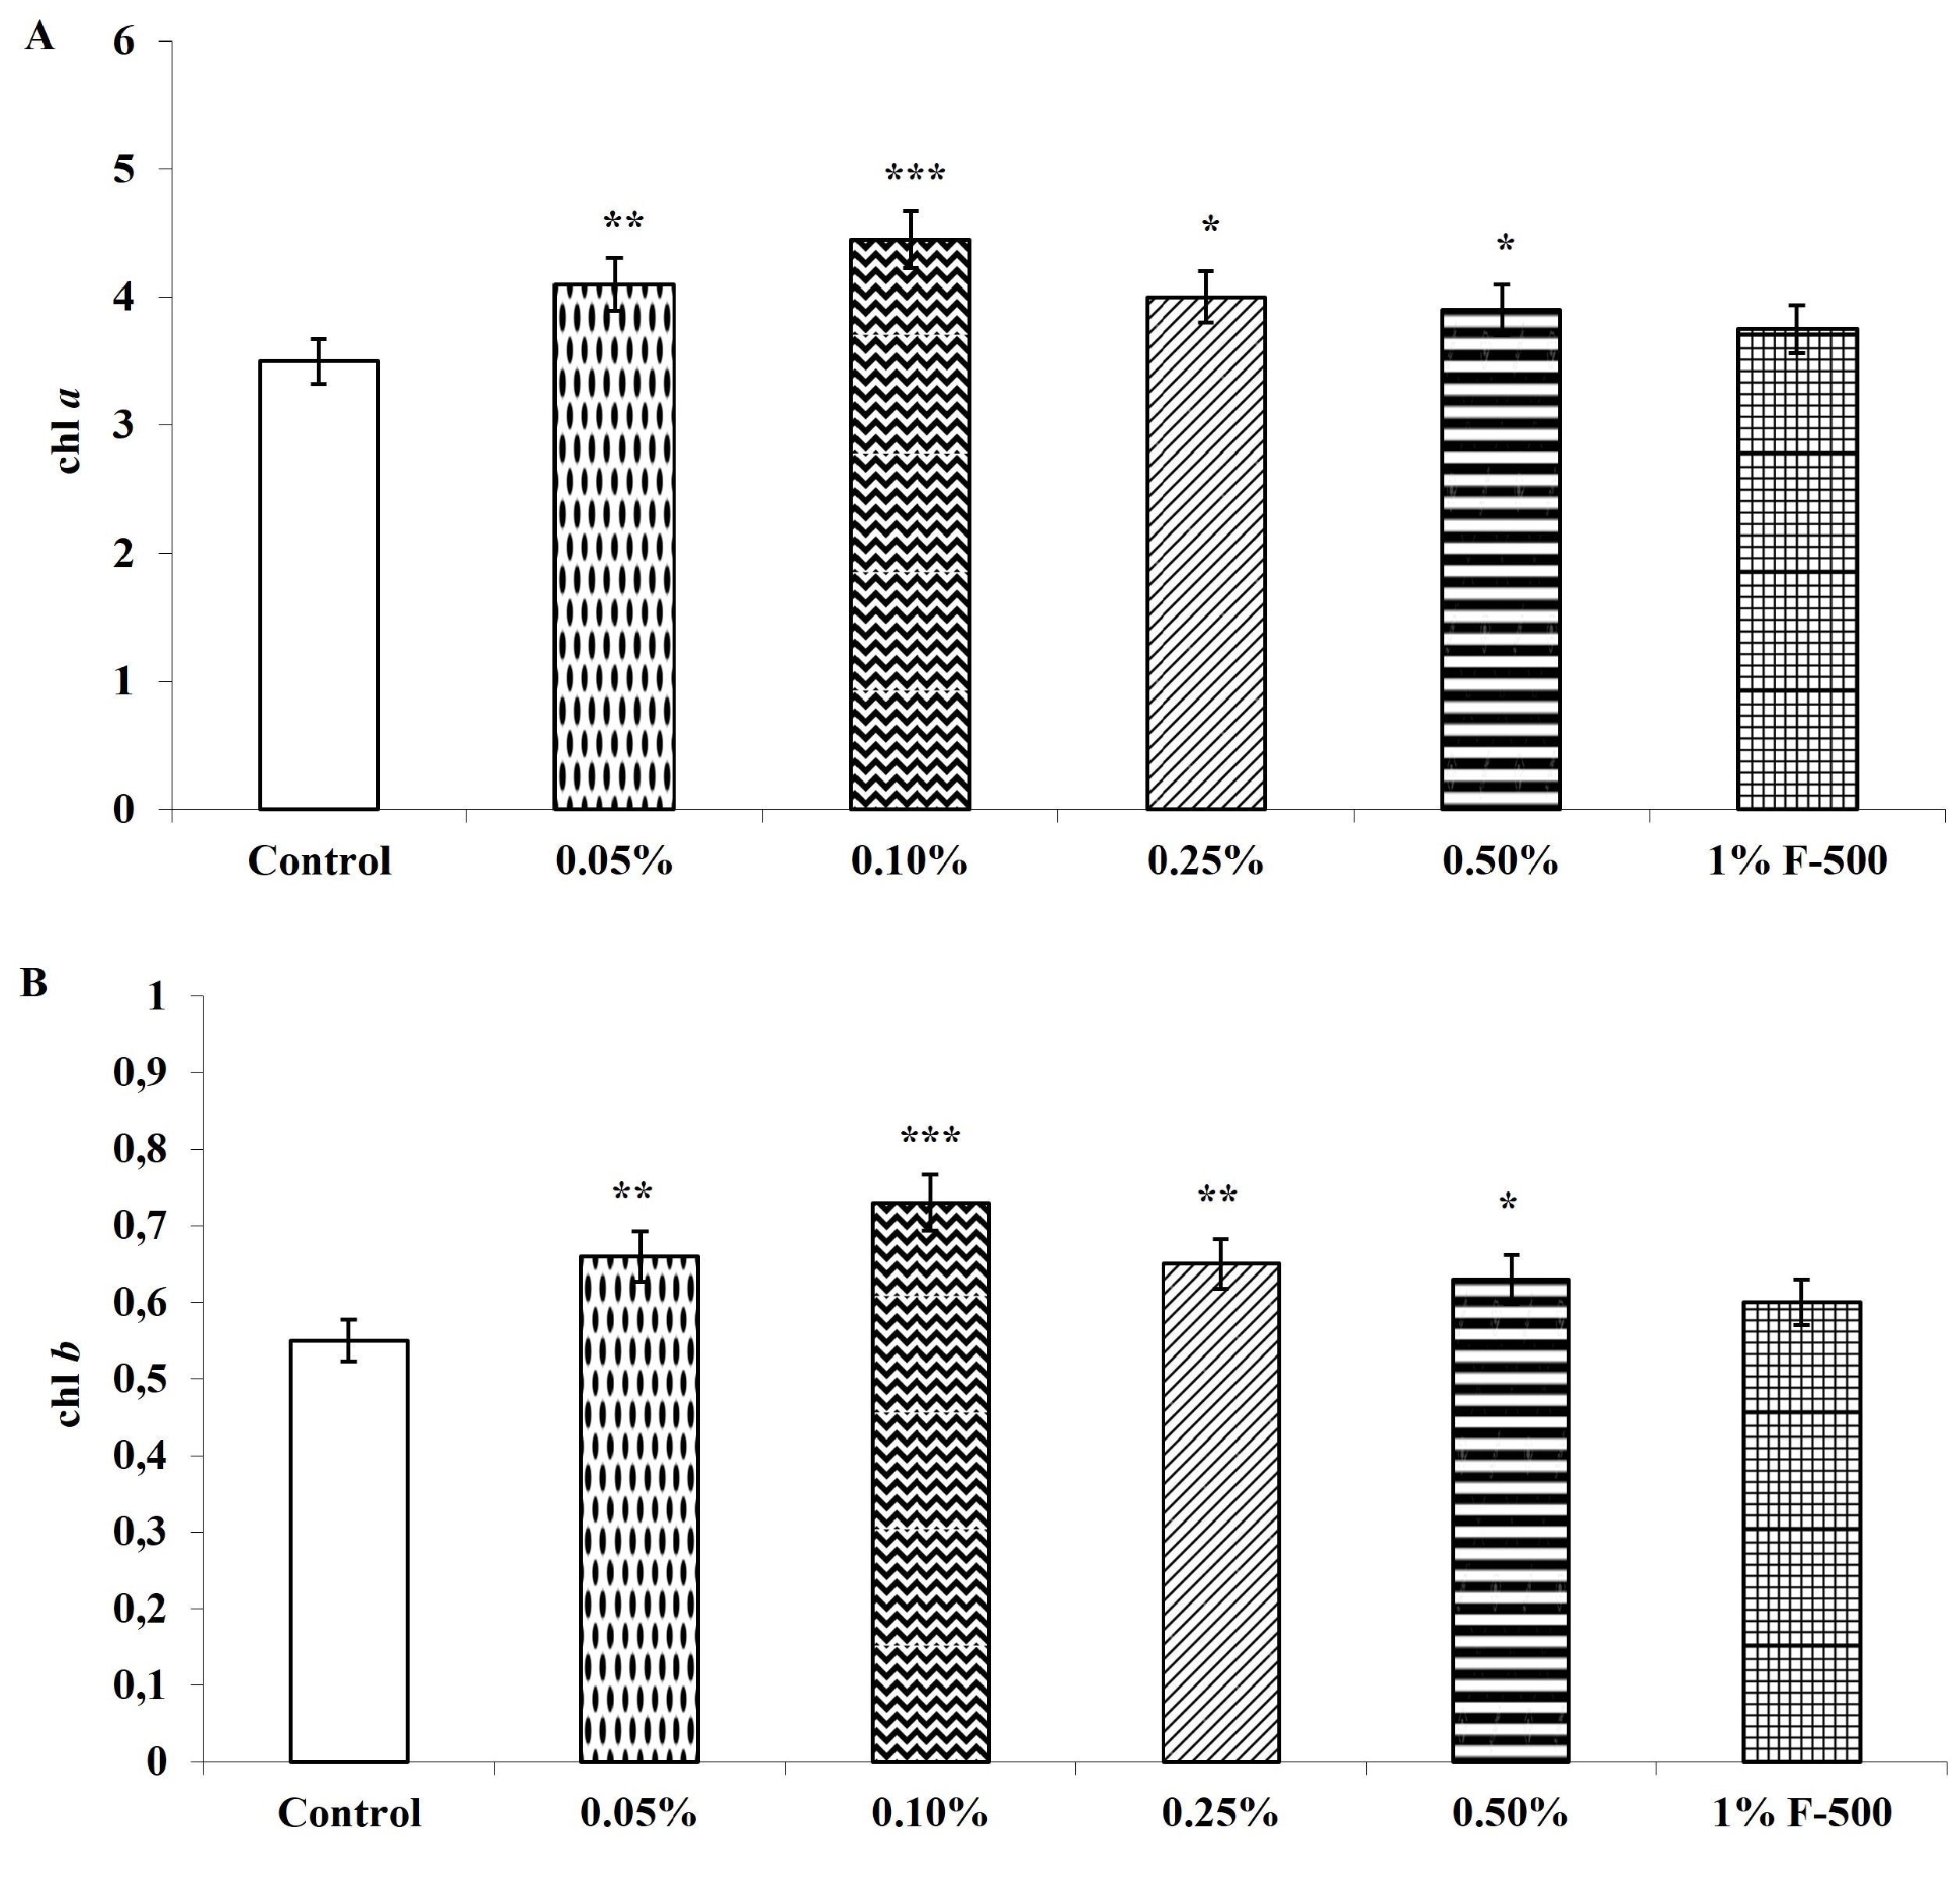
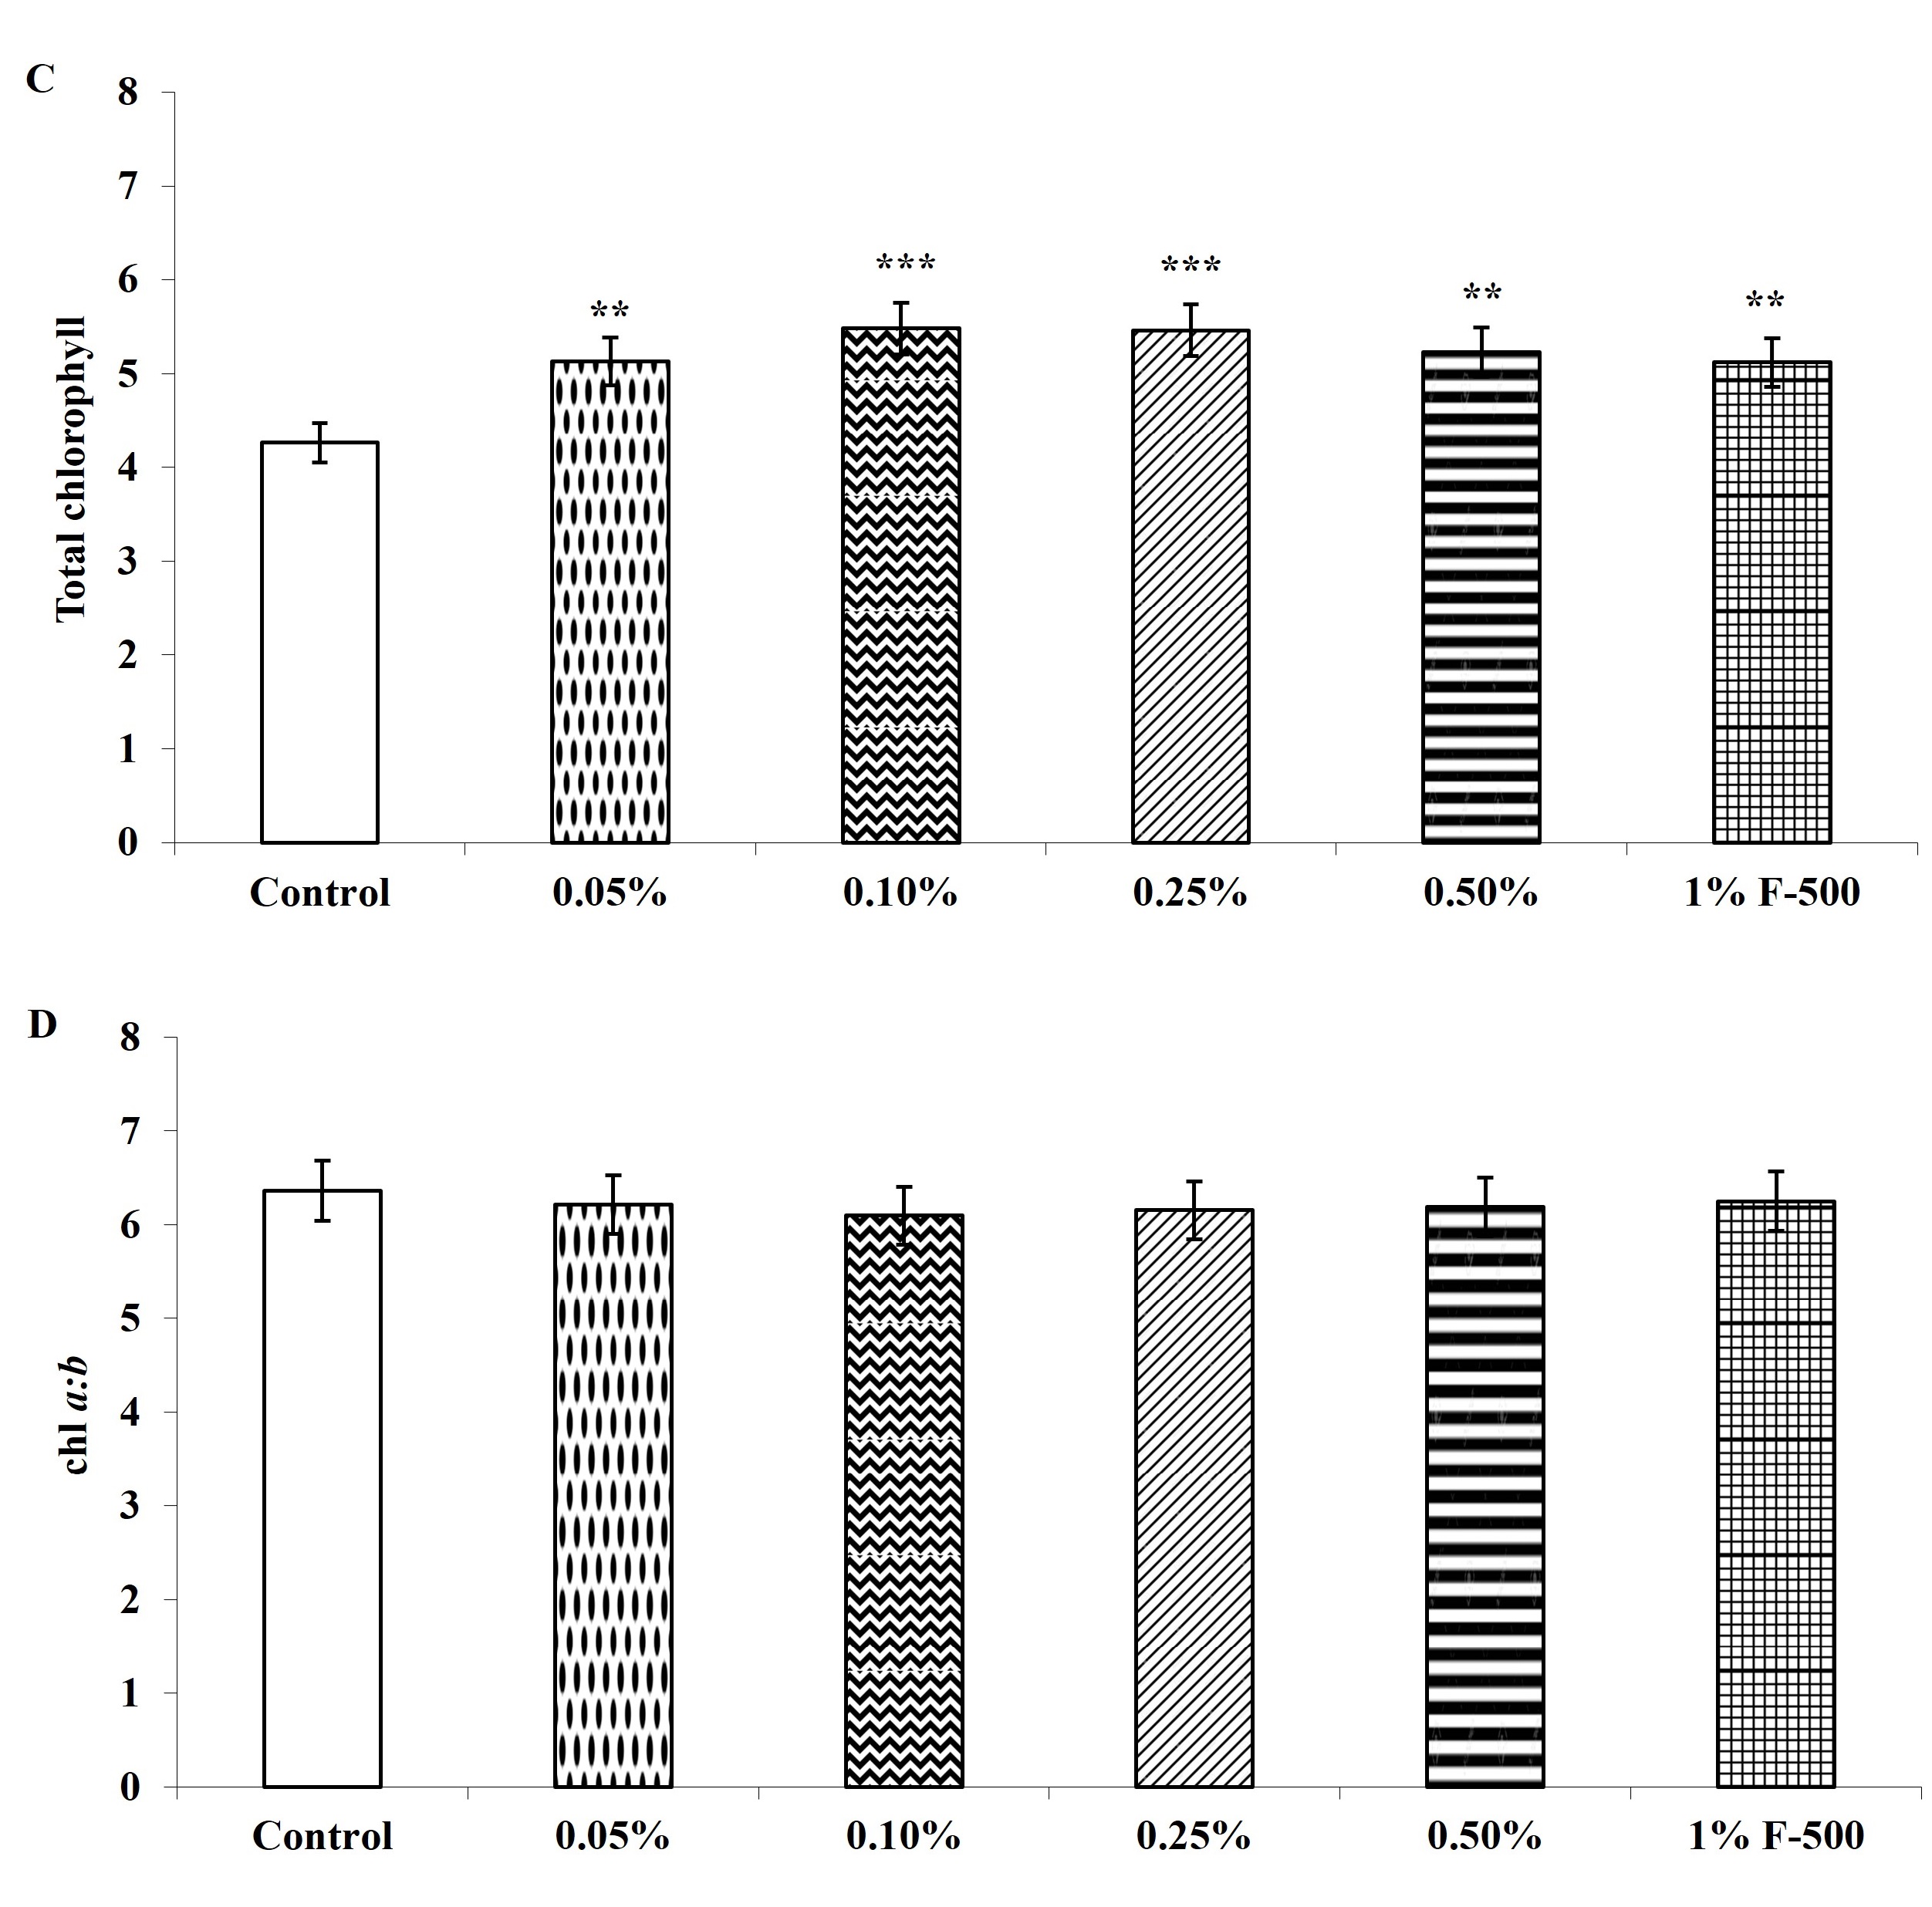
Figure 4
Effect of foliar application of pyraclostrobin (F500) on carotenoids of soybean on 45th DAE (day after emergence). The vertical bar indicates mean ± SE. ***, **, and * indicate significance at P < 0.001, 0.01, and 0.05 (Newman–Keuls Multiple Comparison Test), respectively, compared to the control.
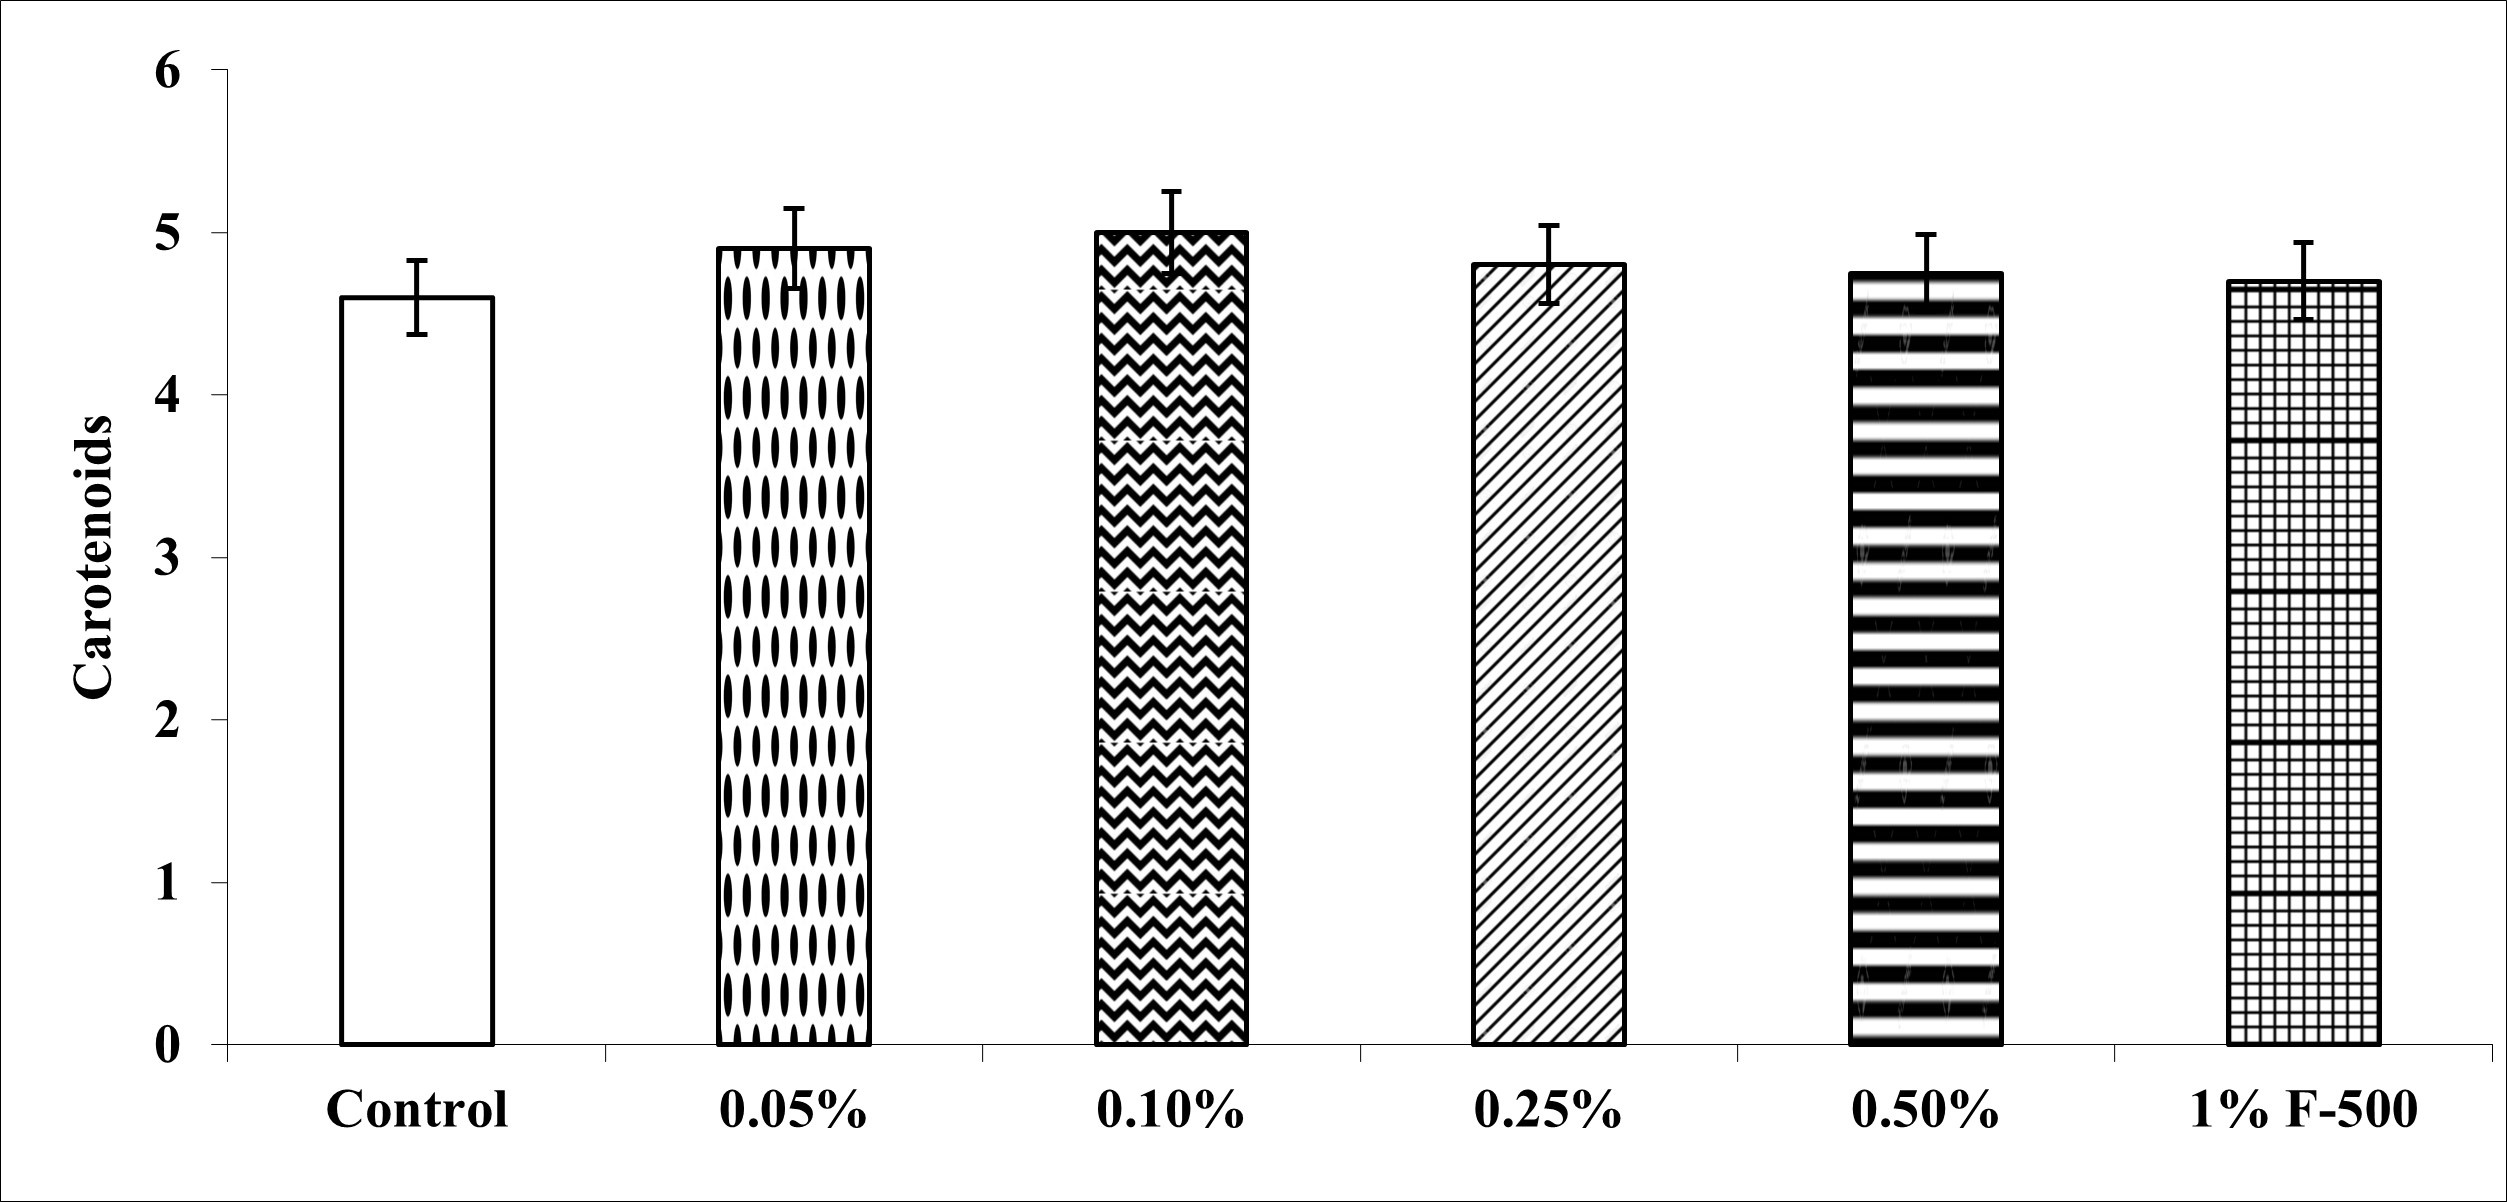
Figure 5
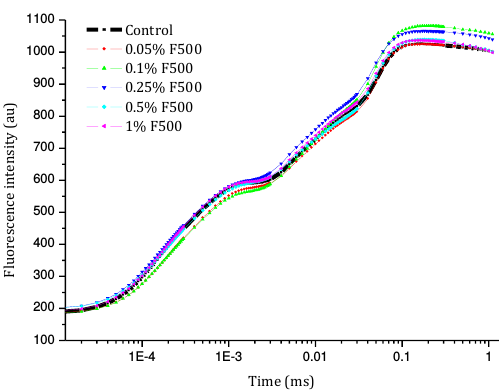
Changes in polyphasic chlorophyll a fluorescence (OJIP) transient curves in soybean leaves (in fully expanded third leaf from the top on 45th DAE) after foliar application of pyraclostrobin (F500) (O-J-I-P are fluorescence yield in 20 µs, 2 ms, 30 ms, and maximum fluorescence, respectively).
. Chlorophyll a fluorescence
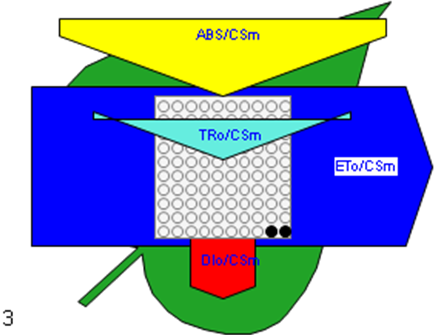
Higher fluorescence was recorded in F500-treated plants compared to the control, which showed a separation of the O-J-I-P phase when plotted on a logarithmic time scale (Figure 5). The fluorescence yield at both the I and P phase was higher in the 0.1% F500-treated plants as compared to control plants. The fluorescence yield at the O phase decreased by 2.9% and 1.7% and by 3.7% and 2.1% at the J phase in 0.1% F500 and 0.05% F500-treated plants, respectively. The Fm increased by 5.5% in 0.1% F500-treated plants (Table 1). Reduction in maximum fluorescence (Fm) in control plants indicates the reduction in the number of PS II centers available to reduce QA. The maximum quantum yield of primary photochemistry (Fv/Fm) does not show a significant difference between F500-treated plants (a maximum of 1.6% enhancement in 0.1% F500) and control plants. The derived specific fluxes per active PS II maximum cross-section area were also affected by F500 treatment. The TRo/CSm showed a significant enhancement of 8.4% in 0.1% F500-treated plants showing the maximum trapping rate by which excitation is trapped per cross-section area of PS II. The ETo/CSm showed a significant enhancement of 17.9% after 0.1% F500 treatment (Table 1). Whereas DIo/CSm was reduced by 4.8% in plants treated with 0.1% F500 showing effectively dissipated flux of un-trapped excitations per cross-section (Figure 6). These parameters further contribute to increasing the performance index. The most sensitive parameter calculated by the equation of JIP test is the performance index (PI), which indicates sample vitality. The PI was significantly enhanced by 46.4% after 0.1% F500 treatment compared to the control. The results indicate that 0.1% F500 treatment is suitable for better sunlight harvesting and improves photosynthetic yield in soybean plants.
Table 1
Summary of parameters and their description using data extracted from the fluorescence transient OJIP for soybean, after pyraclostrobin (F500) treatment.
[i] Fo = Initial fluorescence at 20 µs, chlorophyll fluorescence intensity measured when all PSII reaction centres are assumed to open.
FJ = Fluorescence intensity at the J-step during fluorescence induction at 2 ms.
FI = Fluorescence intensity at the I-step during fluorescence induction at 30 ms.
Fm = maximum fluorescence at 1 s, maximum chlorophyll fluorescence intensity measured when all PSII reaction centres are assumed to close.
Fv/Fm = maximum quantum yield of primary photochemistry.
dV/dto = the initial slope of the relative variable fluorescence, which directly describes the trapping flux.
TRo/CSm = Trapped energy (maximum) flux per cross-section of the leaf.
ETo/CSm = Electron transport flux per (maximum) per cross-section of leaf.
DIo/CSm = Dissipation energy flux per cross-section of leaf.
PI = performance index.
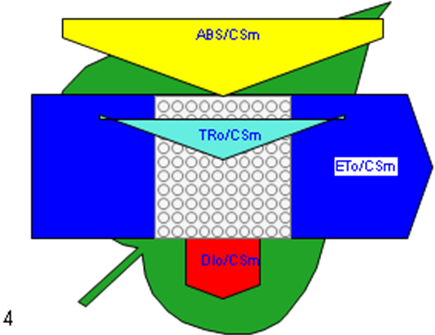
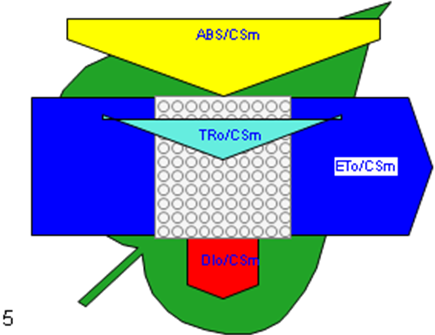
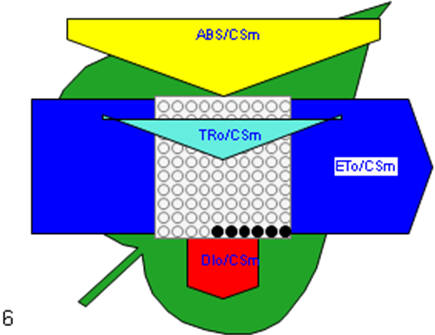
Figure 6
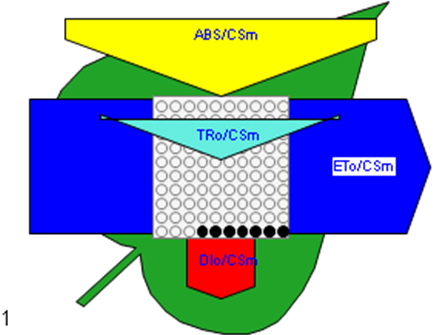
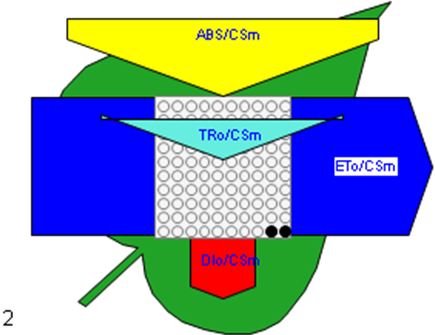
Phenomenological leaf model of soybean leaves (in fully expanded third leaf from the top on 45th DAE) showing the effect of foliar application of pyraclostrobin (F500). Each relative value is represented by the size of the proper parameters (arrow); empty circles represent reducing QA reaction centers (active), and whole black circles represent non-reducing QA reaction centers (inactive or silent). (1) Control. (2) 0.05%. (3) 0.1%. (4) 0.25%. (5) 0.5%. (6) 1%.
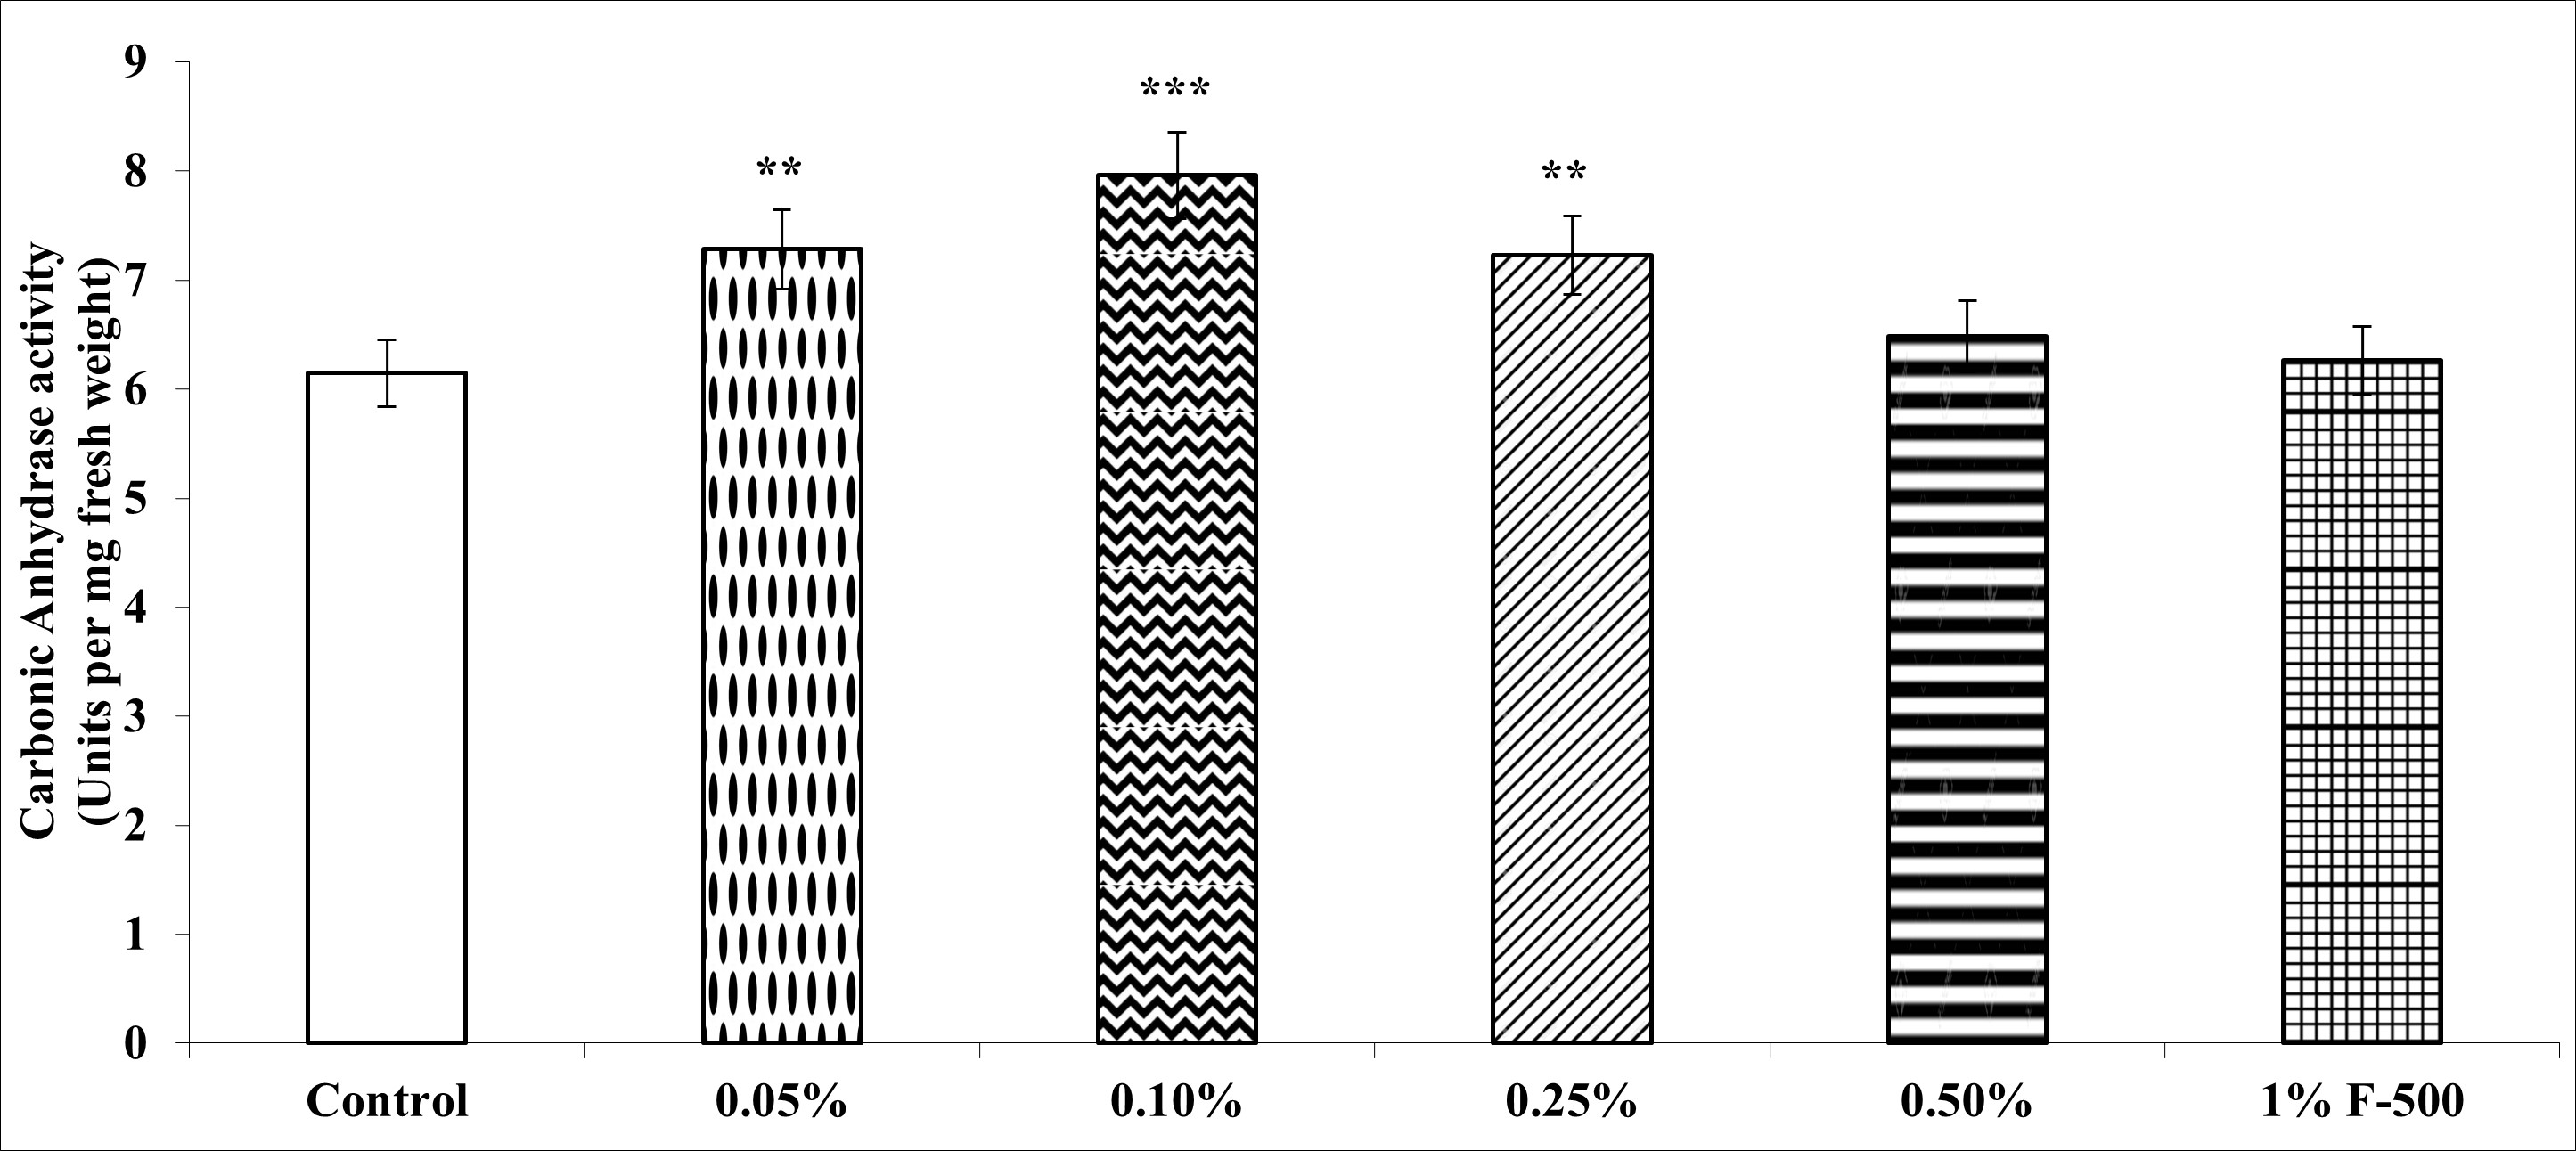
. Carbonic anhydrase
Carbonic anhydrase (CA) plays an important role in accelerating carbon assimilation by catalyzing the reversible inter-conversion of CO2and HCO3−.
CA activity in leaves of soybean increased maximally by 29.5% after foliar application of 0.1% F500 as compared to the control. Other concentrations were less effective (Figure 7).
Figure 7
Effect of foliar application of pyraclostrobin (F500) on carbonic anhydrase activity of soybean on 45th DAE (day after emergence). The vertical bar indicates mean ± SE. ***, **, and * indicate significance at P < 0.001, 0.01, and 0.05 (Newman–Keuls Multiple Comparison Test), respectively, compared to the control.
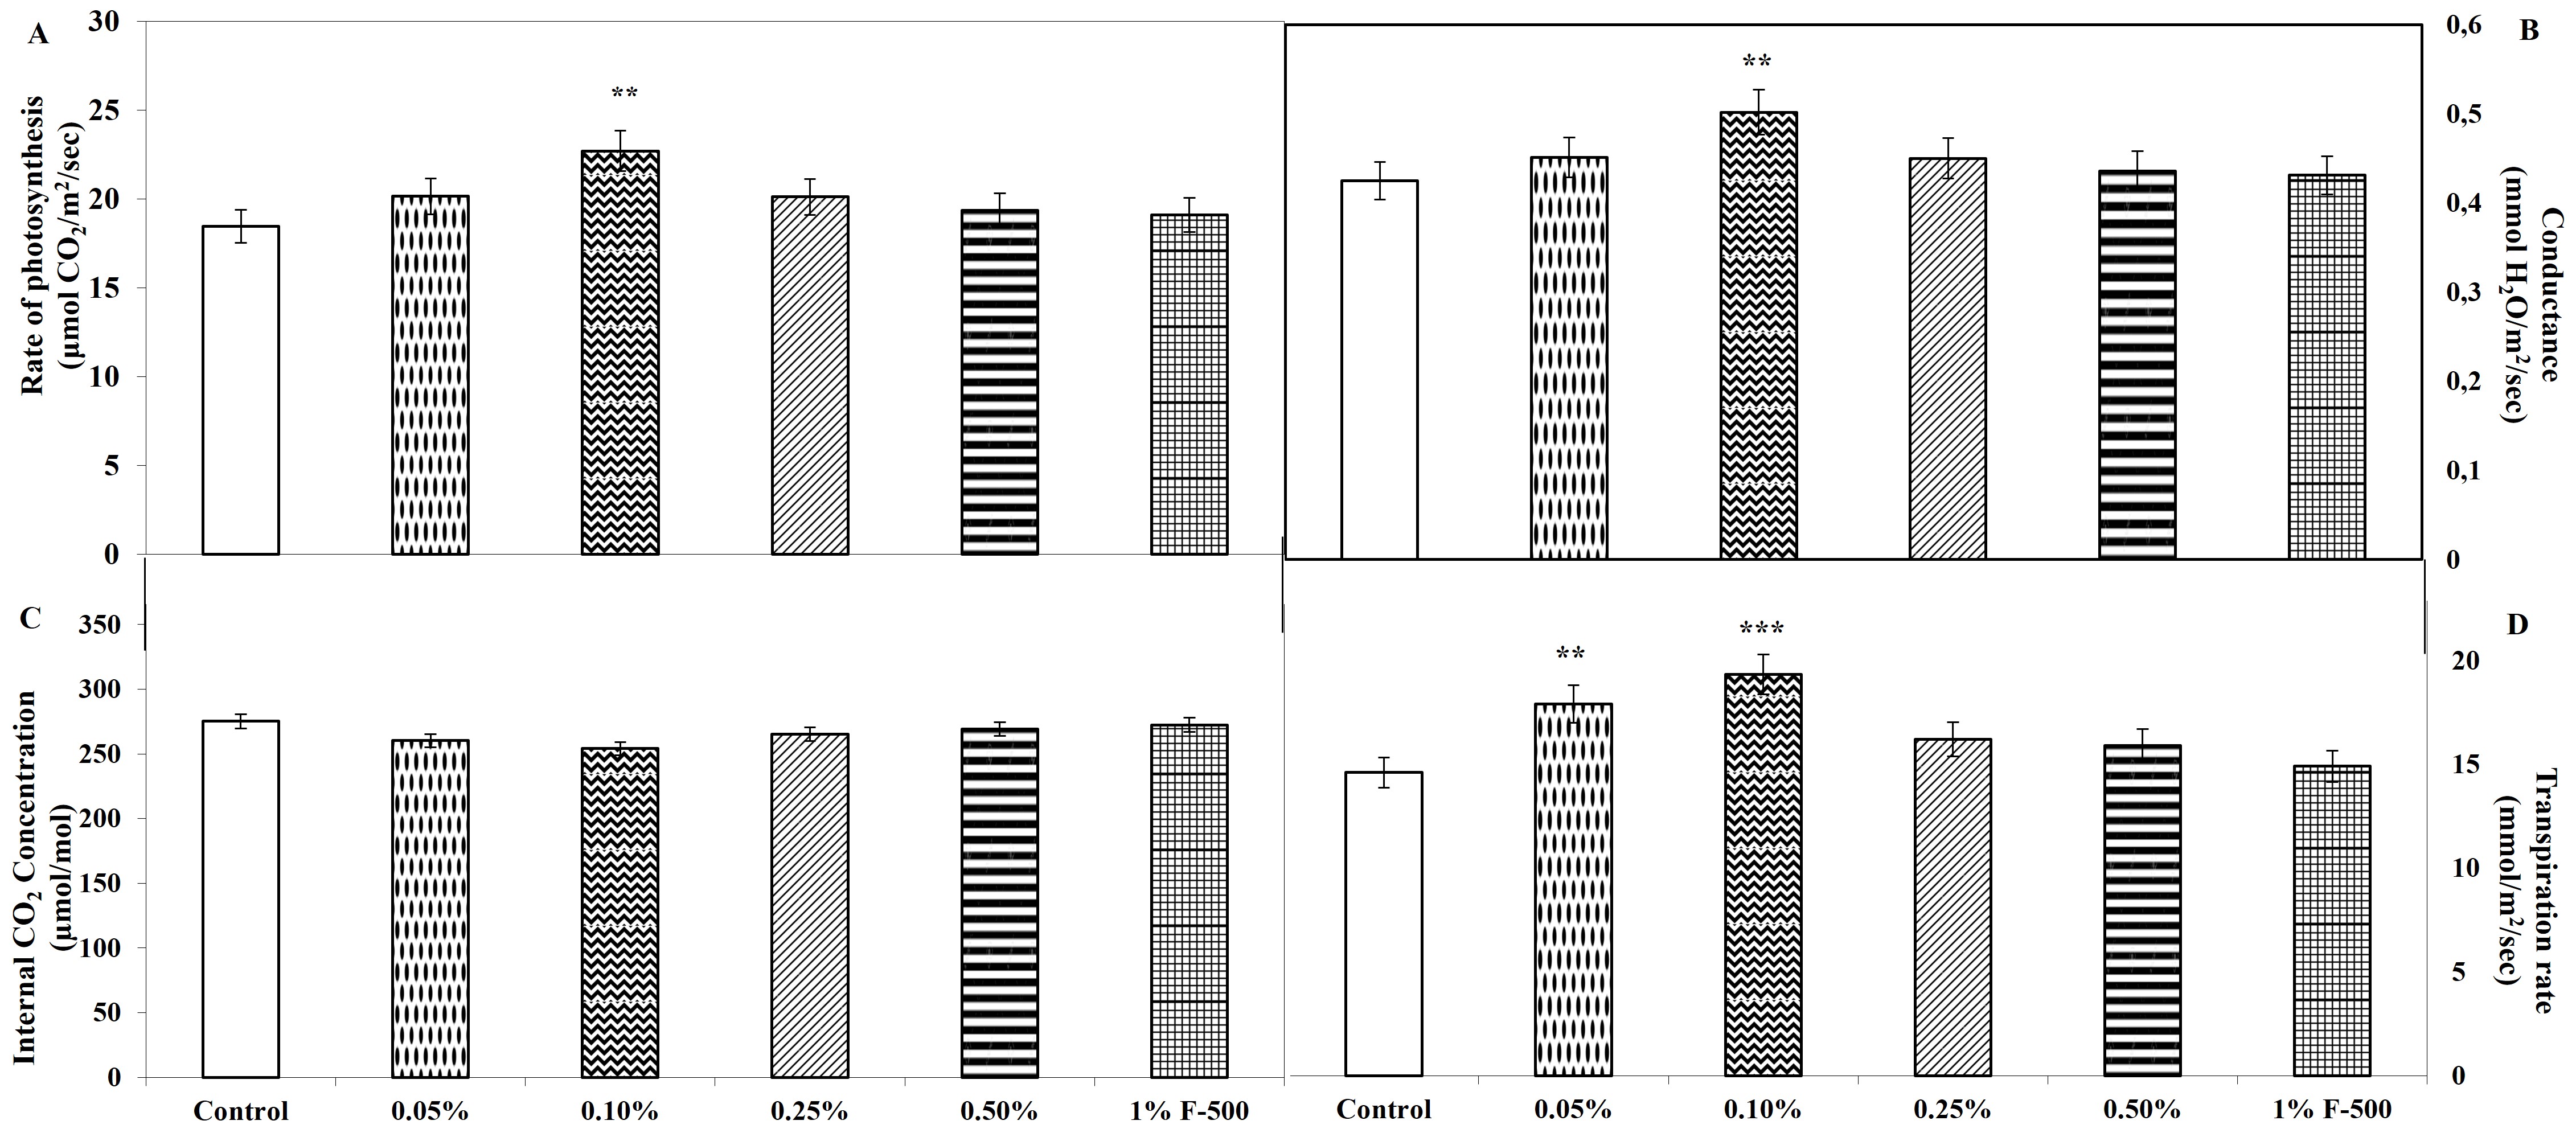
. Gas exchange parameters
Measurements were done on intact leaves (fully expanded third leaf from the top on 45th DAE) using IRGA to obtain gas exchange parameters that provide direct evidence for the enhancement of CO2 fixation. Maximum alteration in gas exchange parameters was found in 0.1% F500 amongst all the concentrations compared to the control. An increase of 22% in net photosynthesis (Pn) was recorded in 0.1% F500, illustrating a higher CO2 assimilation rate in treated plants compared to the untreated. Accompanying parameters like stomatal conductance and transpiration rate also increased along with net photosynthesis. Stomatal conductance was increased by 18%; transpiration rate was enhanced by 32.3%, whereas a reduction of 7.7% was observed in the inter-cellular concentration of CO2 in 0.1% F500-treated plants as compared to the control (Figure 8).
Figure 8
Effect of foliar application of pyraclostrobin (F500) on gas exchange parameters of soybean (in fully expanded third leaf from the top on 45th DAE). (A) Rate of photosynthesis. (B) Conductance. (C) Internal CO2 concentration. (D) Transpiration rate. The vertical bar indicates ± SE for the mean. ***, **, and * indicate significance at P < 0.001, 0.01, and 0.05 (Newman–Keuls Multiple Comparison Test), respectively, compared to the control.
. Antioxidant defense system
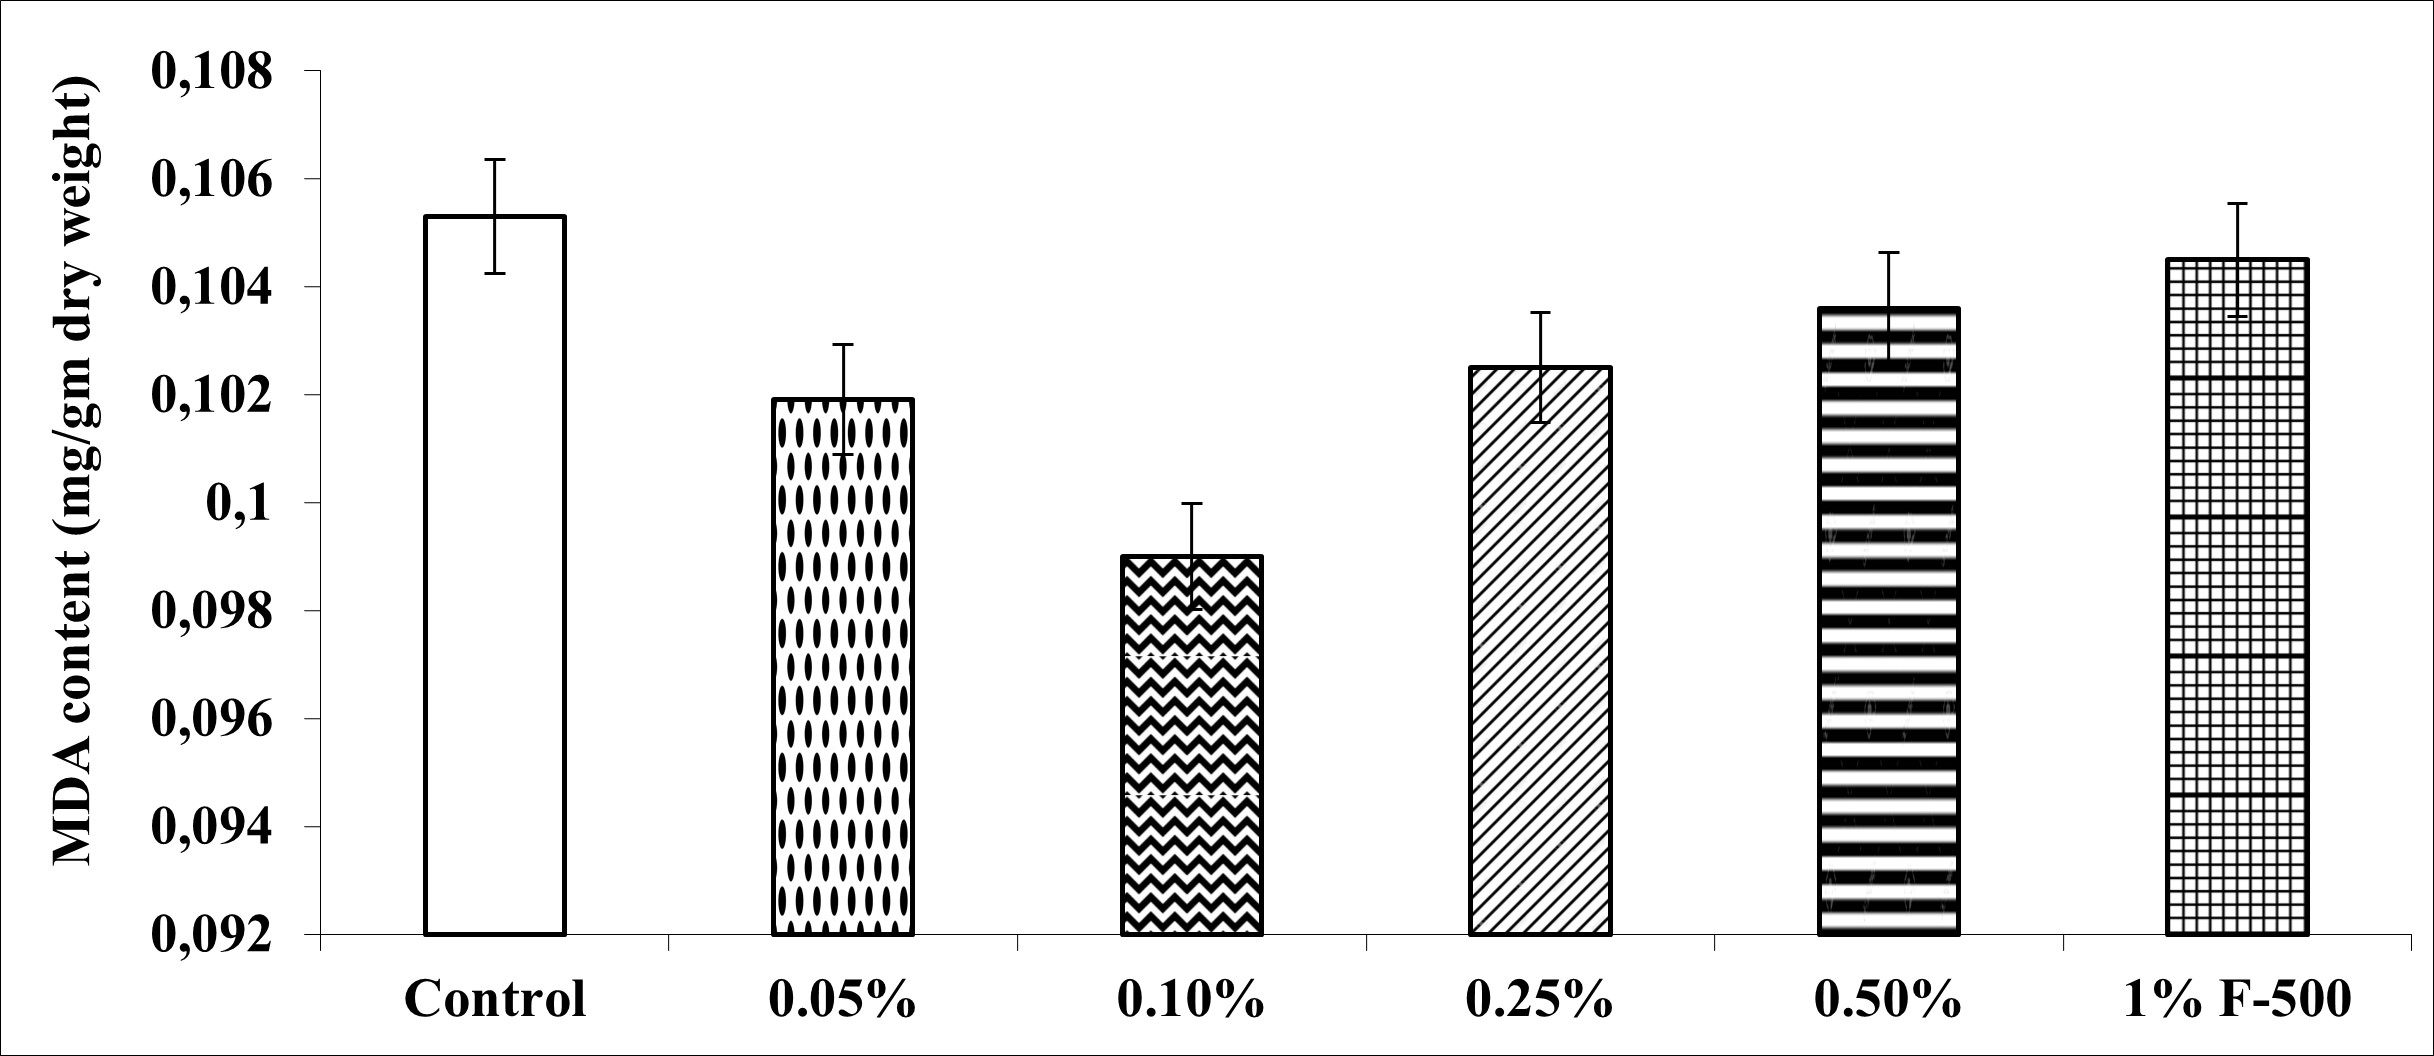
. Malondialdehyde (MDA) content
MDA decreased maximally by 5.9% at 0.1% concentration of F500 as compared to the control. The rest of the concentrations reduced MDA by 0.8–3.2% compared to the control (Figure 9).
Figure 9
Effect of foliar application of pyraclostrobin (F500) on MDA content of soybean on 45th DAE. The vertical bar indicates ± SE for the mean. ***, **, and * indicate significance at P < 0.001, 0.01, and 0.05 (Newman–Keuls Multiple Comparison Test), respectively, compared to the control. The absence of an asterisk (*) indicates a non-significant difference.
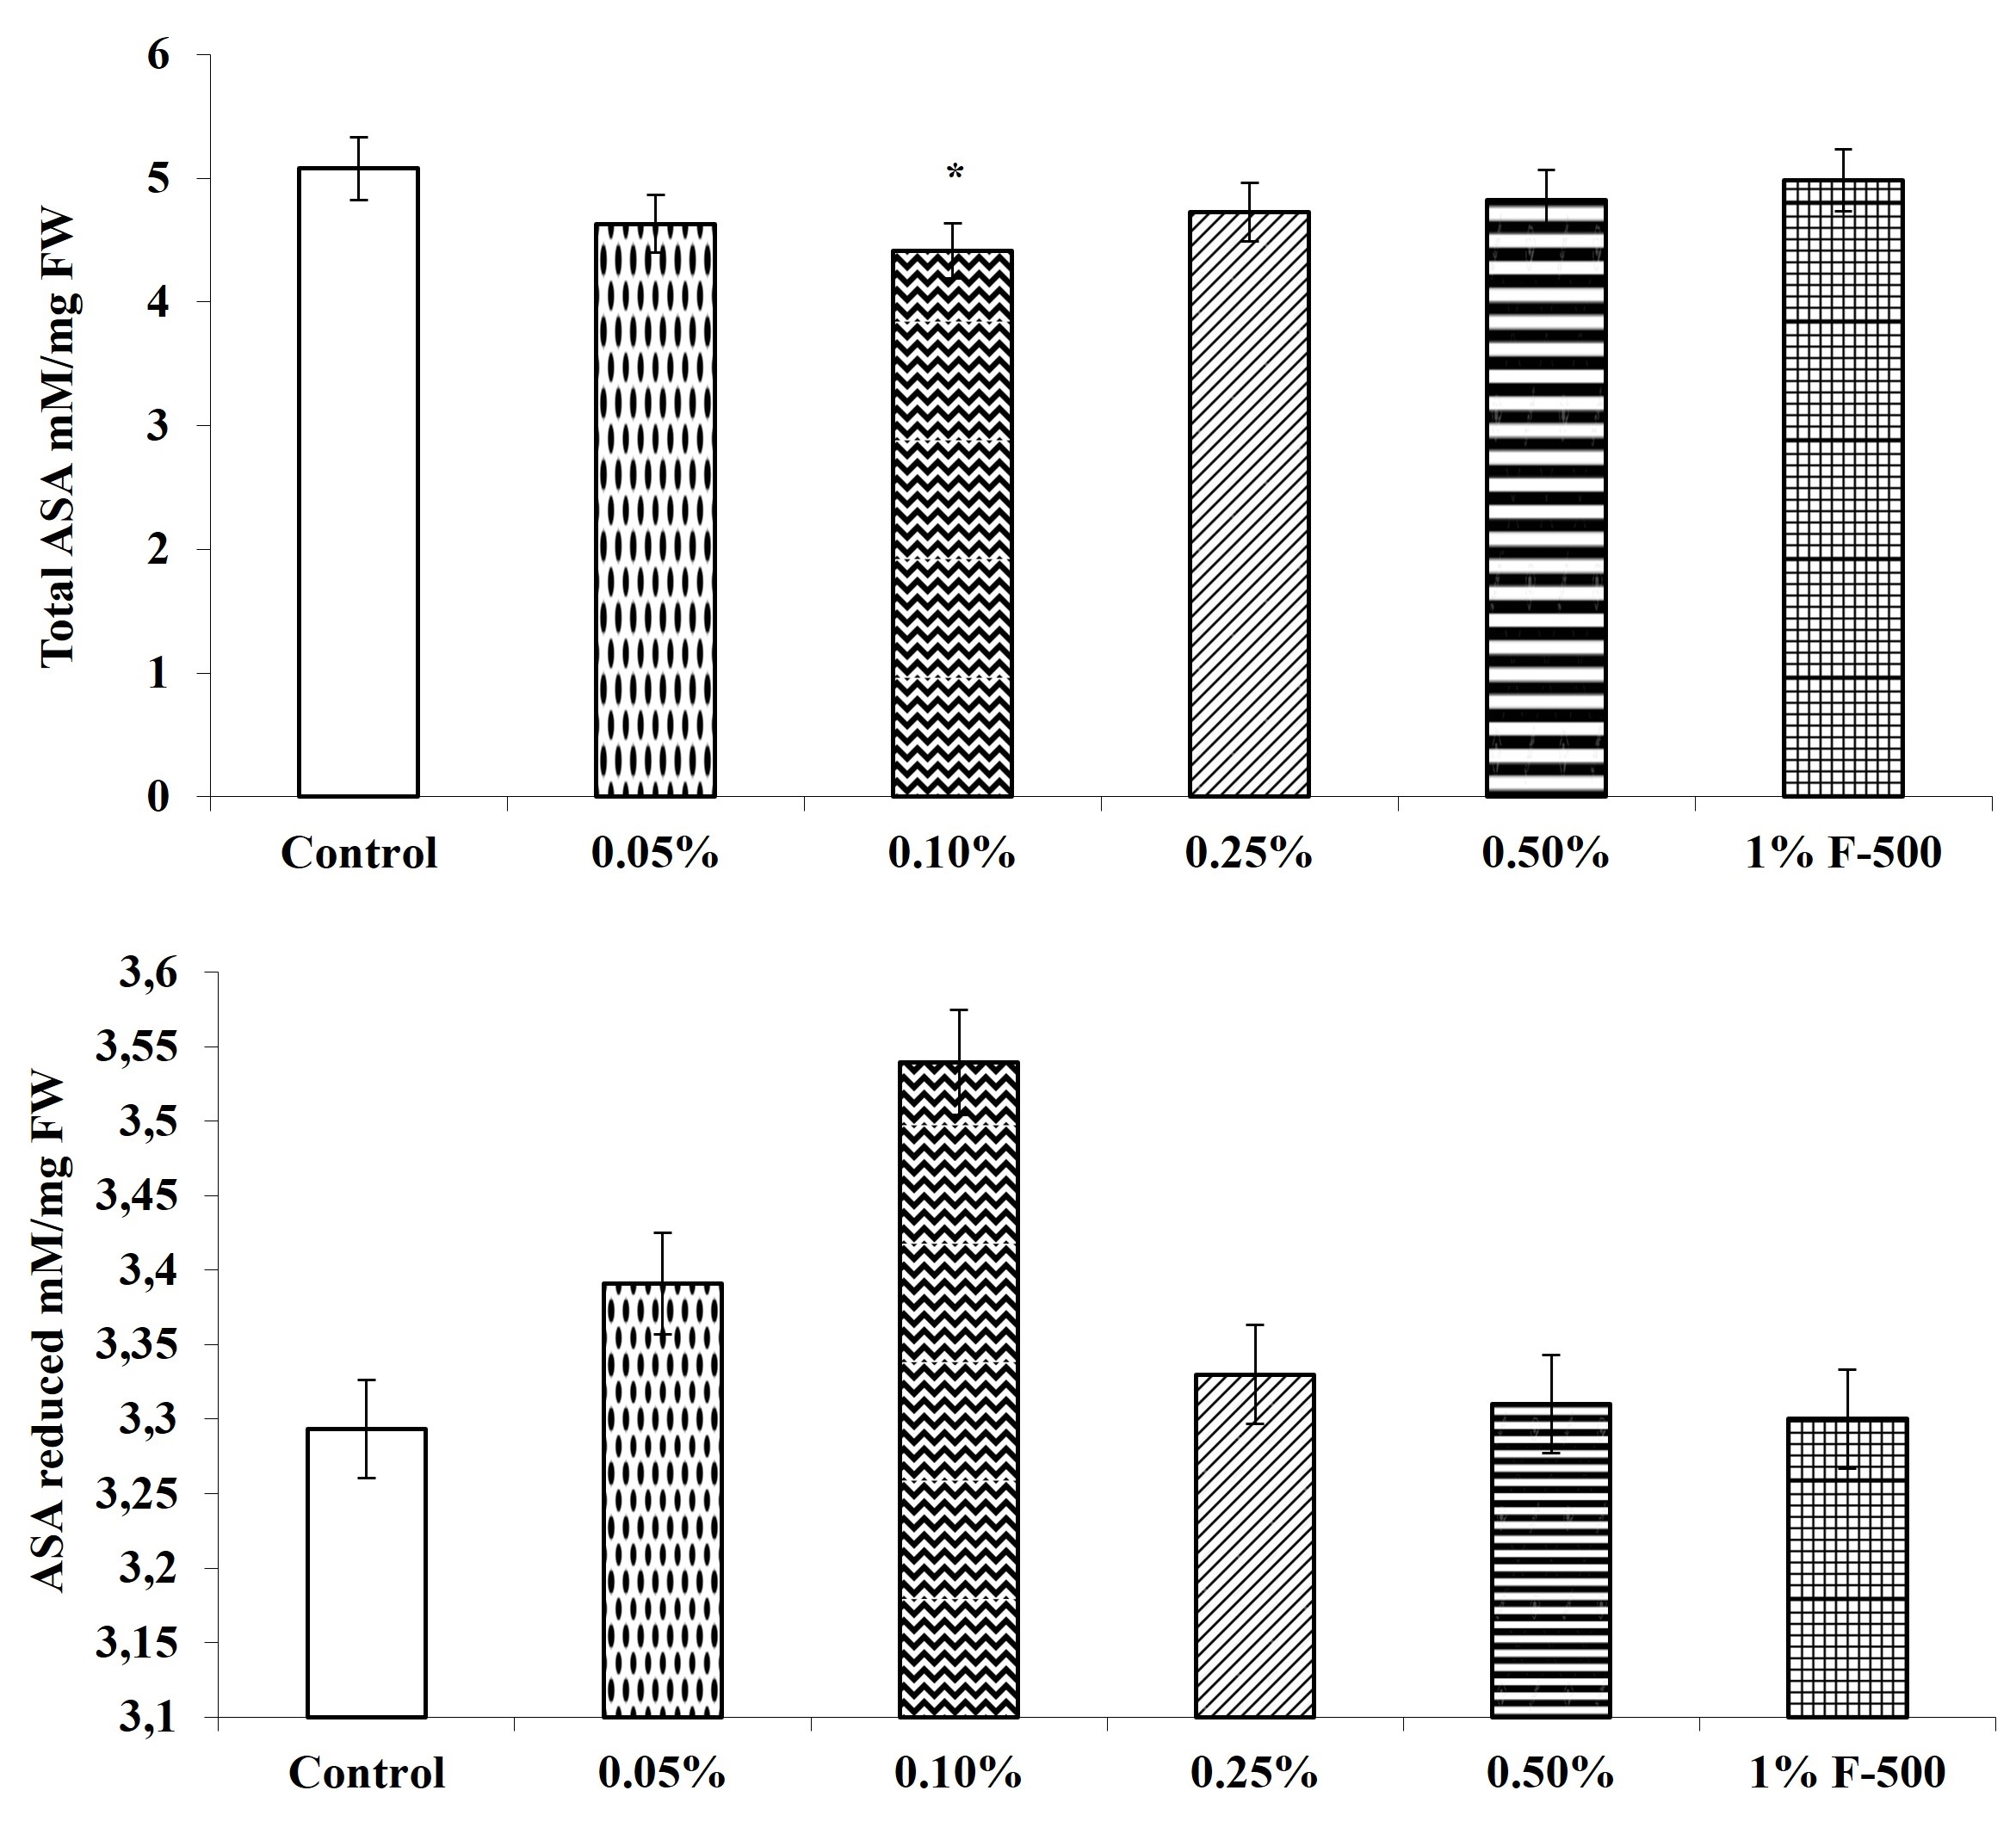
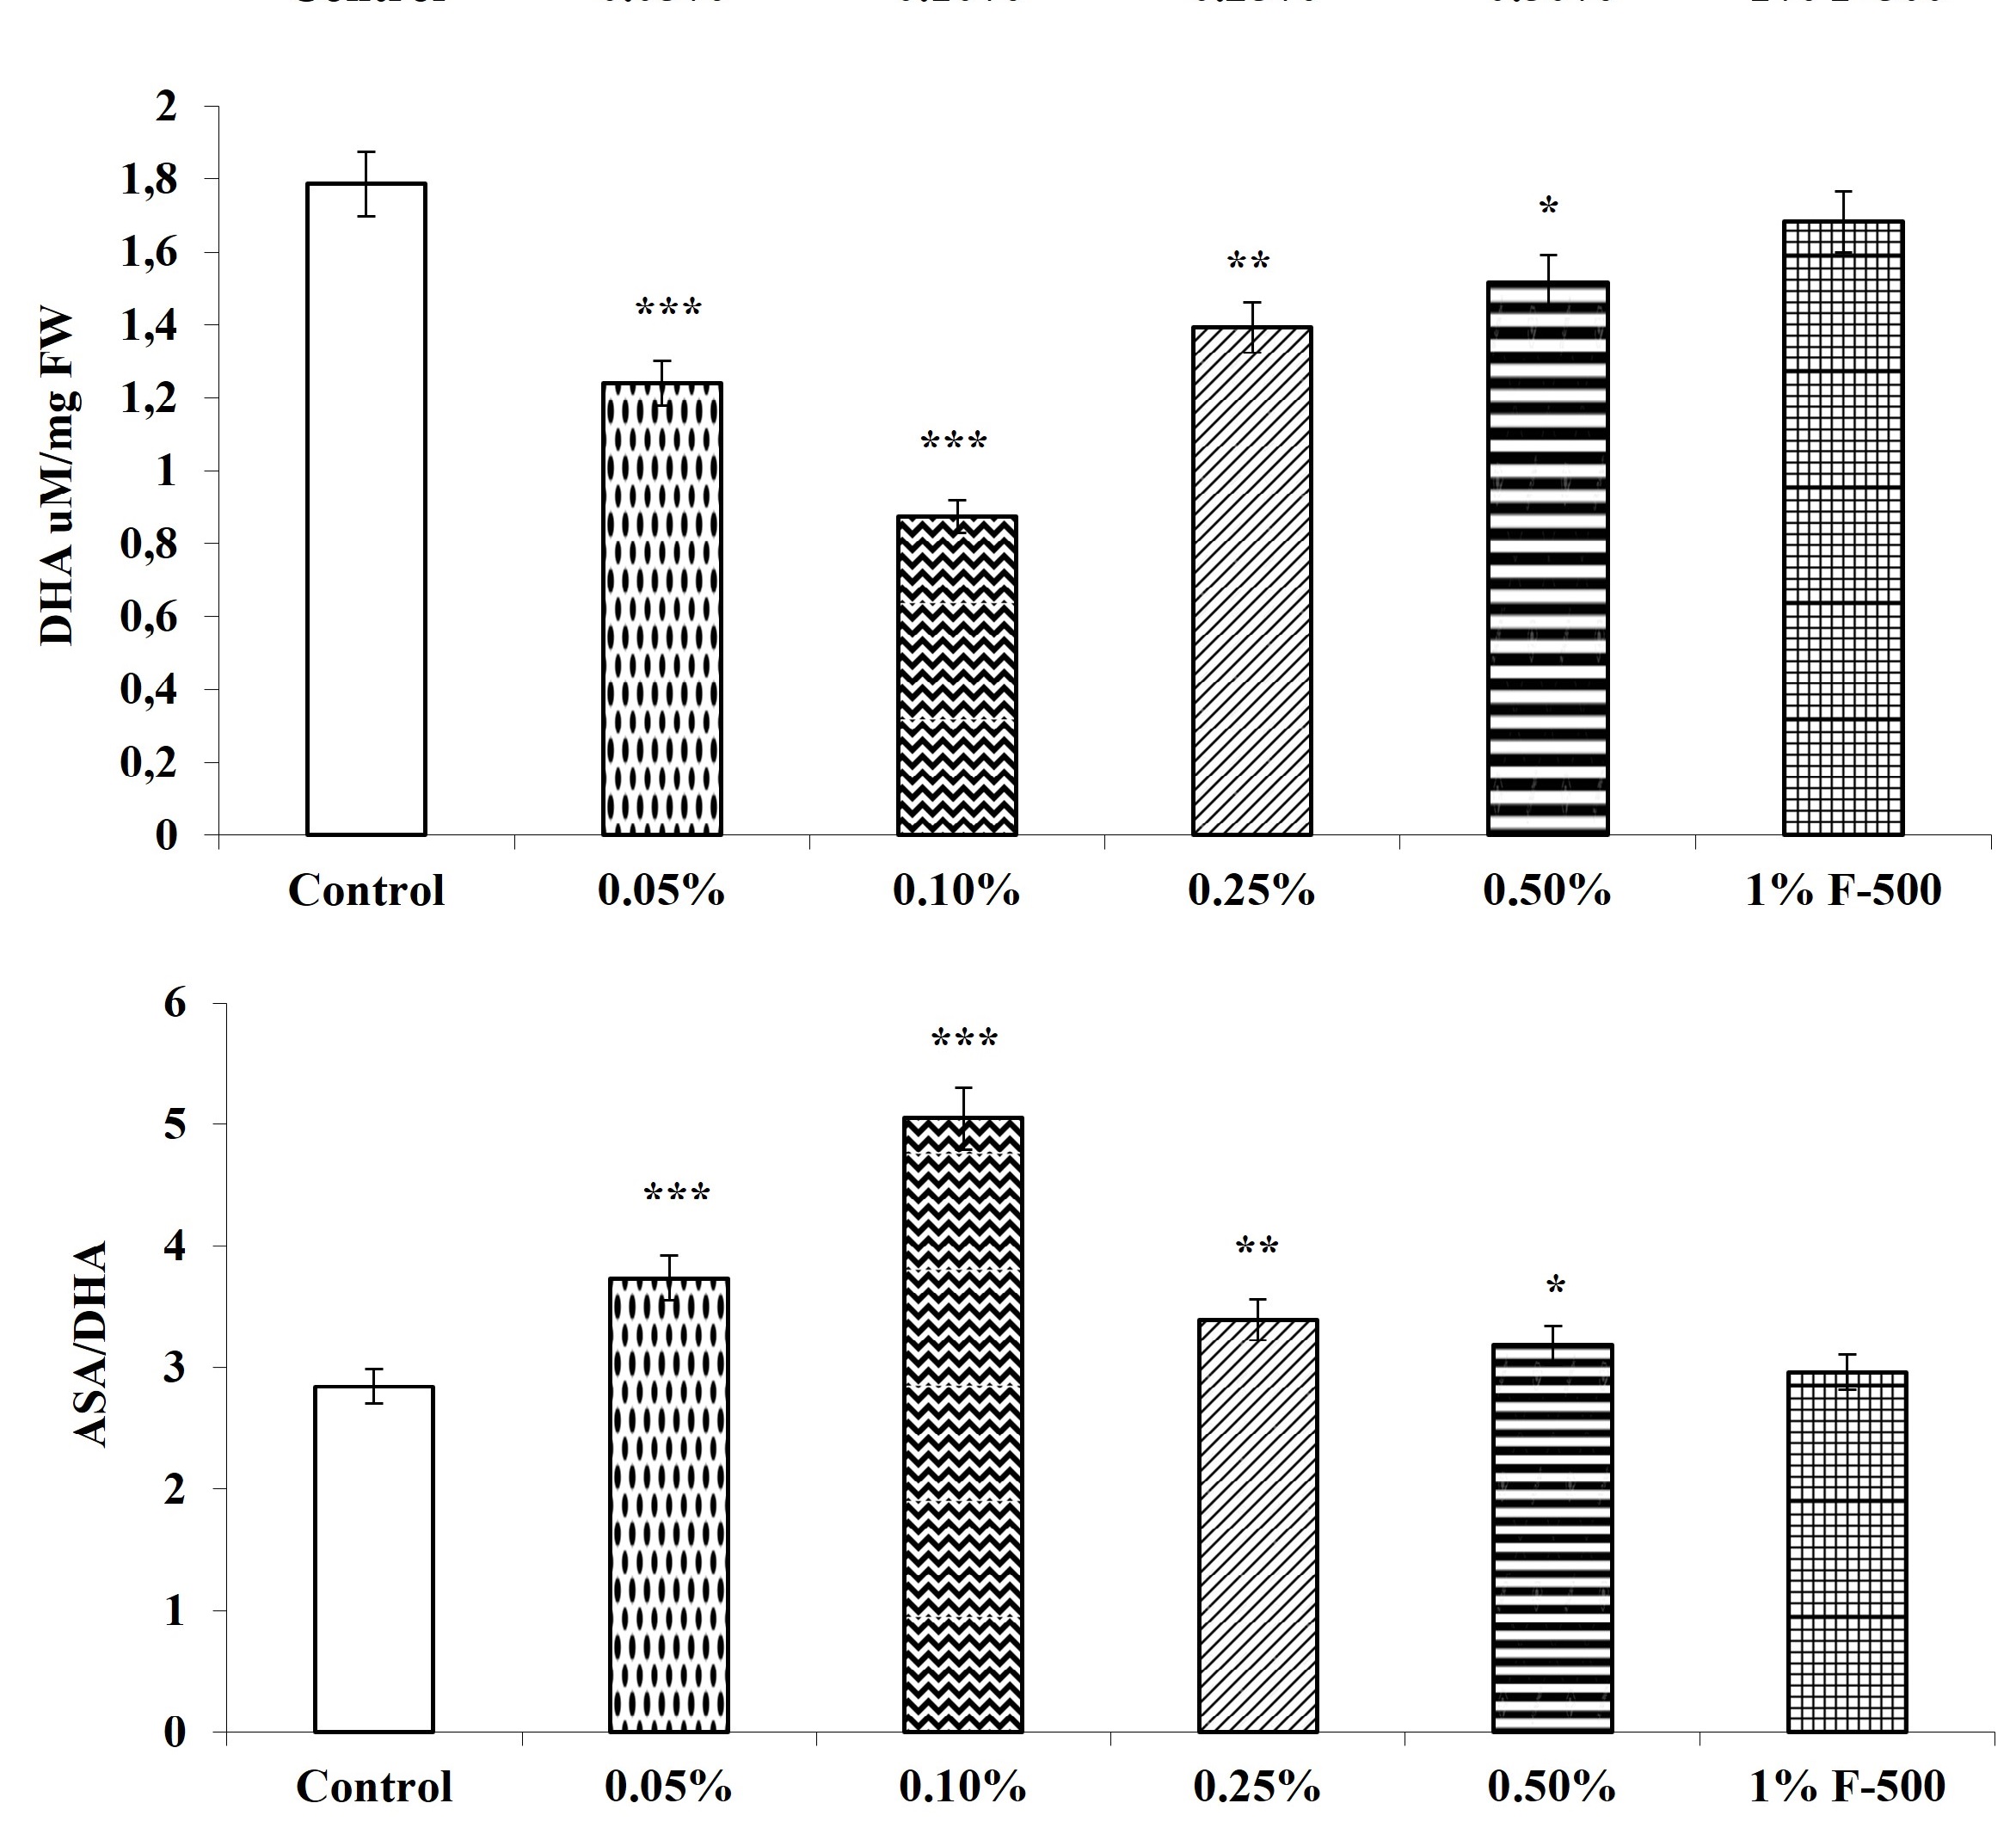
. Ascorbic acid level (ASA)
The total, reduced, and oxidized ASA contents in soybean leaves altered after F500 treatment. The level of total ASA decreased by 13.1% after foliar application of 0.1% F500, whereas reduced ascorbic acid content was increased by 7.5% with the same concentration, as compared to the control. The DHA in leaves was significantly reduced by foliar application of F500. DHA decreased significantly up to 51% in leaves of plants treated with 0.1% F500. The ratio of ASA/DHA increased significantly by 77.5% after foliar application of 0.1% F500 (Figure 10).
Figure 10
Effect of foliar application of pyraclostrobin (F500) on ascorbic acid content of soybean on 45th DAE (day after emergence). The vertical bar indicates mean ± SE. ***, **, and * indicate significance at P < 0.001, 0.01, and 0.05 (Newman–Keuls Multiple Comparison Test), respectively, compared to the control.
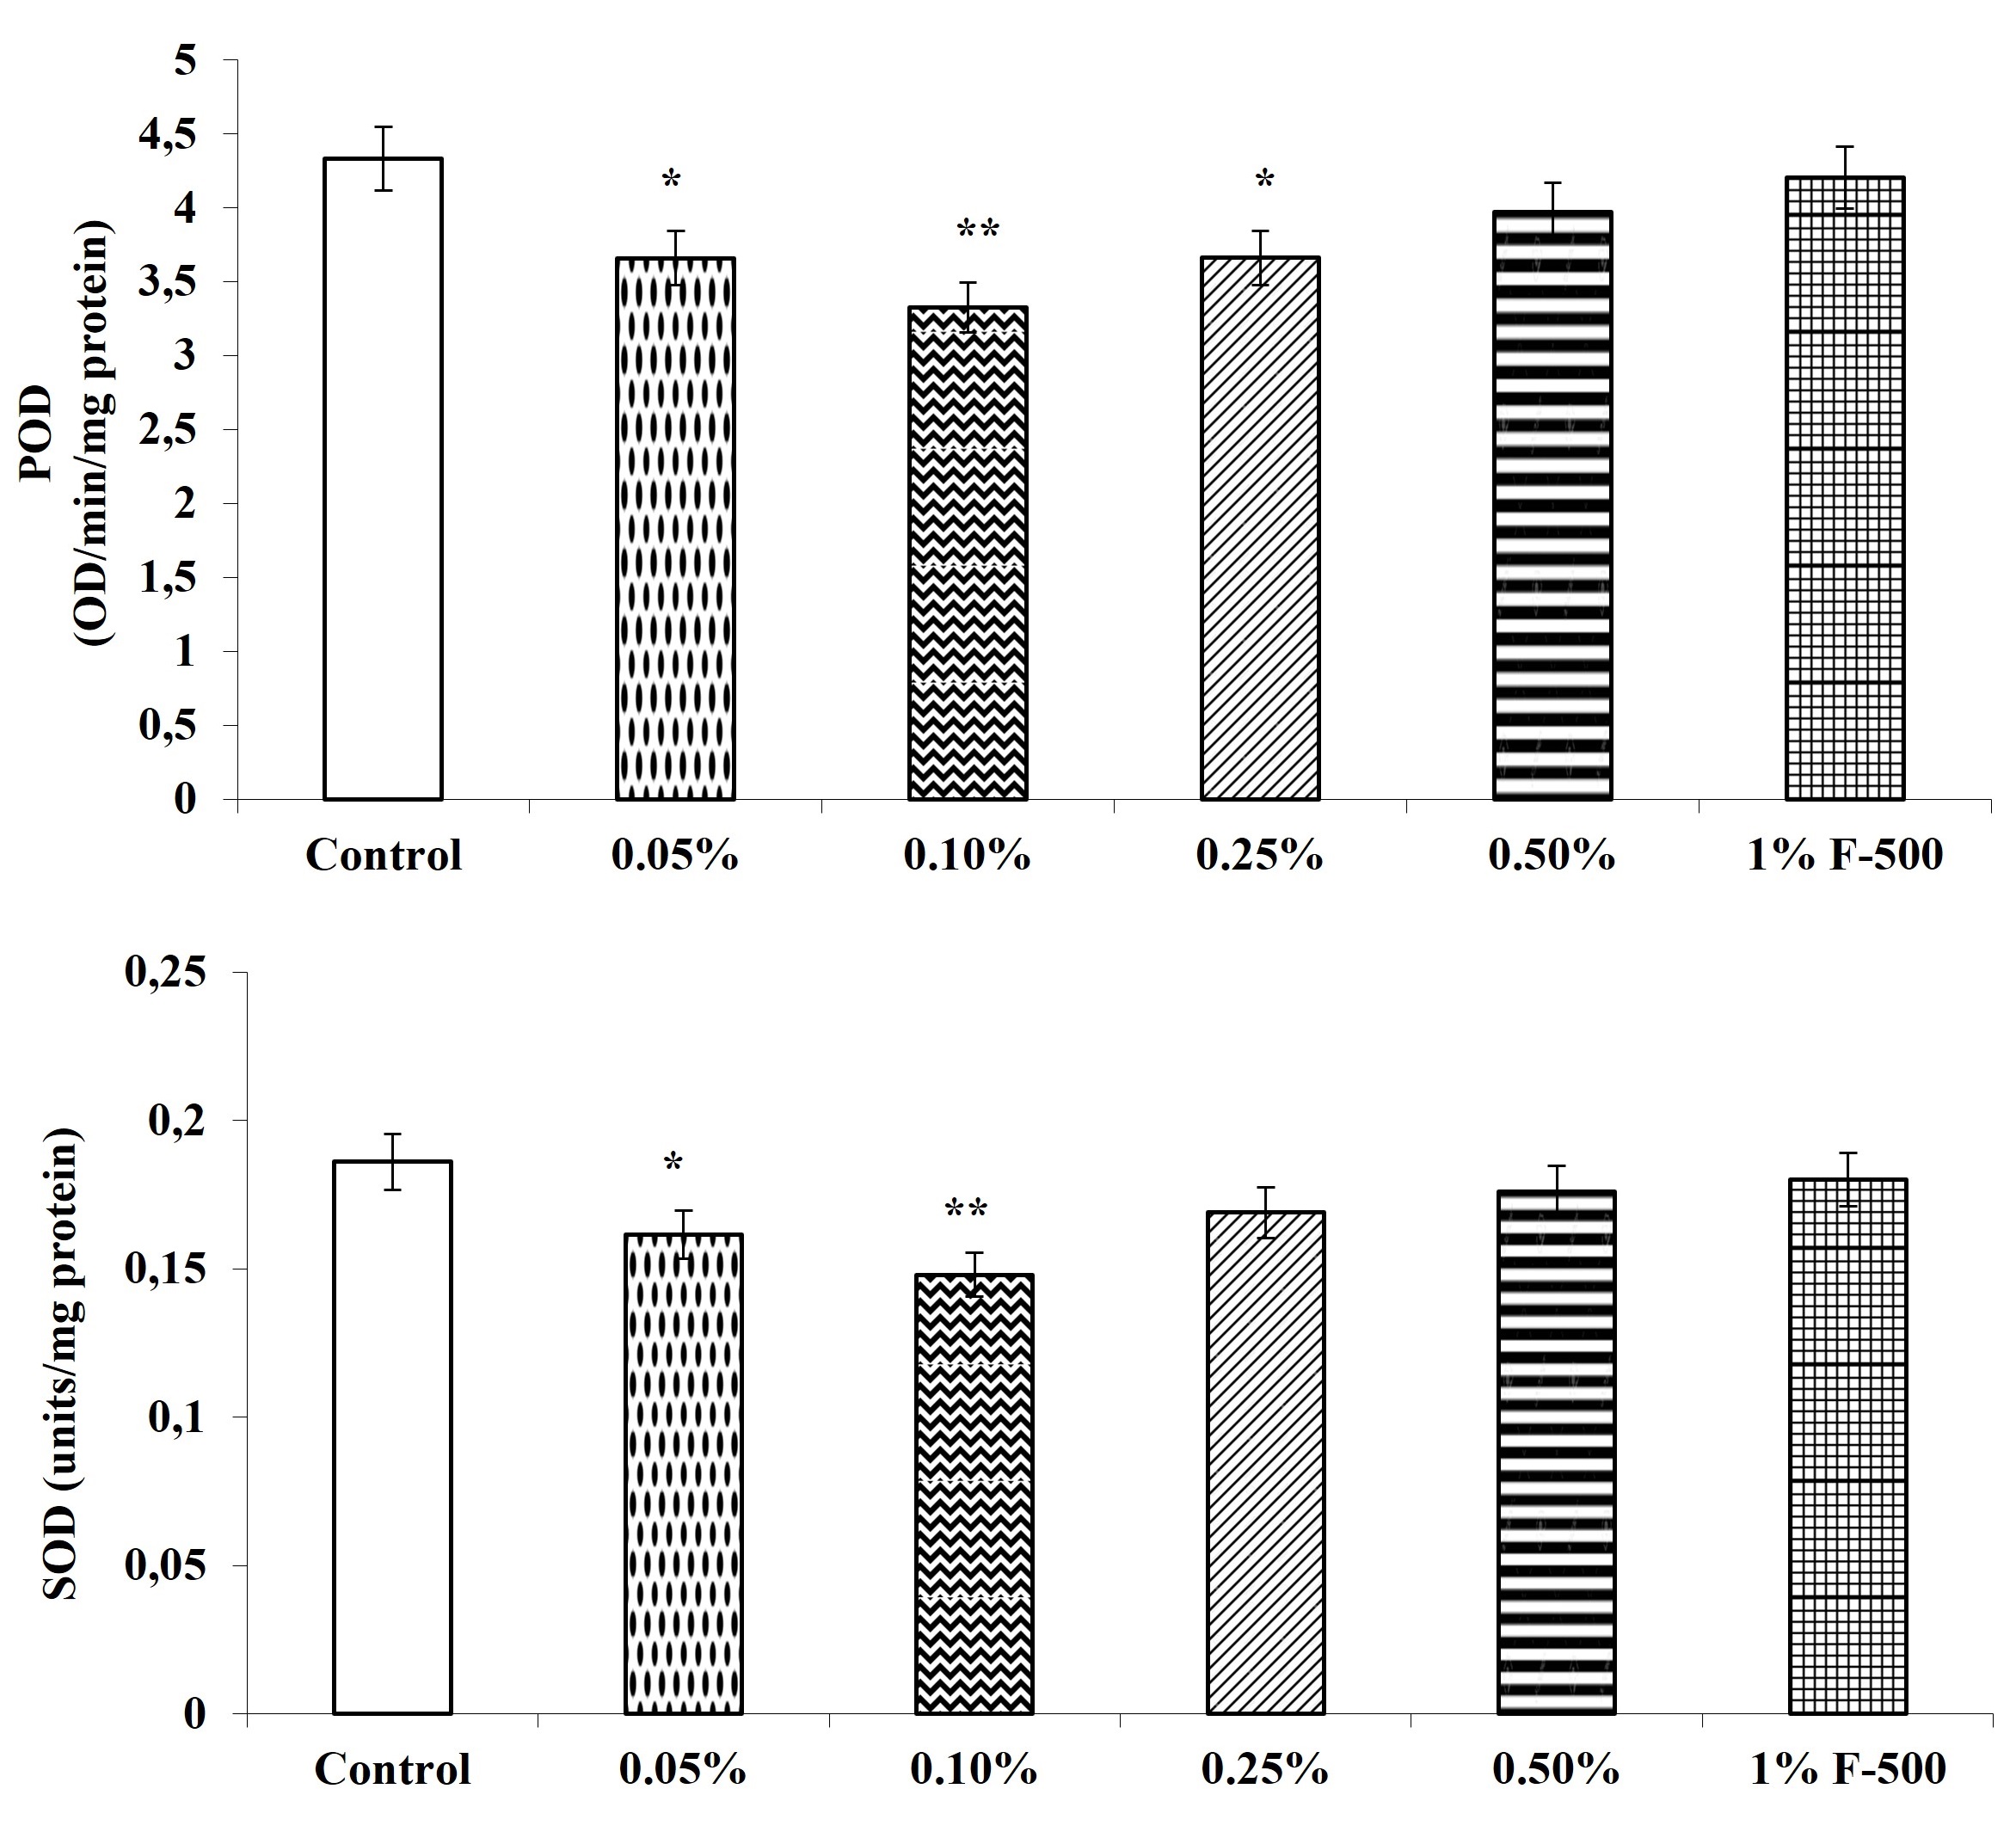
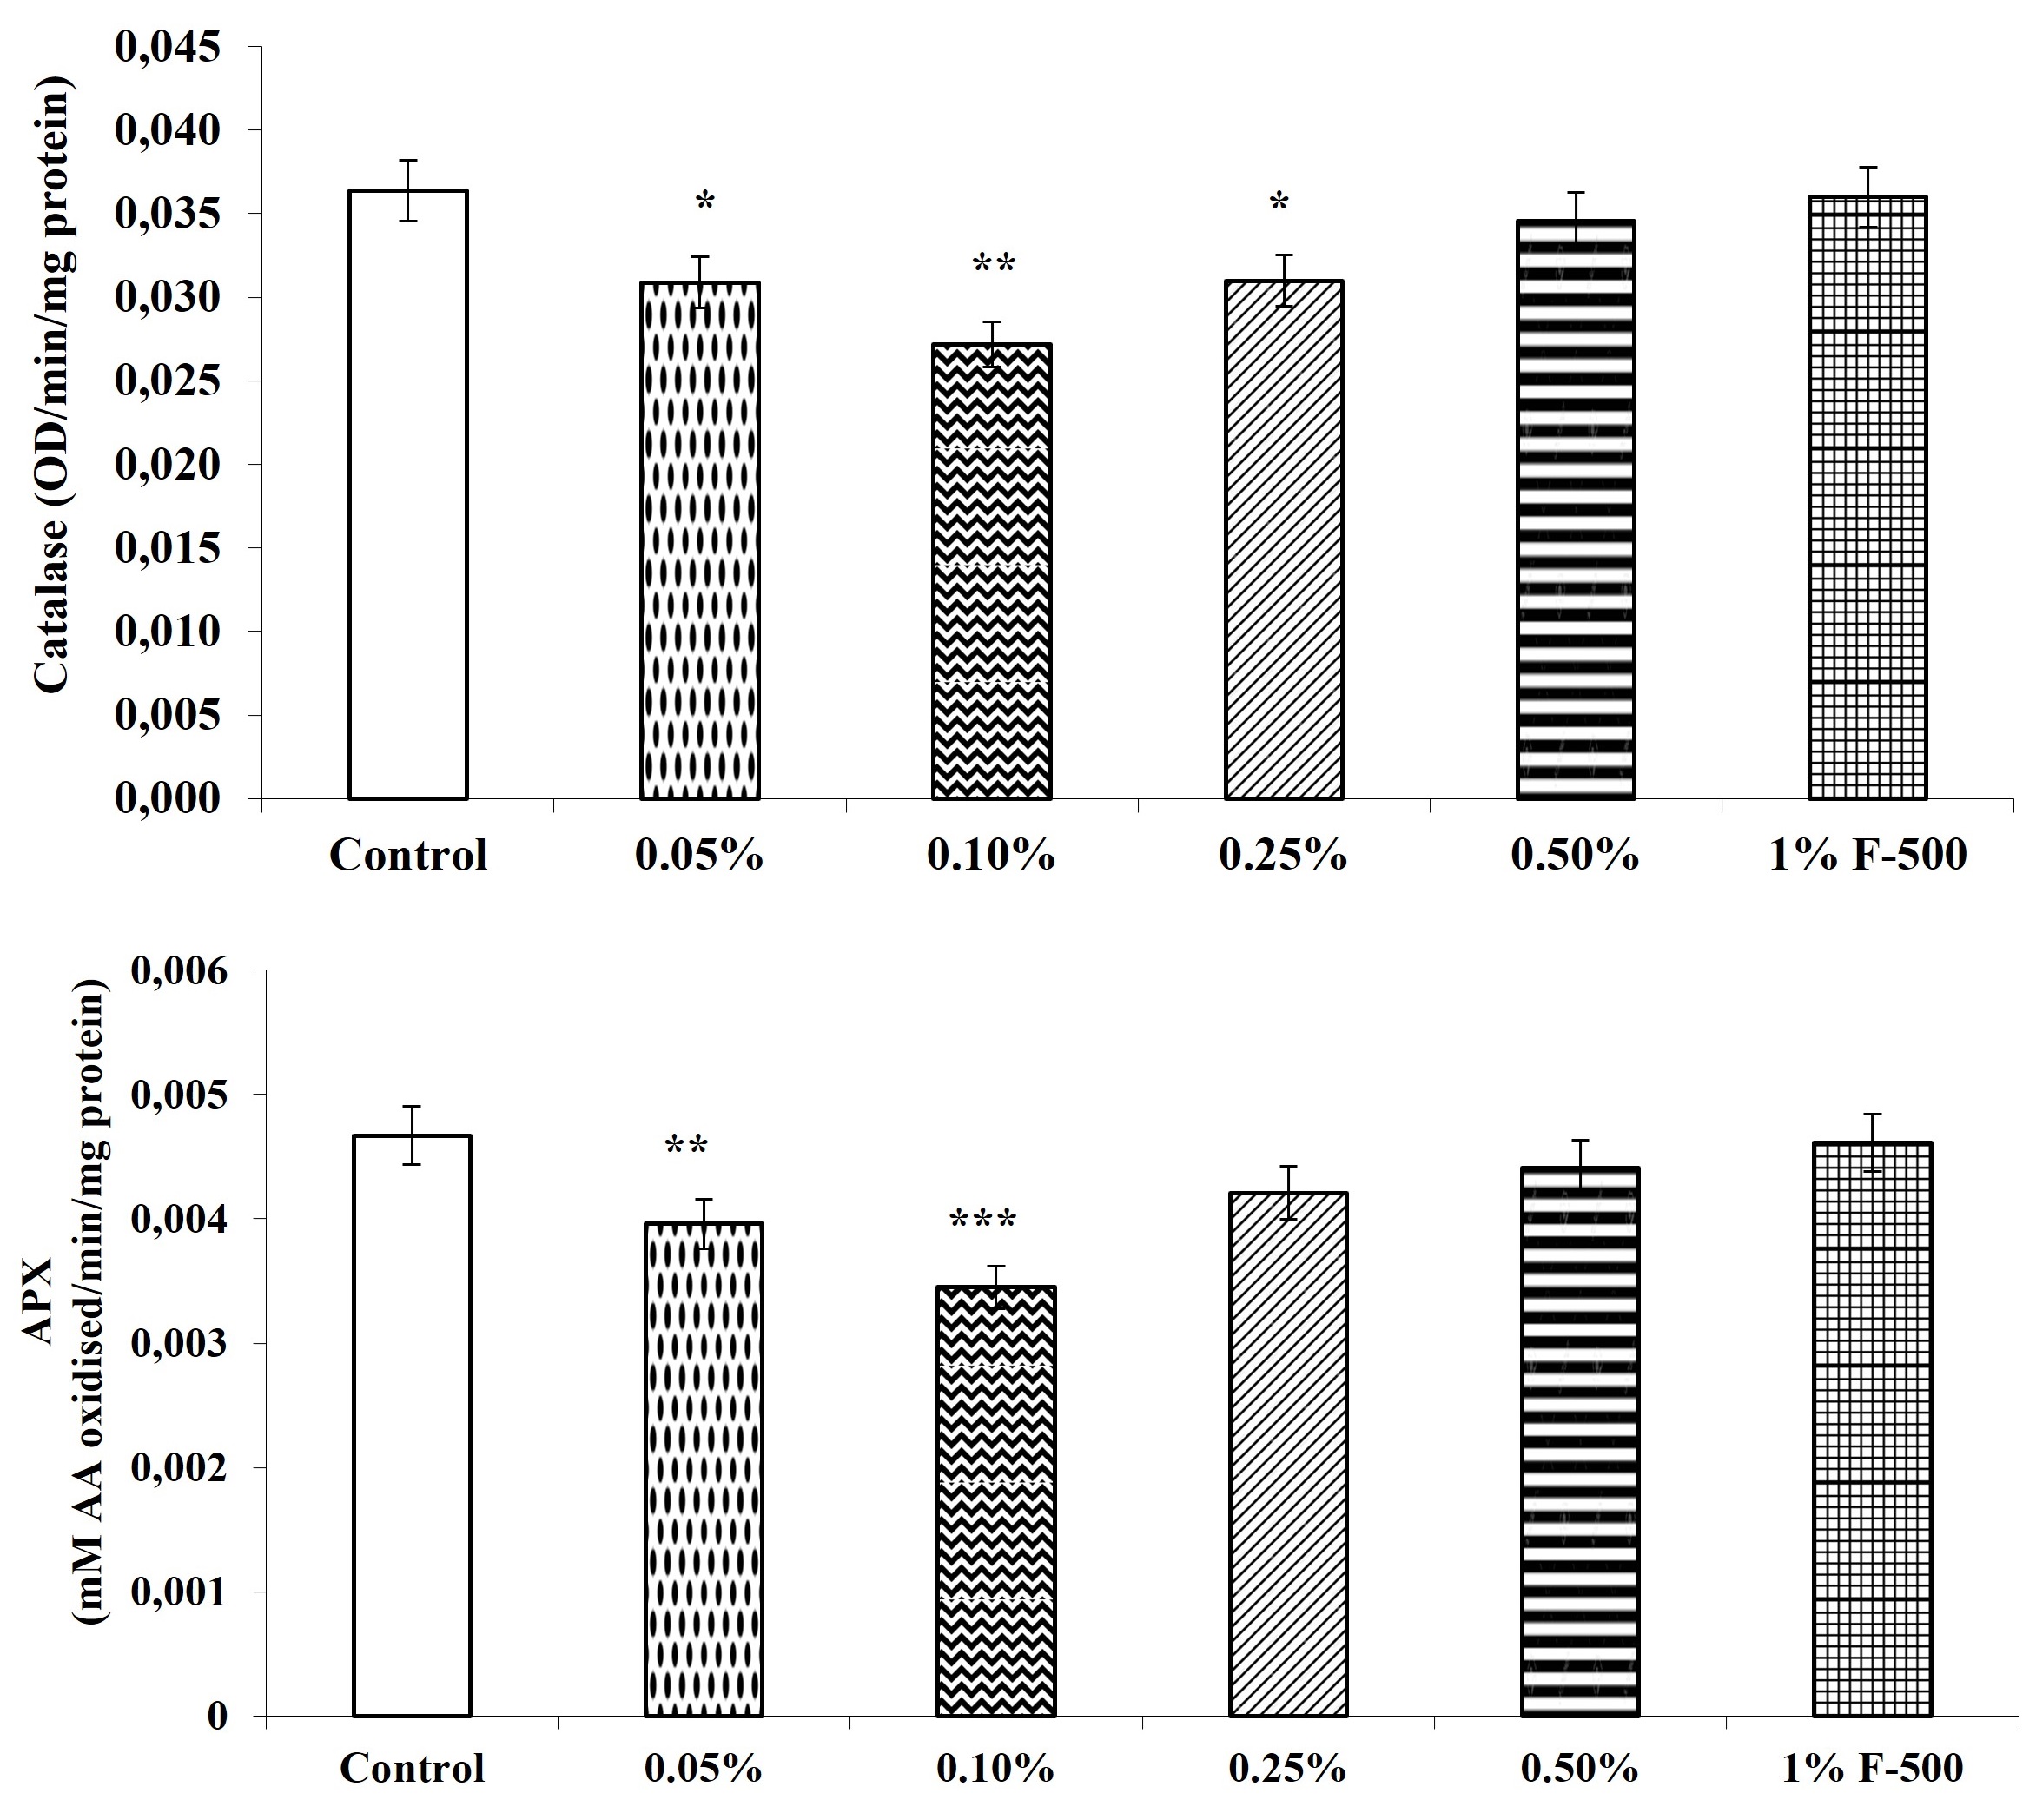
. Antioxidant enzymes
The activity of antioxidant enzymes, i.e., guaiacol peroxidase, ascorbic acid peroxidase, superoxide dismutase, and catalase, were decreased after the F500 application. The highest reduction in the activity of these antioxidant enzymes was observed in plants treated with 0.1% F500, i.e., a decrease of 23% in peroxidase; 20.4% in superoxide dismutase; 25.3% in catalase; and 26.1% in ascorbate peroxidase as compared to the control. The rest of the concentrations showed a decrease of 2.9–15.5% in peroxidase; 3.2–13.1% in superoxide dismutase; 1–15.1% in catalase; and 1.3–15.2% in ascorbate peroxidase as compared to the control (Figure 11).
Figure 11
Effect of foliar application of pyraclostrobin (F500) on antioxidant enzymes of soybean on 45th DAE (day after emergence). The vertical bar indicates mean ± SE. ***, **, and * indicate significance at P < 0.001, 0.01, and 0.05 (Newman–Keuls Multiple Comparison Test), respectively, compared to the control.
. Discussion
Mitigating plant stress, from fungal pathogens or environmental factors, is critical to maximizing crop yield performance. Today, fungal pathogens can be effectively controlled using broad-spectrum fungicides such as the strobilurin class. Interestingly, F500 (pyraclostrobin) strobilurin has been shown to cause long-term changes in the metabolism and growth of treated plants resulting in higher biomass and yield, apart from inducing drought tolerance in the treated plants (Glaab & Kaiser, 1999; Köehle et al., 1997a, 1997b). Our previous study demonstrated that treatment of soybean with pyraclostrobin (F500) improved the growth, nitrogen assimilation, and yield of soybean, suggesting a positive impact of pyraclostrobin (F500) on primary metabolism(Joshi et al., 2014). Thus, keeping these points in view, the present investigation was undertaken in soybean var. JS-335 to study the mechanism by which pyraclostrobin (F500) alters the plant metabolism leading to higher soybean productivity. The present study highlights the effect of strobilurin on biomass, photosynthesis, and oxidative stress.
In this study, the effect of different concentrations of pyraclostrobin (F500) on biomass accumulation, i.e., plant fresh weight and dry weight, showed alteration due to the foliar application of pyraclostrobin (F500). Lower concentrations proved to be more effective; the most effective concentration was 0.1% F500 which enhanced all the parameters significantly compared to the control. The most altered parameter was plant dry weight indicating increased carbon fixation after pyraclostrobin (F500) application. This may be due to the increased leaf area (Joshi et al., 2014), providing more photosynthetic area and increasing carbon fixation in pyraclostrobin (F500)-treated plants. Few earlier studies also supported the positive impact of foliar spray of pyraclostrobin on the physiology of soybean plants (Kanungo & Joshi, 2014; Nason et al., 2007; Swoboda & Pedersen, 2009).
The photosynthetic pigments: chl a, chl b, and total chl content increased significantly after pyraclostrobin (F500) treatment which is in accordance with many earlier findings as chlorophyll retention is a prominent feature of strobilurins (Li et al., 2020). For instance, senescence is delayed in wheat plants, and its grain yield is enhanced after strobilurin application (Habermeyer et al., 1998; McCartney et al., 2007; Zhang et al., 2010). Carotenoids play an important role in mitigating plant stress and hence are indicators for the same (Swapnil et al., 2021). However, no significant difference was observed in carotenoid content in the present study indicating alleviation of oxidative stress after pyraclostrobin (F500) treatment.
We studied chl a fluorescence in treated and untreated plants using a Handy PEA fluorimeter (Plant Efficiency Analyzer, Hansatech Instruments, King’s Lynn, Norfolk, UK). To the best of our knowledge, this is the first investigation that reports the positive effect of pyraclostrobin (F500) on the chl a fluorescence of soybean. Some of the increase in soybean leaf area may potentially be explained by derived chlorophyll a fluorescence parameter (ETo/CSm and TRo/CSm), as these parameters increase after pyraclostrobin (F500) treatment. This reflects that the estimated electron fluxes per cross-section (quantum yield) and trapped energy (maximum) flux per cross-section of soybean leaf sample is increasing, leading to CO2 fixation in the Calvin–Benson cycle resulting in biomass allocation for leaf growth. Results of the chlorophyll a fluorescence reported here reveal that leaves of soybean plants treated with pyraclostrobin (F500) had higher reducing power with higher efficiency of electron transport. In these experiments, lower fluorescence in control was due to both retardation of electron flow and decrease in absorption cross-section area. It has been pointed out that the performance index (PI) is regulated by the accumulation of effects on both the biophysical and the biochemical performance of the photosynthetic apparatus (Kalaji et al., 2016; Strasser et al., 2004; Van Heerden et al., 2003). A significant increase in the PI of soybean leaf suggests that the vitality has increased after pyraclostrobin (F500) treatment.
Rate of photosynthesis, stomatal conductance, and transpiration were found to increase after pyraclostrobin (F500) application in the present study which strengthens the evidence of increased carbon fixation after pyraclostrobin (F500) application which is similar to observations reported in wheat (Köehle et al., 1997a, 1997b; Grossmann et al., 1999; Häuser-Hahn et al., 2004; Oerke et al., 2005). Taken together, our findings on photosynthesis indicate a higher amount of carbon fixation by the application of pyraclostrobin (F500).
Additionally, we measured antioxidant levels and antioxidant enzyme activities to determine the oxidative stress level of treated and untreated plants. The antioxidants viz. total ASA and DHA; antioxidant enzymes viz. POD, SOD, APX, and catalase were reduced after the pyraclostrobin (F500) application. This revealed that pyraclostrobin (F500) alleviates oxidative stress plants might be facing under natural conditions, which diverts the conserved energy towards primary metabolism resulting in additional fixation of CO2 as indicated by our chl a fluorescence and gas exchange parameters. Earlier studies have also shown that F500 alleviates oxidative plant stress (Köehle et al., 2003). In contrast to our study, Zhang et al. (2010) reported that strobilurins increased the activity of these antioxidant enzymes and protected the plants from harmful active oxygen species.
In conclusion, this study suggests that foliar application of pyraclostrobin mitigates oxidative stress, which in turn enhances the electron transport per cross-section of the leaf and the activity of carbonic anhydrase enzyme that ultimately increases the rate of photosynthesis, leading to enhance biomass accumulation and justifies yield enhancement of soybean as reported in our previous study (Joshi et al., 2014).
