. Introduction
Strawberry (Fragaria × ananassa Duch.) is an important fruit crop with high economic and nutritional value because it is rich in health-promoting antioxidants (Hossain et al., 2016). Currently, two types of strawberry varieties are in cultivation: day-neutral and short-day varieties. These two types of varieties differ in their flowering period. Short-day varieties have a 4–6-week flowering period and bloom only when the temperature is below 20 °C, and the dark period (more than 12 hours) is relatively long. By contrast, day-neutral varieties begin to flower approximately ten weeks after planting and flower at a temperature of 5 °C–30 °C, regardless of the length of the day (Orde & Sideman, 2019). Some strawberry cultivars, such as Marak and Camarosa, are well adapted to the tropical climate and environmental temperatures above 35 °C (Asadpoor & Tavallali, 2015).
In Indonesia, strawberry was commonly cultivated in areas with elevations >800 m above sea level as the availability of commercial cultivars was developed for highland purposes. On the other hand, the adaptation of the growth of strawberries in the lowland area was still facing the challenge of high-quality fruit production. Previous studies have demonstrated that 50% and 70% shading could adapt the growth of highland strawberry cultivars in the lowland area (Nugroho et al., 2023), but the application of the N–P–K fertilizer combined with organic fertilizers did not give any significant responses (Nurchasanah et al., 2020). Plant cultivation techniques using artificial light can serve as an alternative for modifying the tropical climate, such as shortening the crop cycle of annual crops such as barley, pea, and canola (Ghosh et al., 2018). Furthermore, the optimal lighting of the light-emitting diode (LED) can increase the yield and quality of strawberry fruit (Choi et al., 2015; Nadalini et al., 2017; Naznin et al., 2016). In addition, the translocation of carbohydrates during fruit filling can be optimized without interference from other sink competitors to increase fruit yield and quality (Wargent, 2016).
Three different types of LEDs were used to cultivate strawberry plants: red, blue, and red-blue spectrum. LEDs can produce enough photons for plants while generating less heat. LEDs are advantageous since they can be applied to plants to increase plant photosynthesis. Moreover, LEDs can be used not only to facilitate the regulation of light intensity, spectrum, and energy but also to manipulate secondary metabolites in target plants to increase plant productivity and quality (Darko et al., 2014).
LEDs have been shown to improve the yield and quality of strawberries. For example, using red and blue LEDs at a ratio of 1:9 increased the number of flower stalks on strawberry plants (Naznin et al., 2016). In addition, compared with controls, LEDs increased the anthocyanin content in strawberries (Nadalini et al., 2017). Furthermore, 12 h and 8 h irradiation with LEDs as an artificial light source shortened the juvenile period of blueberry (Ohishi-Yamazaki et al., 2018). In addition, LEDs have been known to affect gene expression in plants, including anthocyanin biosynthesis genes (DFR and ANS) in strawberries, the cryptochrome gene (CRY1), which encodes the cryptochrome protein and is sensitive to blue light, and phytochrome A (PHYA), which acts as a red/far-blue light photoreceptor (Zhang et al., 2018).
LEDs can support precision agriculture based on green ecology as an alternative to traditional cultivation techniques. However, research on light intensity, quality, and duration is ongoing to determine the best conditions for cultivating tropical lowlands. This study aims to optimize the light intensity, spectra, and duration for strawberry cultivation in lowlands using physiological, gene expression, and metabolomics approaches.
. Materials and methods
. Plant material and growth conditions
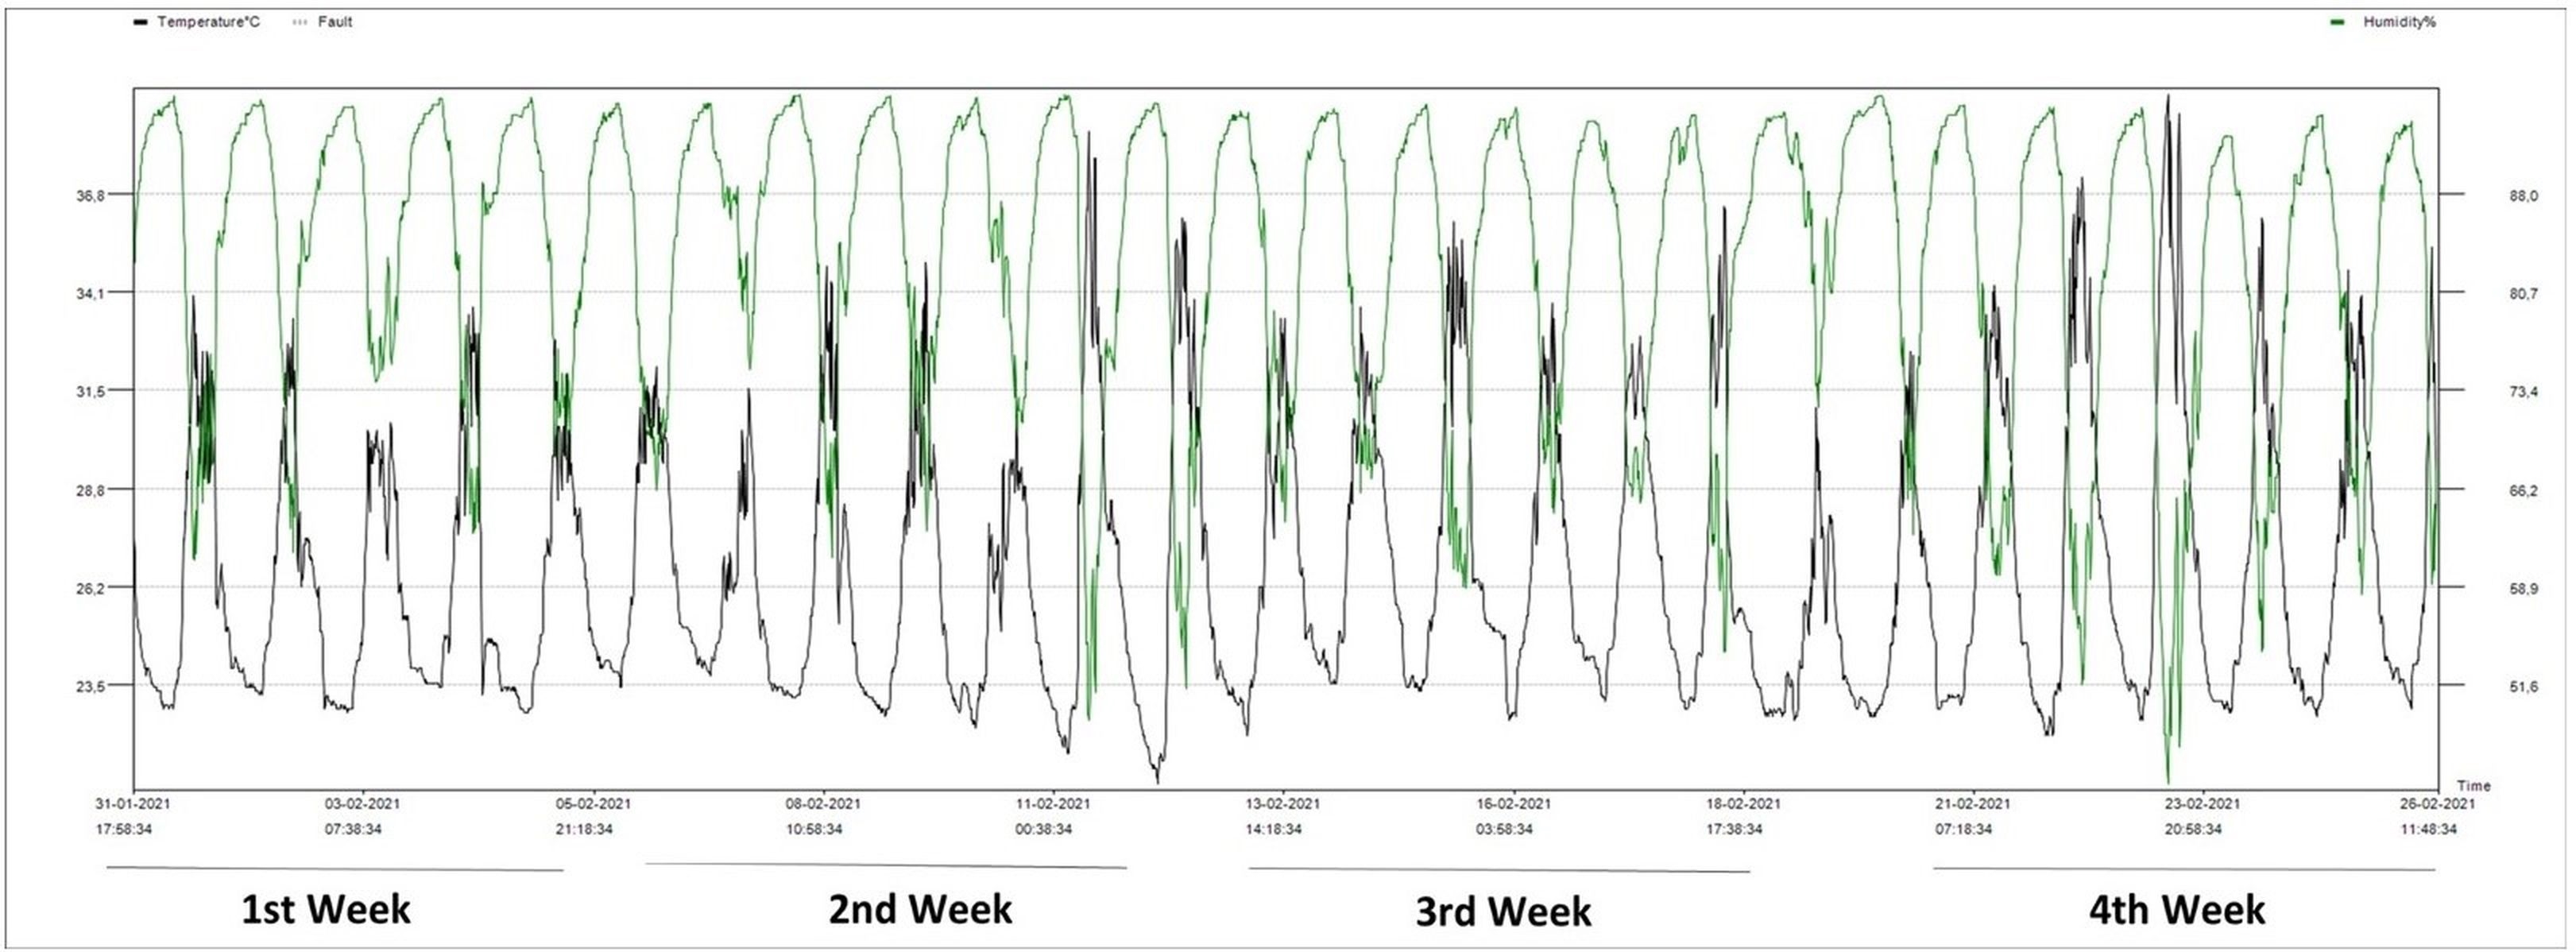
Seedlings of the commercial strawberry cultivar California were obtained from Lembang, Bandung. Strawberry planting was carried out in the Screen House, Leuwikopo Experimental Garden, Dramaga Campus of IPB, Bogor (6°33′45.15″ S, 106°43′11.91″ E, 178.6 m above sea level). The average daily temperature during the growing cycle was 26.5 °C (range: 20.9–39.4 °C), and the average humidity was 83.7% (range: 44.3%–95.3%) (Figure 1).
Figure 1
Temperature and humidity data measured with an Elitech RC-4HC digital thermometer at the study site.
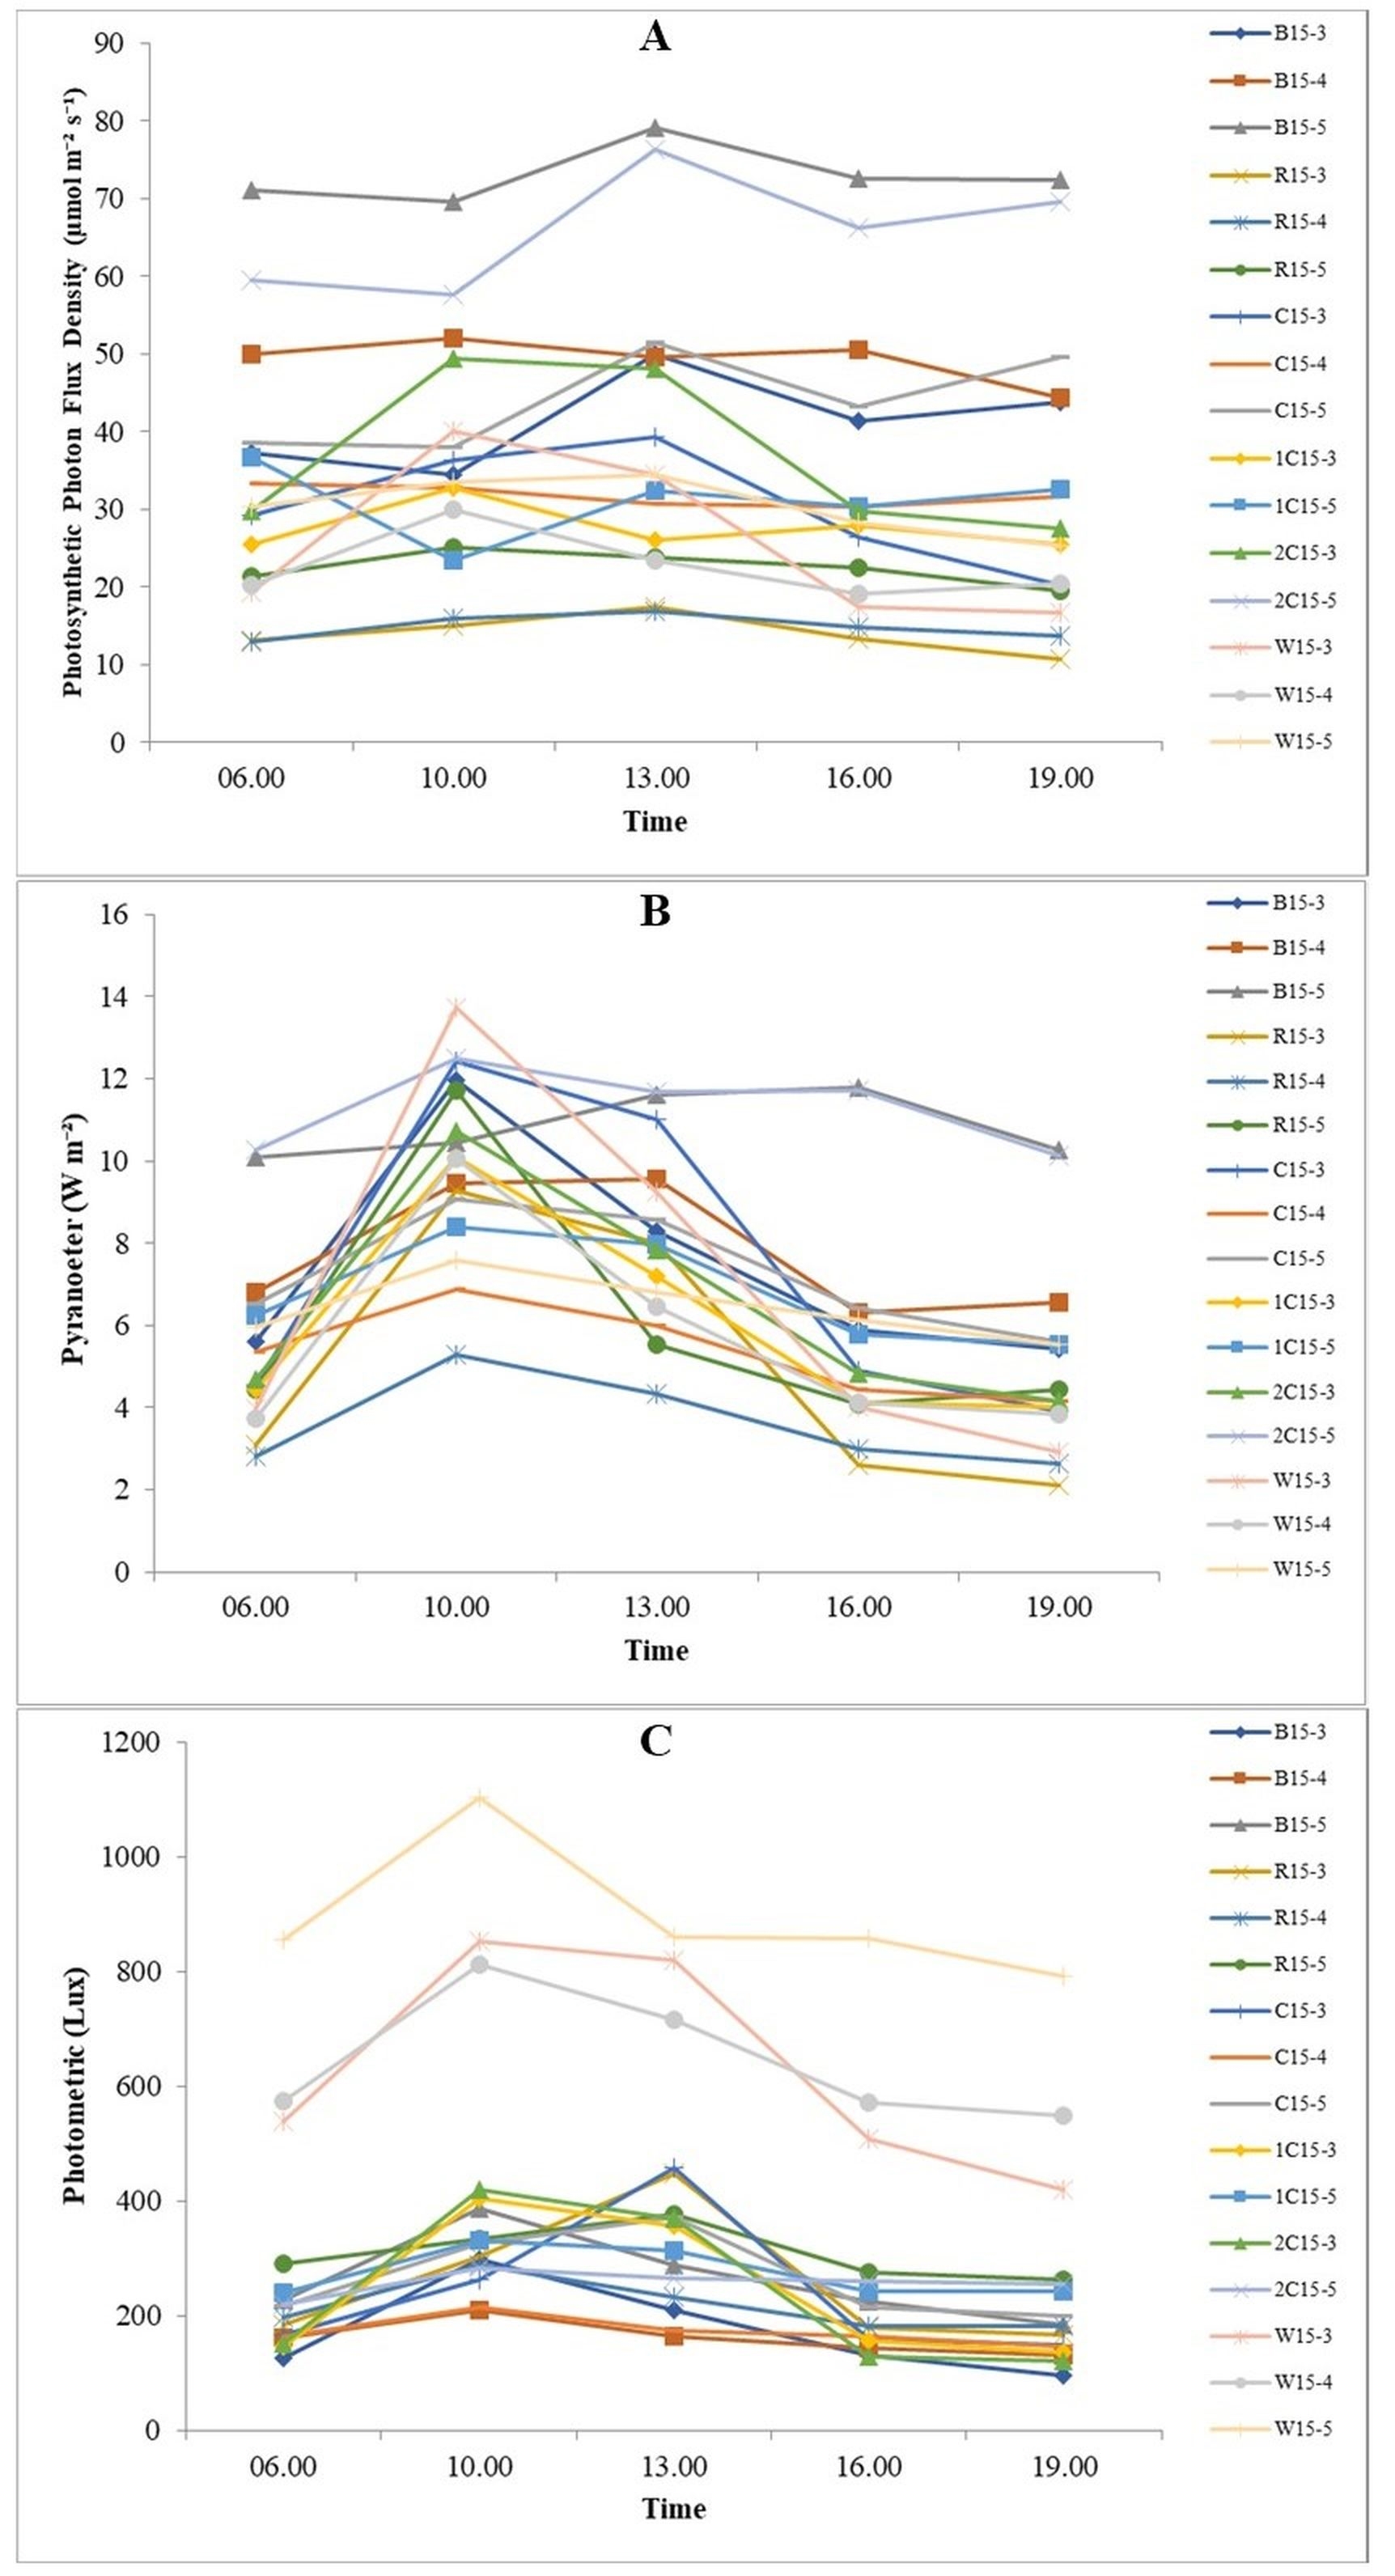
Strawberries were transferred to a mixed planting medium of soil, husk, and manure (1:1:1). The study used four types of LED sources (blue, red, blue/red combination, and white) with low, medium, and high light intensity (Figure 2). Two irradiation durations of 15 and 21 h were tested. Each treatment consisted of three replications, with six plants per replication. The LEDs were assembled on a shelf with a canopy distance of approximately 15 cm. The light quality was measured with the LI-250A Light Meter (LI-COR Biosciences) using three sensors: Quantum (Q107790), Photometric (PH100619), and Pyranometer (PY106198). The plants were watered manually once every two days up to 100 ml per plant. The NPK fertilizer was applied to the plants every two weeks using the pour thru method, with a recommended dose of 1–3 g per plant (Choopong & Veirheij, 1997).
Figure 2
Light parameters of LEDs at the study site measured using the LI-250A Light Meter every three hours. (A) PPFD value (µmol m−2 s−1) generated by each type of LED; (B) amount of radiation (W m−2); (C) value of light intensity (lux).
Note: B15-3 = blue 15 hours of low intensity, B15-4 = blue 15 hours of medium intensity, B15-5 = blue 15 hours of high intensity, R15-3 = red 15 hours of low intensity, R15-4 = red 15 hours of intensity medium, R15-5 = red 15 hours high intensity, C15-3 = blue/red combination (1:1) 15 hours low intensity, C15-4 = blue/red combination (1:1) 15 hours medium intensity, C15-5 = blue/red combination (1:1) 15 hours high intensity, 1C15-3 = blue/red combination (1:2) 15 hours low intensity, 1C15-5 = blue/red combination (1:2) 15 hours intensity high, 2C15-3 = blue/red combination (2:1) 15 hours low intensity, 2C15-5 = blue/red combination (2:1) 15 hours high intensity, W15-3 = white 15 hours low, W15-4 = white 15 hours medium intensity, W15-5 = white 15 hours high intensity.
. Measurement of photosynthesis parameters, chlorophyll and sugar contents
Perfectly opened strawberry leaves were selected after four weeks of light treatment, and photosynthetic parameters were measured using the LI-6800 Portable Photosynthesis System (LI-COR) with default parameters. The value of light intensity was measured five times during the experiment using the Li-250A instrument (Figure 2). Photosynthetic photon flux density (PPFD) represents the number of photons (µmol m−2 s−1) used for photosynthesis in the range of photosynthetically active radiation (400–700 nm); this wavelength range (blue and red light spectrum) is the most important for photosynthesis (Ouzounis et al., 2015). Blue LEDs are more quantum efficient (higher PPFD) than red and white LEDs (Pennisi et al., 2019).
Chlorophyll content was determined after one month of the light treatment using the spectrophotometric method (Warren, 2008). Briefly, leaf samples (area = 0.56 cm2) were homogenized in 1 ml of methanol using a mortar. The extract was transferred into a microfuge tube and centrifuged at 13,000 × g for 2 min. Then, the absorbance value of the supernatant was read with a spectrophotometer to determine the chlorophyll content. Soluble sugar content (glucose and fructose) was measured one month after the treatment using the D-fructose/D-glucose Assay Kit K-FRGLQR Kit (Megazyme), as described previously (Lanoue et al., 2019). Briefly, leaf samples (area = 0.56 cm2) were extracted three times in a microfuge tube in 1 ml of an ethanol solution at 80 °C for 30 min. Then, the sample was dried in an oven, resuspended in a solution of distilled water and chloroform (2:1), and centrifuged at 2,200 × g for 3 min. The soluble suspension was then separated from the chloroform-soluble fraction, and the supernatant was analyzed using the Multiskan Sky Microplate Spectrophotometer (Thermo Fisher), according to the manufacturer’s instructions.
. Secondary metabolite profiling
One month after the light treatment, leaf samples were collected and transferred to a conical tube. The sample was prepared before injection into the gas chromatography-mass spectrometry (GC–MS) analysis system with Agilent Technologies 7890A/G3440A 5975C inert/G3171A (Halim et al., 2019). Metabolite data were analyzed using the gplots, cluster, ggplot2, factoextra, magrittr, dendextend, and igraph packages of the R studio 4.0 software.
. Gene expression analysis
Strawberry leaf samples (100 mg) from each treatment were collected and stored in RNALater (Sigma-Aldrich) until needed for RNA extraction. First, RNA was isolated using the Hot-borate method, with slight modifications (Matra et al., 2019; Wan & Wilkins, 1994). Then, cDNA was constructed using the ReverTra Ace qPCR RT Master Mix with gDNA Remover (Toyobo). Eighteen target genes were selected for gene expression analysis, with two housekeeping genes (actin and MSI). Quantitative real-time PCR (qRT-PCR) analysis was performed using the SensiFASTTM SYBR®; Hi-ROX Kit (Bioline), according to the manufacturer’s protocol, on the StepOne Real-Time PCR System (Applied Biosystems). The threshold cycle (Ct) data were processed with StepOne Software v2.3 (Applied Biosystems), and gene expression was calculated using the 2ΔΔCt method (Livak & Schmittgen, 2001; Matra et al., 2019).
. Data analysis
The data were analyzed using analysis of variance (ANOVA) at a significance level of 5% to evaluate treatment effects. Post hoc testing was conducted using Duncan’s Multiple Range Test (DMRT). Data analysis was performed using SAS software (SAS OnDemand for Academics Version, https://welcome.oda.sas.com/).
. Results
. Photosynthesis responses to medium-intensity light
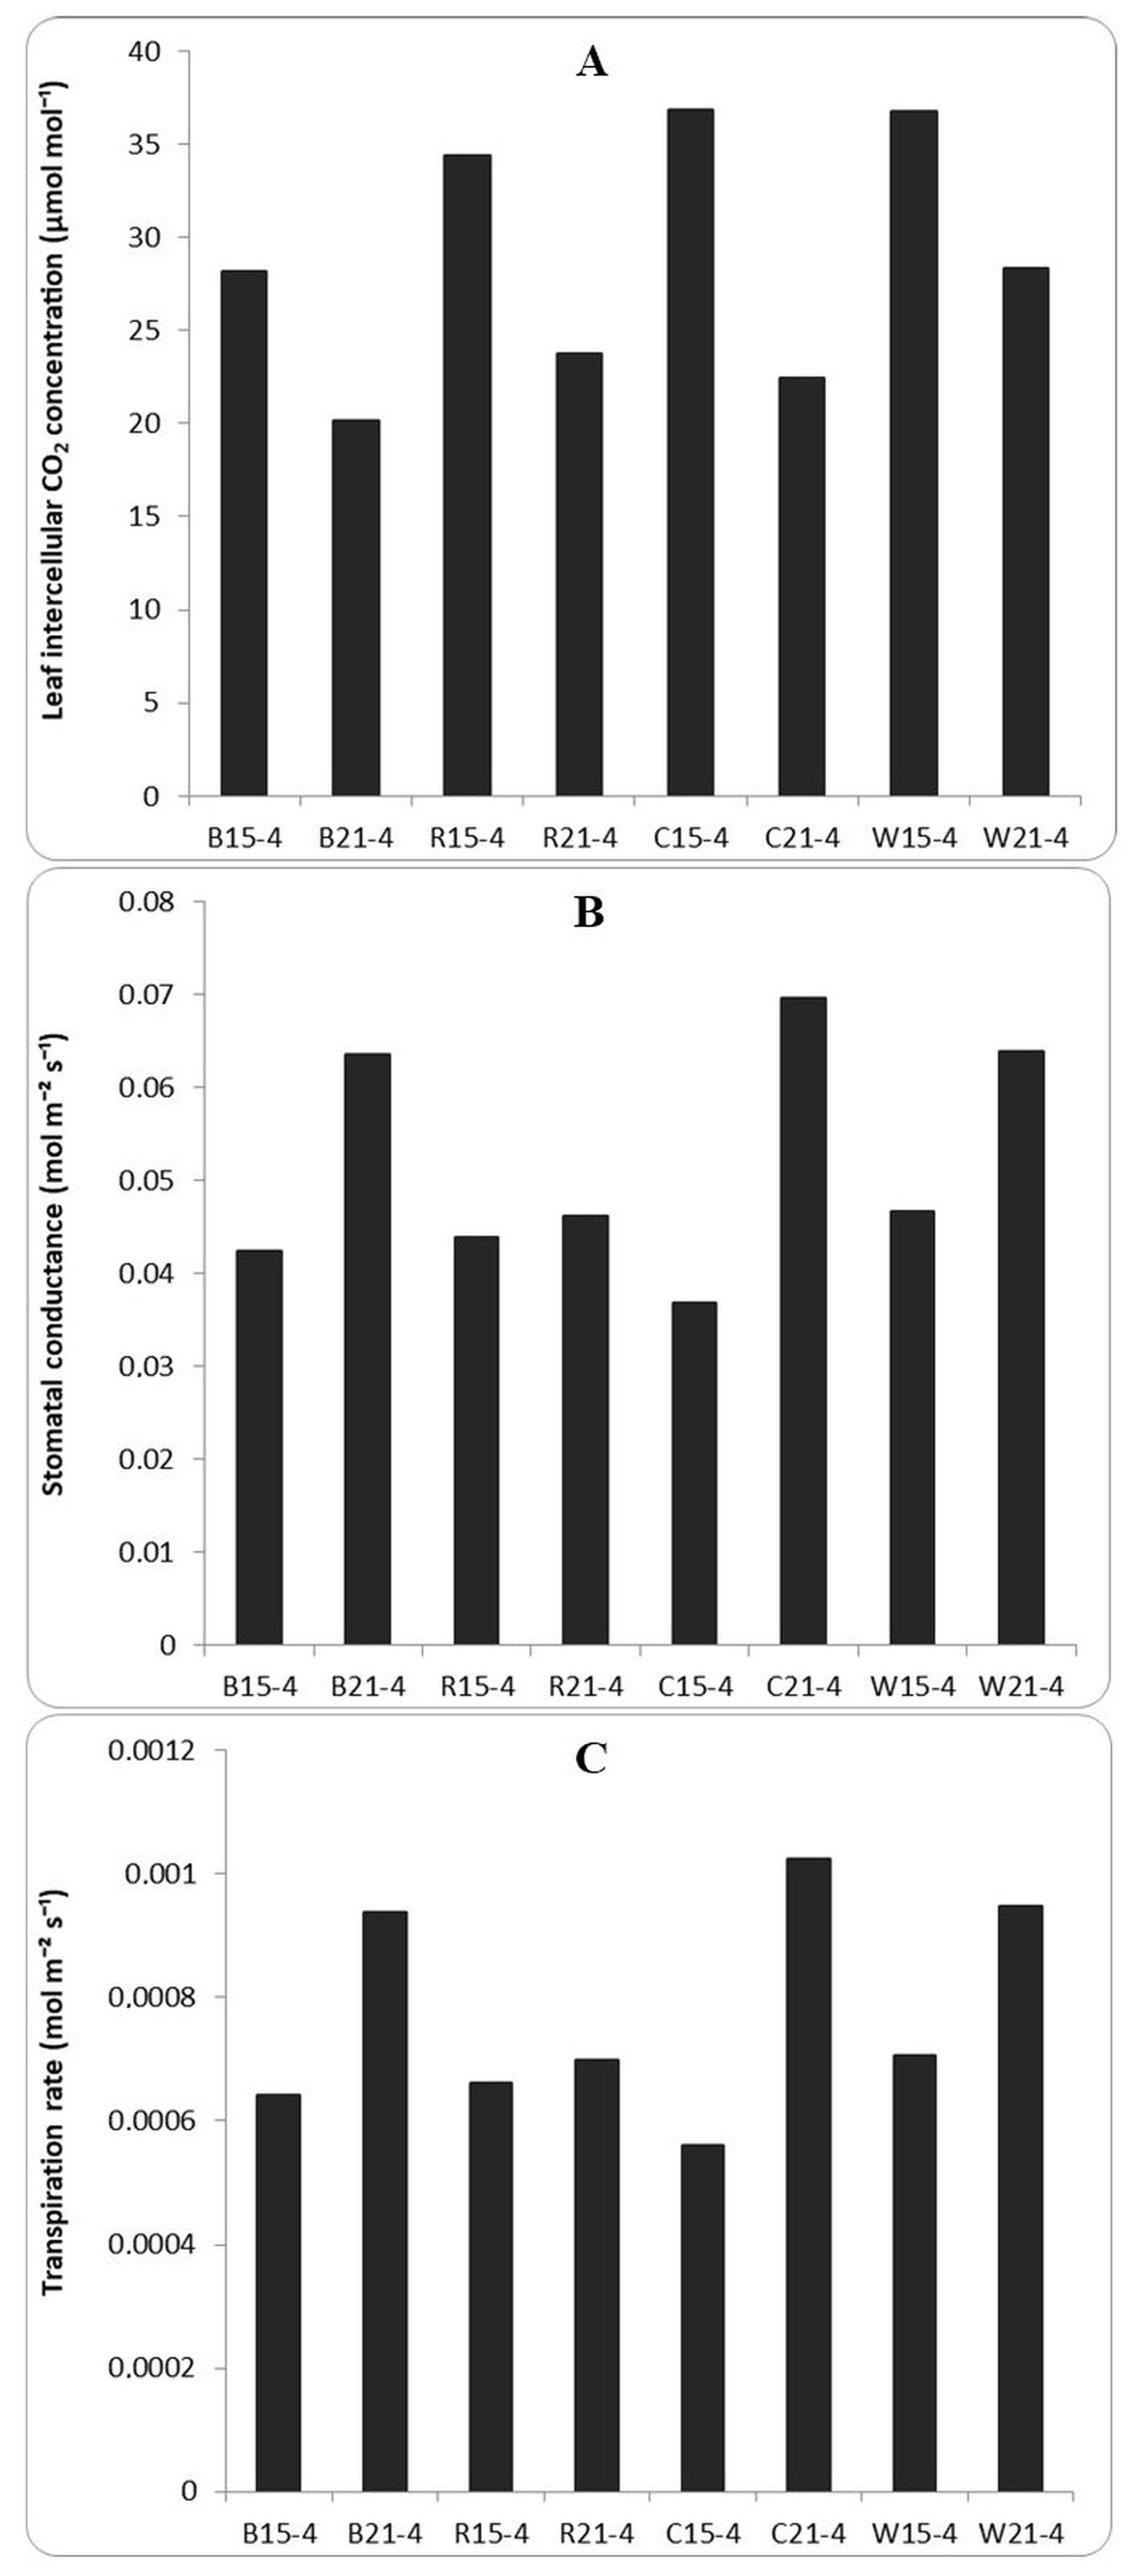
Plant photosynthesis is influenced by CO2 availability, stomatal opening, CO2 assimilation, and leaf transpiration rate. The value of stomatal opening, CO2 assimilation, and leaf transpiration rate was the highest in the 15 h light treatment, especially with the blue/red combination and white LEDs (Figure 3). The intercellular CO2 concentration decreased with the increasing irradiation time. The LED exposure for 21 h resulted in less intercellular CO2 than that with 15 h. Among all LED types, the blue LEDs resulted in the lowest intercellular CO2. The greater the value of CO2 conductance, the lower the stomatal resistance. Stomatal conductance corresponds to the rate of transpiration. Figure 3 shows that the irradiation duration of 21 h resulted in a higher value of stomatal conductance and transpiration rate than the irradiation duration of 15 h. The red LEDs showed the lowest stomatal conductance and transpiration rate among all LED types.
Figure 3
Various aspects of photosynthesis in strawberry leaves measured using the LI-6800 Portable Photosynthesis System under different types of medium-intensity light. (A) intercellular CO2; (B) stomatal conductance; (C) transpiration rate.
Notes: B15-4 = blue 15 hours of medium intensity, B21-4 = blue 21 hours of medium intensity, R15-4 = red 15 hours of medium intensity, R21-4 = red 21 hours of medium intensity, C15-4 = combination blue/red (1:1) 15 hours of medium intensity, C21-4 = blue/red combination (1:1) 21 hours of medium intensity, W15-4 = white 15 hours of medium intensity, W21-4 = white 21 hours of medium intensity.
. Chlorophyll, glucose, and fructose contents
Involving the process of photosynthesis, chlorophyll is a physiological indicator of plant growth. Additionally, leaf sugar (glucose and fructose) content results from the photosynthetic process. The exposure to blue LED light and the 15 hour treatment led to the greatest concentration of chlorophyll a, particularly in the medium-intensity blue light treatment (B15-4) and high-intensity blue:red light (2:1) treatment (2C15-5) (Table 1). Red light at low intensity resulted in higher chlorophyll accumulation than medium or high intensity. The same result was obtained for low-intensity white light.
Table 1
Contents of chlorophyll a, chlorophyll b, glucose, and fructose in strawberry leaves treated with different types of LEDs at different intensities and for different durations.
[i] Numbers followed by the same letter in the same column show the number that is not significantly different based on DMRT at the level of = 5%.
[ii] Notes: B15-3 = blue 15 hours of low intensity, B15-4 = blue 15 hours of medium intensity, B15-5 = blue 15 hours of high intensity, R15-3 = red 15 hours of low intensity, R15-4 = red 15 hours of intensity medium, R15-5 = red 15 hours high intensity, C15-3 = blue/red combination (1:1) 15 hours low intensity, C15-4 = blue/red combination (1:1) 15 hours medium intensity, C15-5 = blue/red combination (1:1) 15 hours high intensity, 1C15-3 = blue/red combination (1:2) 15 hours low intensity, 1C15-5 = blue/red combination (1:2) 15 hours intensity high, 2C15-3 = blue/red combination (2:1) 15 hours low intensity, 2C15-5 = blue/red combination (2:1) 15 hours high intensity, W15-3 = white 15 hours low, W15-4 = white 15 hours medium intensity, W15-5 = white 15 hours high intensity, B21-4 = blue 21 hours of medium intensity, R21-4 = red 21 hours of medium intensity, C21-4 = blue/red 21 hours of medium intensity, W21-4 = white 21 hours of medium intensity.
The light spectra under 21 h of irradiation did not affect the accumulation of chlorophyll a. However, under 15 h of irradiation, the medium-intensity (B15-4) and high-intensity (B15-5) blue light treatments resulted in the most significant accumulation of chlorophyll b. Similar results were obtained with the red spectrum. Under polychromatic light (blue/red combination and white), the most significant accumulation of chlorophyll b occurred in the high-intensity treatments. In the 21 h irradiation treatment, the most significant accumulation of chlorophyll b occurred under white light. Medium-intensity blue light for 15 h (B15-4) and medium-intensity white light for 21 h (W21-4) resulted in the highest amount of chlorophyll a (Table 1). The treatment with less blue light resulted in lower chlorophyll accumulation.
The 15 h irradiation treatment caused the most significant accumulation of glucose in the medium-intensity blue:red (1:1) combination. In the 21 h treatment, the most significant glucose accumulation occurred under polychromatic spectra, namely the blue/red combination and white light. The highest fructose accumulation under 15 h of irradiation occurred under medium-intensity blue and red light (B15-4 and R15-3), the medium-intensity blue/red combination (C15-4), and high-intensity white light (W15-5). Although fructose accumulation under 21 h of irradiation was in line with glucose accumulation, polychromatic light (blue/red combination and white) resulted in the most significant accumulation. Sugar is one of the primary compounds produced during photosynthesis. Sugars that play important roles in strawberry plants include glucose, fructose, and sucrose. The medium-intensity white light irradiation for 21 h (W21-4) resulted in the highest accumulation of glucose and fructose, compared with the other treatments.
. Secondary metabolite profile
The secondary metabolite profile in the strawberry leaves was determined by GC–MS analysis (Figure 4). In all treatments, some compounds, such as tyrosol, phytol, and linoleic acid, were found in the strawberry leaves. Tyrosol, a phenol compound, showed the highest concentration (abundance of GC-MS peak of 7.76%) in the medium-intensity blue:red combination (1:1) treatment for 21 h (C21-4). Phytol, a diterpenoid, showed the highest level (29.4%) in the 15 h red light treatment at medium intensity (C15-4). Linolenic acid, a saturated fatty acid, showed the highest content (22.1%) in the 15 h low-intensity blue light treatment (B15-3). The compounds present in almost all treatments included neophytadiene, palmitic acid, clionasterol, and vitamin E.
Figure 4
Heatmap showing the secondary metabolite profile of strawberry leaves in various LED treatments. Data were generated by GC–MS.
Note: B15-3 = blue 15 hours of low intensity, B15-4 = blue 15 hours of medium intensity, B15-5 = blue 15 hours of high intensity, R15-3 = red 15 hours of low intensity, R15-4 = red 15 hours of intensity medium, R15-5 = red 15 hours high intensity, C15-3 = blue/red combination (1:1) 15 hours low intensity, C15-4 = blue/red combination (1:1) 15 hours medium intensity, C15-5 = blue/red combination (1:1) 15 hours high intensity, 1C15-3 = blue/red combination (1:2) 15 hours low intensity, 1C15-5 = blue/red combination (1:2) 15 hours intensity high, 2C15-3 = blue/red combination (2:1) 15 hours low intensity, 2C15-5 = blue/red combination (2:1) 15 hours high intensity, W15-3 = white 15 hours low, W15-4 = white 15 hours medium intensity, W15-5 = white 15 hours high intensity, B21-4 = blue 21 hours of medium intensity, R21-4 = red 21 hours of medium intensity, C21-4 = blue/red 21 hours of medium intensity, W21-4 = white 21 hours of medium intensity.
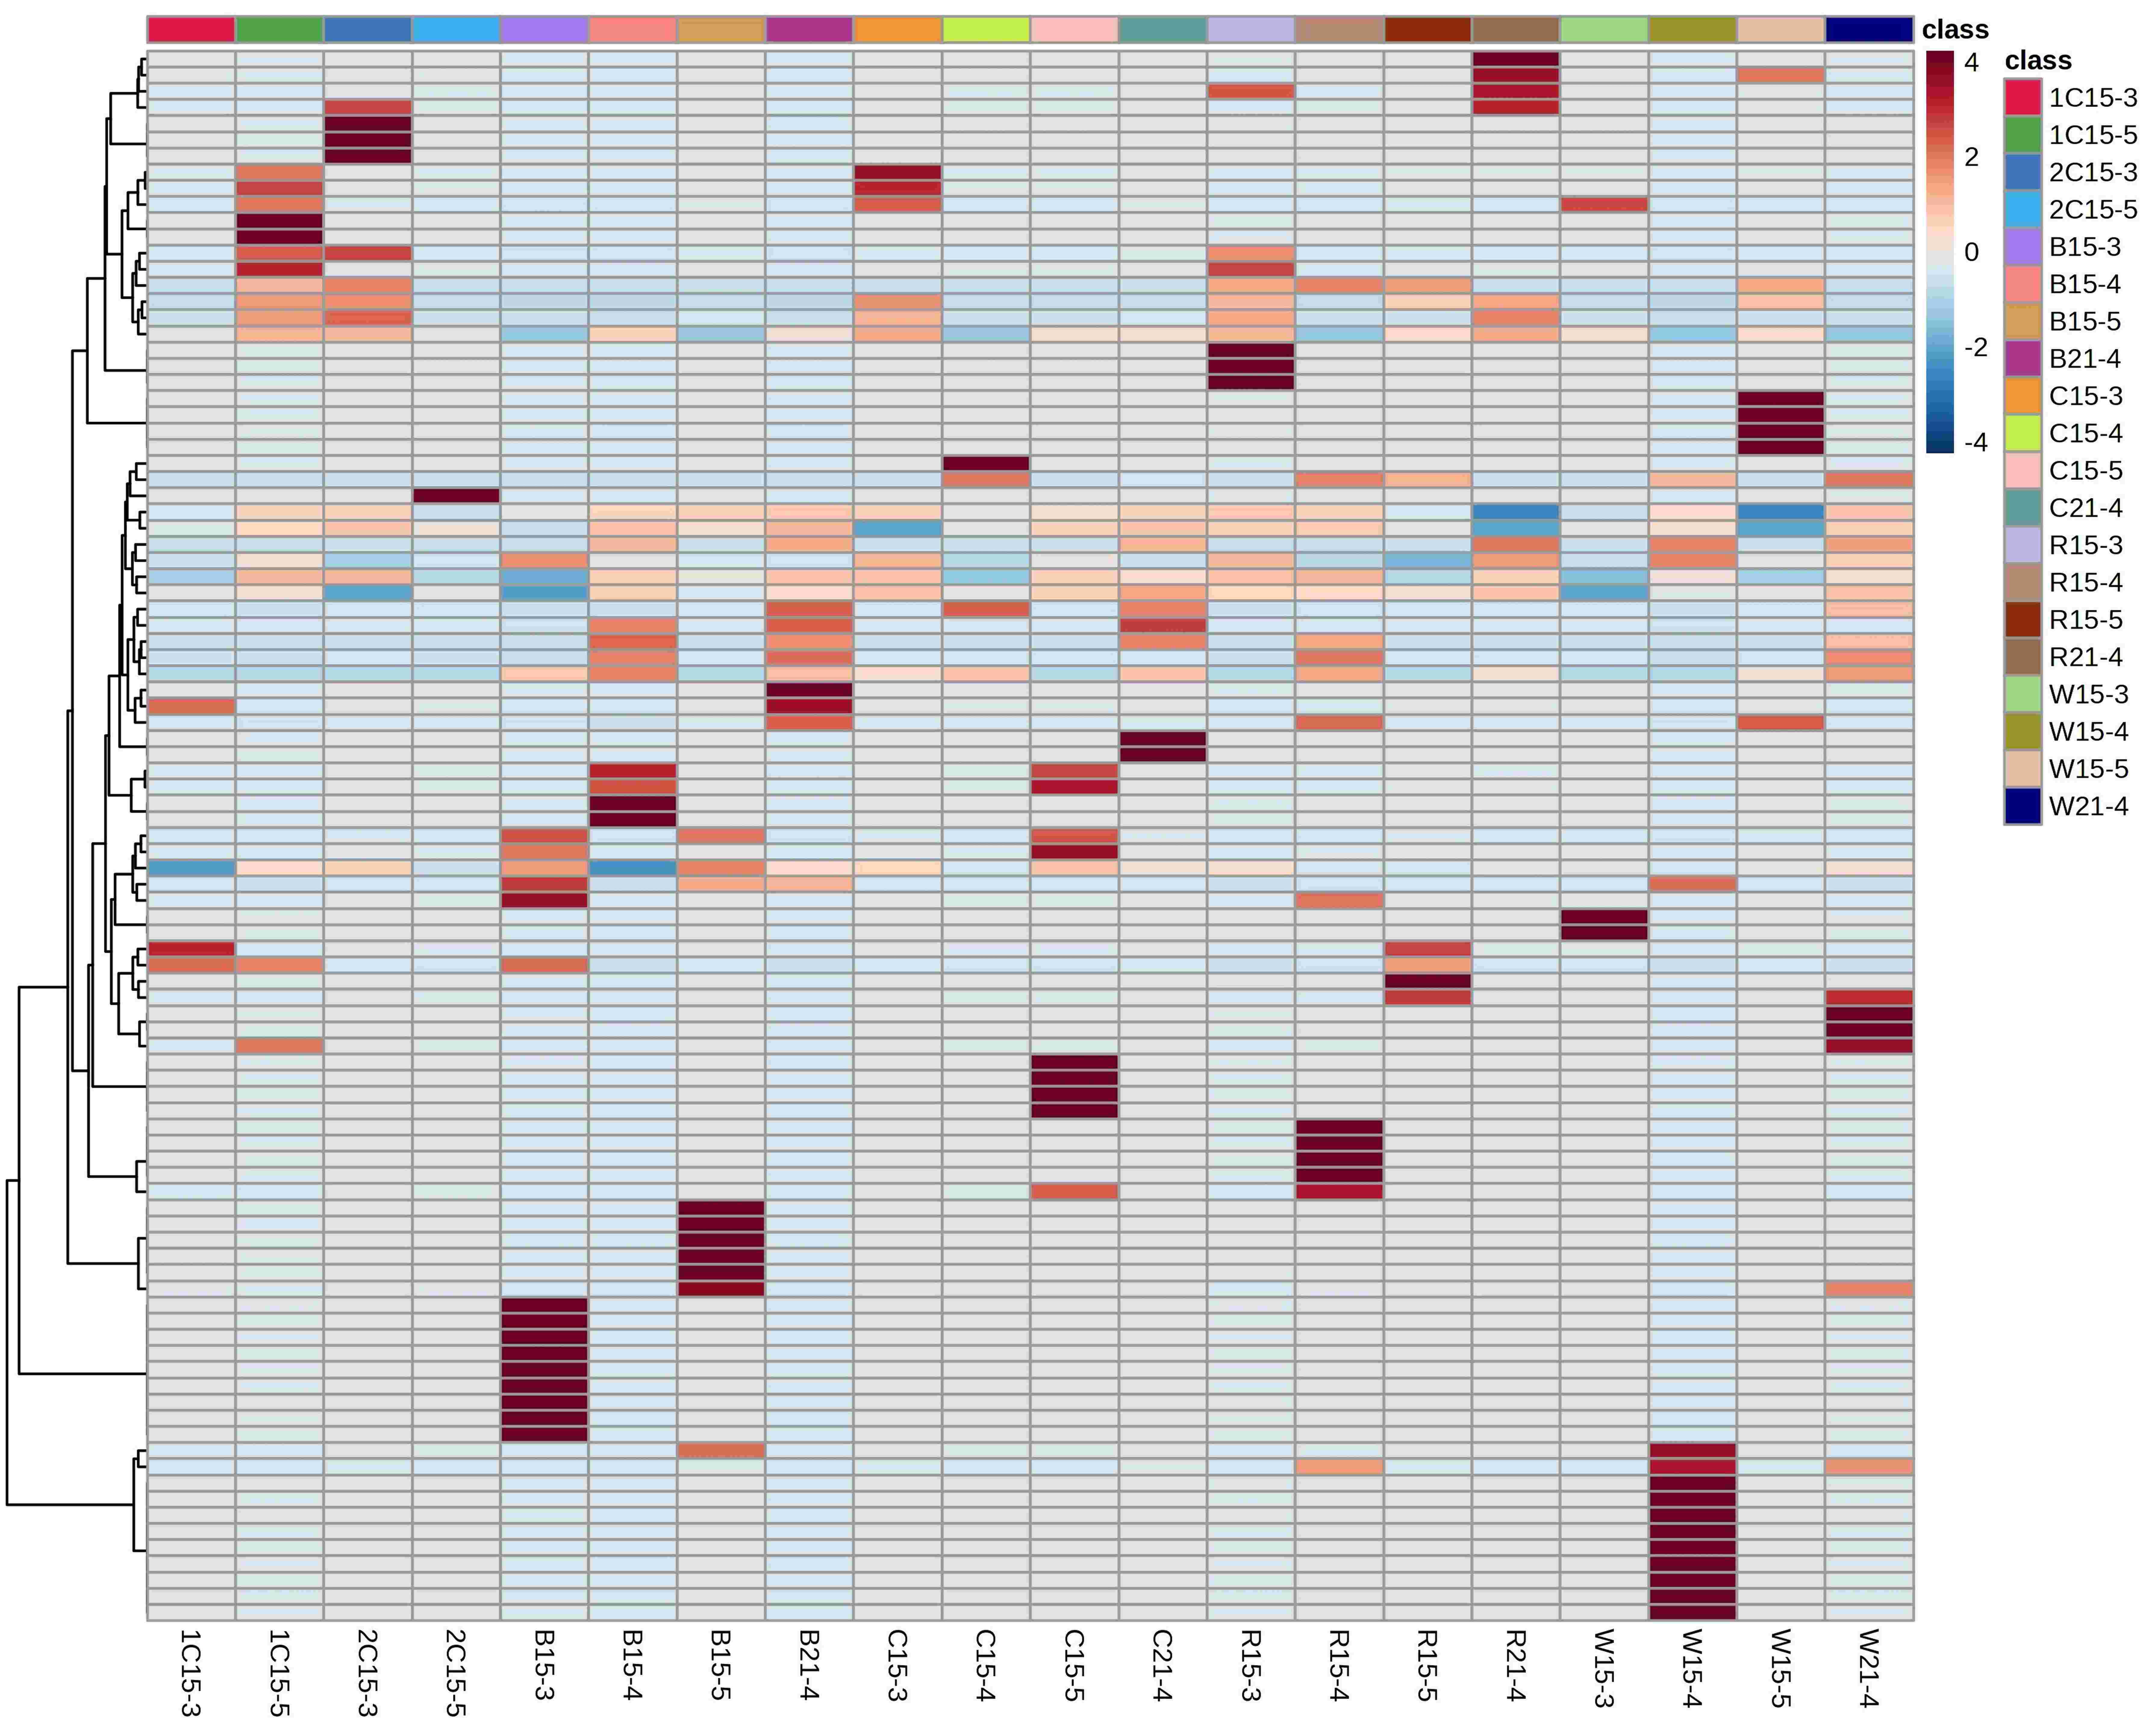
Some compounds showed the greatest abundance in specific treatments. For example, diazepam (a benzodiazepine compound) showed the highest abundance (49.5%) in the C15-4 treatment. The use of diazepam in humans and animals can decrease anxiolytic and anxiety-like behavior. Diazepam was used in plant Salix aegyptiaca and Lemna minor to test its optimum dosage (Komaki et al., 2015; Lamaczová et al., 2022; Unseld & Klotz, 1989). The other compounds detected were tanshinone II-b (a terpenoid compound; 64.9% abundance in the 2C15-5 treatment), phthalic acid and 2-ethylhexyl undecyl ester (50.31% and 63.1% abundance in the R15-5 and 1C15-3 treatments, respectively), and 2-(3-chlorophenyl)-2H-tetrazole-5-carboxylic acid ethyl ester (62.9% abundance in the W15-3 treatment).
. Gene expression
The treatment with different light spectra and intensities resulted in changes in gene expression in strawberry plants (Figure 5). Genes involved in the plant response to light and flowering were investigated. Anthocyanidin synthase (ANS), which regulates pigmentation in plants, showed the highest expression under the low-intensity blue:red light (1:1) combination (C15-3) and under low-intensity white light (W15-3), compared with the other treatments. This indicates that low-intensity polychromatic light can increase ANS gene expression. Additionally, chalcone synthase (CHS) showed the highest expression in the high-intensity blue:red light (2:1) treatment (2C15-5).
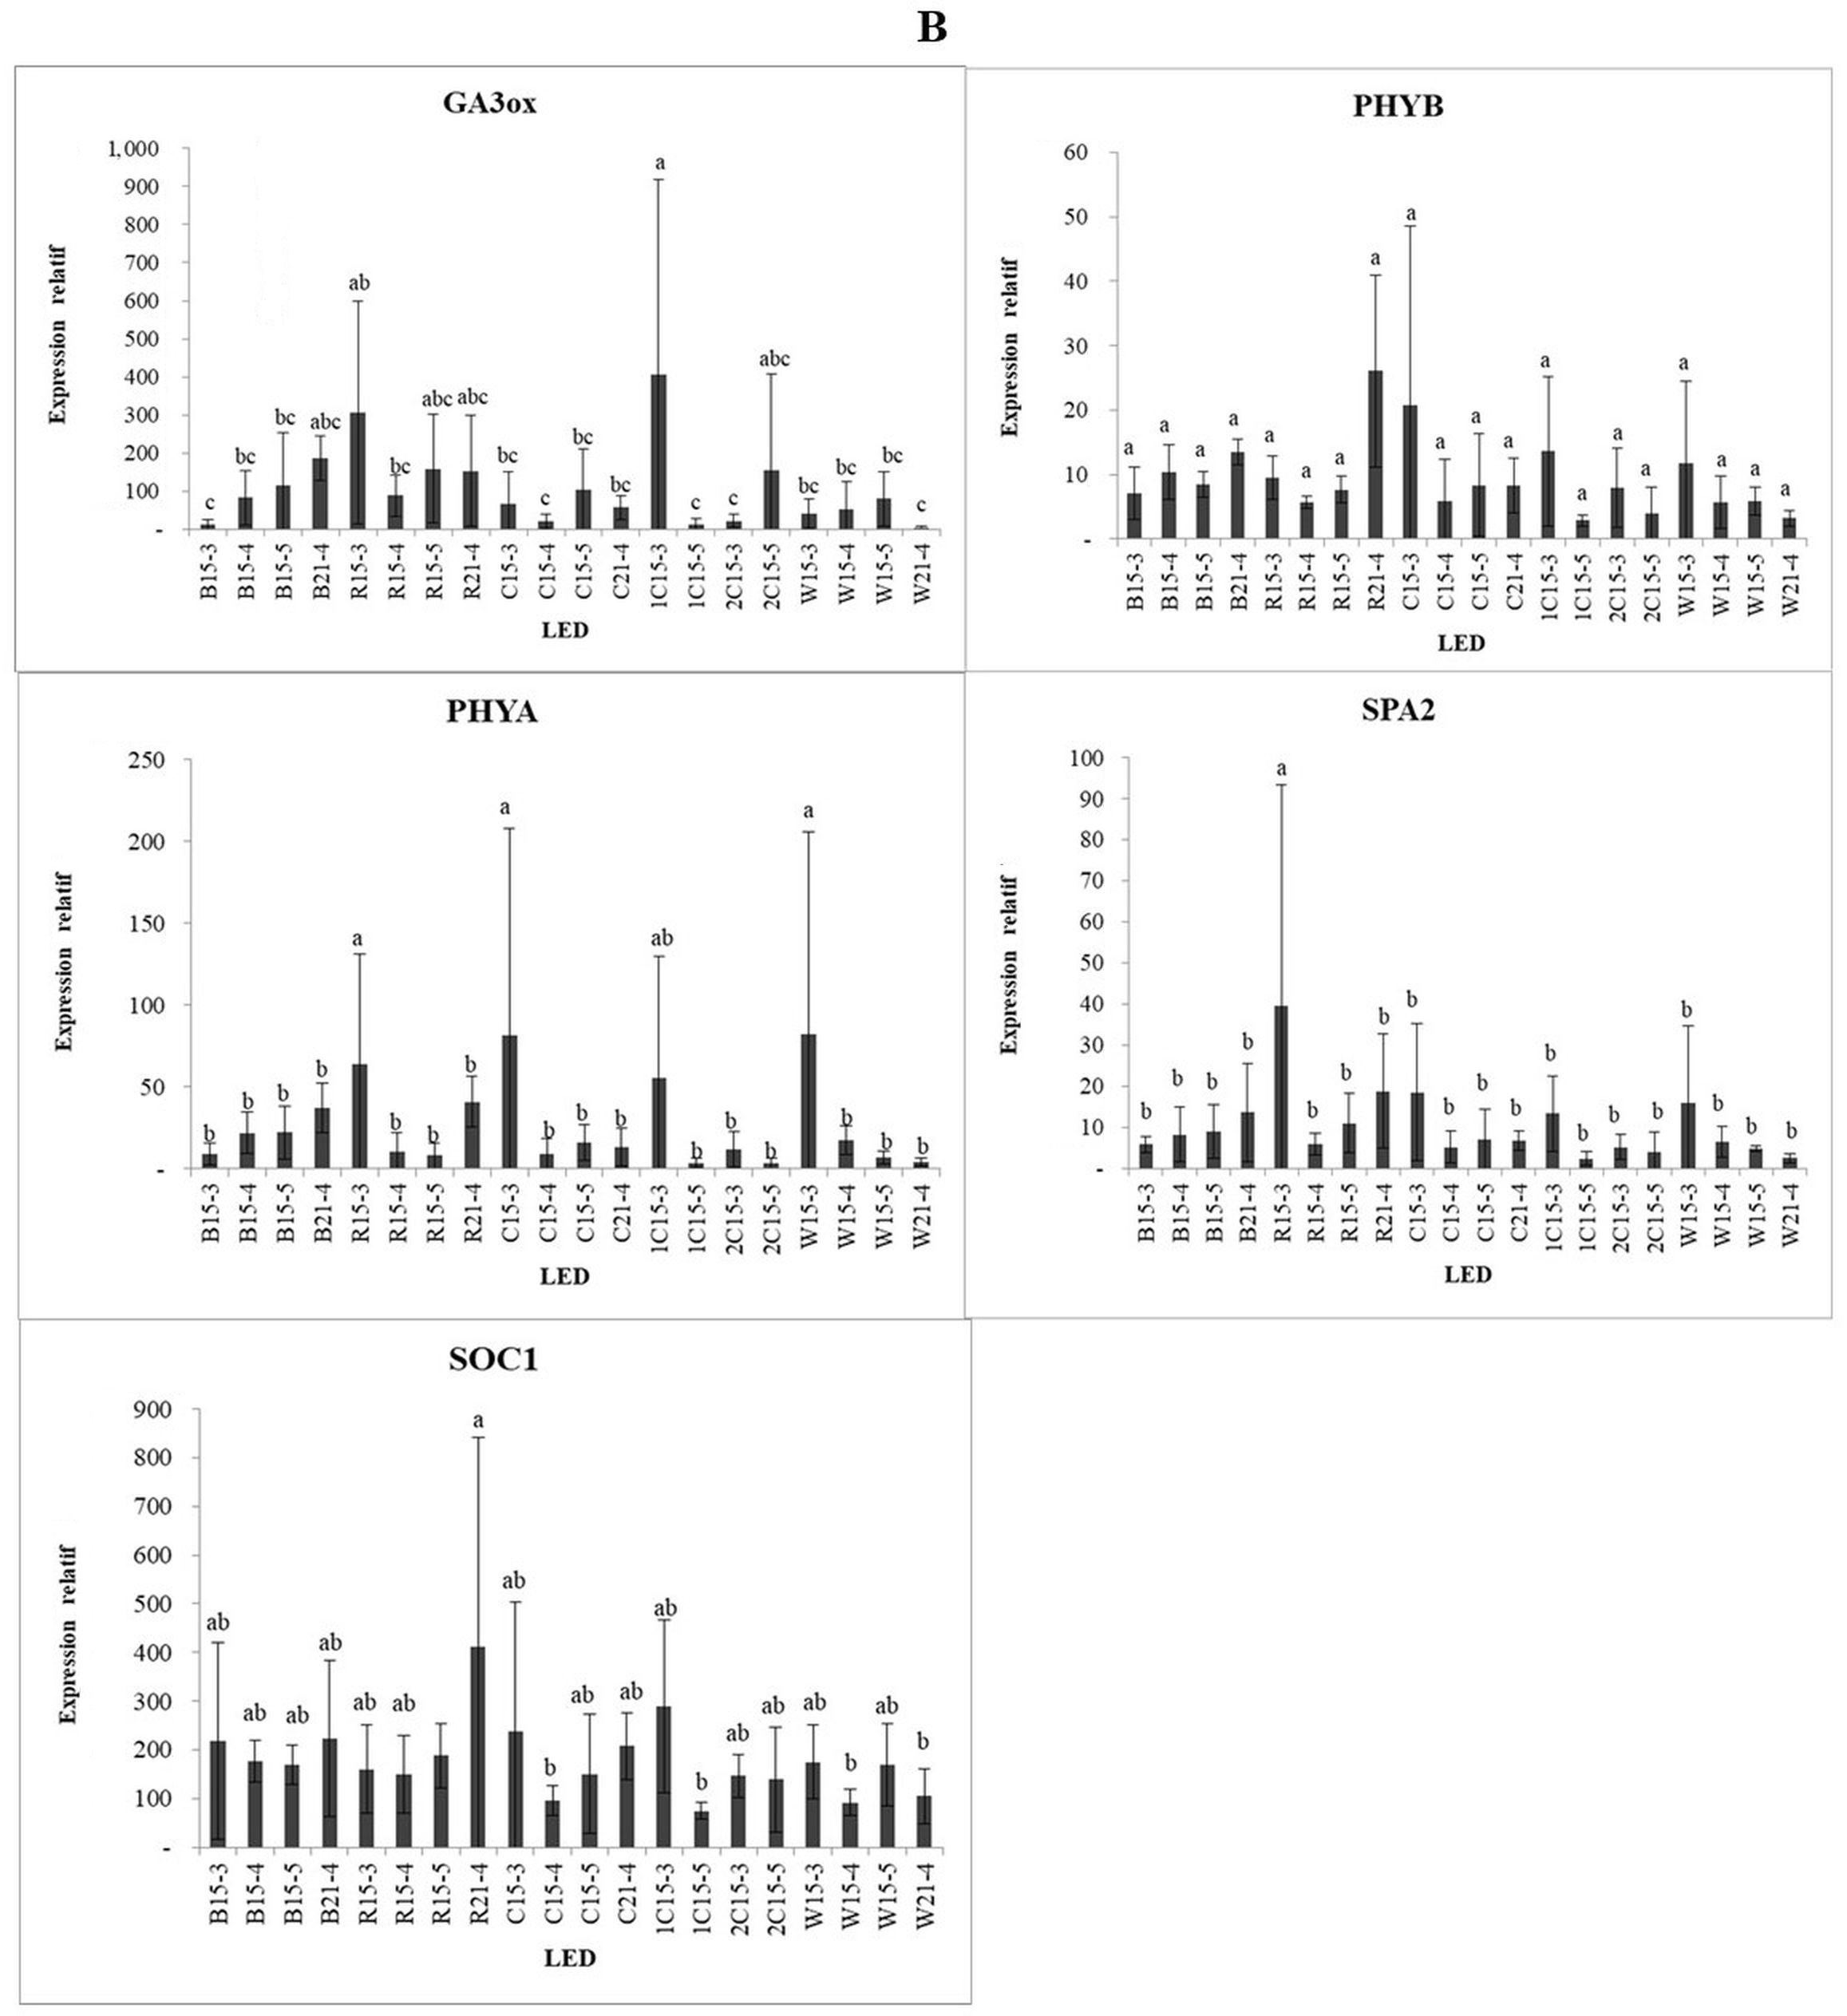
Figure 5
Expression profiles of genes in strawberry leaves treated with LEDs at different light intensities and durations (A–B).
Note: B15-3 = blue 15 hours of low intensity, B15-4 = blue 15 hours of medium intensity, B15-5 = blue 15 hours of high intensity, R15-3 = red 15 hours of low intensity, R15-4 = red 15 hours of intensity medium, R15-5 = red 15 hours high intensity, C15-3 = blue/red combination (1:1) 15 hours low intensity, C15-4 = blue/red combination (1:1) 15 hours medium intensity, C15-5 = blue/red combination (1:1) 15 hours high intensity, 1C15-3 = blue/red combination (1:2) 15 hours low intensity, 1C15-5 = blue/red combination (1:2) 15 hours intensity high, 2C15-3 = blue/red combination (2:1) 15 hours low intensity, 2C15-5 = blue/red combination (2:1) 15 hours high intensity, W15-3 = white 15 hours low, W15-4 = white 15 hours medium intensity, W15-5 = white 15 hours high intensity, B21-4 = blue 21 hours of medium intensity, R21-4 = red 21 hours of medium intensity, C21-4 = blue/red 21 hours of medium intensity, W21-4 = white 21 hours of medium intensity.
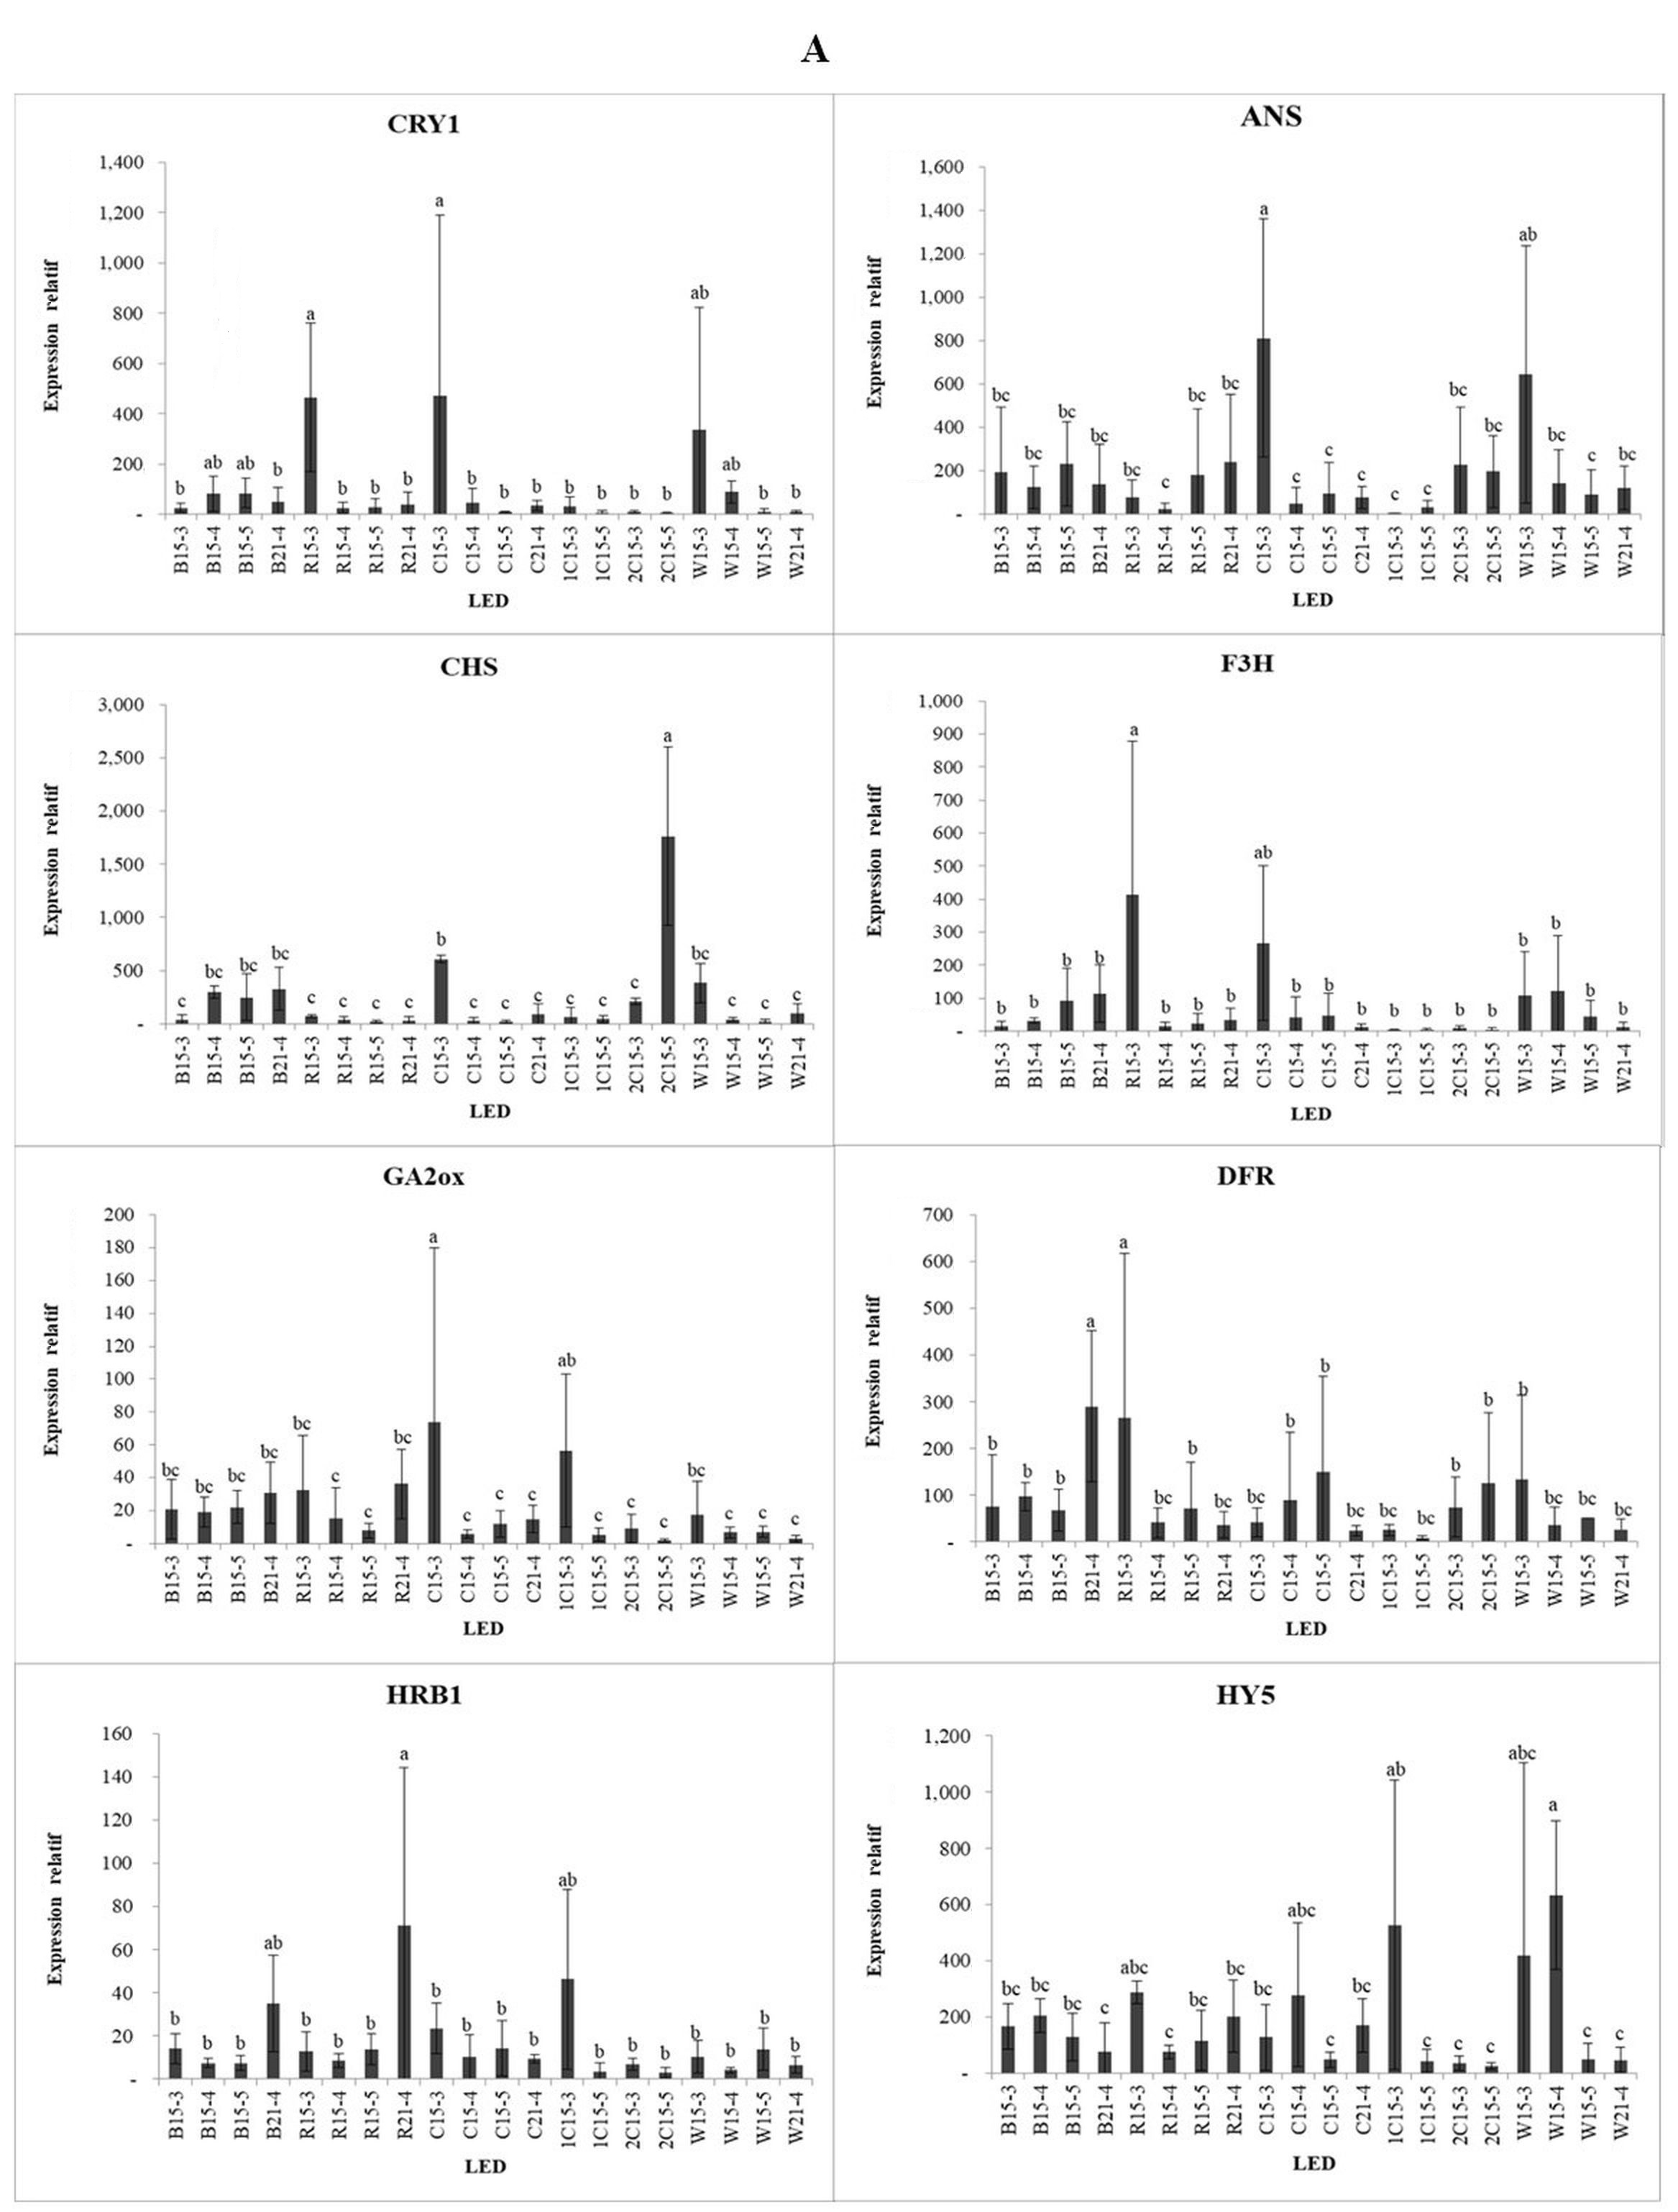
Under blue light, CHS was expressed at higher levels when irradiated with high light intensity during the B15-4, B15-5, and B21-4 treatments. Under red light, CHS showed the highest expression under the exposure to low light intensity for 15 h (R15-3). CHS is involved in the biosynthesis of plant metabolites, including catechins. Dihydroflavonol-4-reductase (DFR) and flavanone-3 hydroxylase (F3H) are important enzymes in the flavonoid biosynthetic pathway. The exposure to medium-intensity blue light for 21 h (B21-4) resulted in the greatest reduction in DFT gene expression, compared with the other blue light treatments. Under red light, the DFR and F3H genes were expressed at higher levels in the low-intensity treatment with 15 h of irradiation (R15-3). Gibberellin 2-oxidase (GA2ox) and GA3ox are involved in flowering induction. While GA3ox was highly expressed under low-intensity red light (R15-3) and the low-intensity blue:red (1:2) combination (1C15-3), we see that GA3ox is very sensitive to red light at low intensity, while the GA2ox gene showed the highest expression in the low-intensity blue:red (1:1) light combination treatment.
. Discussion
The rate of photosynthesis increased with the increasing PPFD value. Thus, the rate of photosynthesis with red LEDs was lower than that with blue LEDs. At PPFD < 300 µmol m−2 s−1, the intercellular CO2 concentration under red LEDs was higher than that under blue LEDs. This indicates that red LEDs enhance the photochemical reaction and activate CO2 in the leaf (Mochizuki et al., 2019). It also indicates that light affects stomatal opening to the blue LED and can increase CO2 assimilation. In a previous study, the net photosynthetic rate of young tea plants grown under blue and white LEDs (100 µmol m2 s−1 PPFD) for 15 days was significantly higher than that of plants grown under red LEDs (Suzuki et al., 2012).
Chlorophyll b showed the lowest accumulation under 15 h of low-intensity white light (W15-3) and the highest accumulation under 21 h of medium-intensity white light (W21-4) and 15 h of medium-intensity blue light (B15-4). The treatment with dominant blue light increased the amount of chlorophyll as the light intensity increased. Blue light plays an important role in the development of chloroplasts and the formation of chlorophyll in thylakoids at the early stages of plant development. In contrast to the strawberry cultivar ‘Frigo’, which has a photoperiod of 16 h, red LEDs led to higher chlorophyll accumulation than other LEDs (Samuolienė et al., 2010). Although blue light has more energy than red light, its efficiency is lower because of the conversion of chlorophyll, and green light can penetrate deeper and excite chlorophyll deeper in leaves (Liu & van Iersel, 2021). Red and blue light have a higher quantum yield. Therefore, blue LEDs are the least effective in chlorophyll accumulation. These differences in the results may be caused by other factors, such as the strawberry cultivar (Fragaria × ananassa Duch. cv. Daewang) and the value of PPFD used (Choi et al., 2015). As the content of chlorophyll a is always higher than that of chlorophyll b, as illustrated in the current study where the level of chlorophyll a was higher than that of chlorophyll b in all treatments, chlorophyll b is the result of chlorophyll biosynthesis, which reorganizes photosystems during the process of adaptation to light intensity and quality (Li RongHua et al., 2006).
The accumulation of glucose and fructose was relatively the same between the blue and red light treatments. In line with the ‘Frigo’ strawberry cultivar, a high accumulation of glucose and fructose occurred in the blue/red combination light treatment (Samuolienė et al., 2010). In the ‘Daewang’ strawberry variety, plants treated with red, blue, and red-blue-white combination LEDs showed similar sugar contents (Choi et al., 2015). In strawberry leaf samples, the most abundant sugar was glucose, followed by fructose (Akšić et al., 2019).
The GC–MS analysis detected secondary metabolites among several common compounds obtained from all treatments, including tyrosol, neophytadiene, linolenic acid, palmitic acid, phytol, vitamin E, and clionasterol. Tyrosol, a phenolic compound with potential antioxidant activity, is generally found in fungal metabolites. These compounds have been used as antiarrhythmic drugs, antioxidants, cardiovascular drugs, and protective agents for plants (Gupta et al., 2020). Phytol is a diterpenoid alcohol compound derived from chlorophyll and is used as a precursor for manufacturing synthetic forms of vitamin E and vitamin K in leaves (Mene-Saffrane & Pellaud, 2017). Linolenic acid and palmitic acid are saturated fatty acids that act as antibacterial compounds in plants. Saturated fatty acids also benefit human bone health (Macdonald et al., 2004). Cliosterol can be used as a drug for diabetes mellitus because this compound reduces hyperglycemia in diabetic rats by increasing insulin secretion and inhibition (Balamurugan et al., 2011). Neophytadiene is a terpenoid compound produced by plants to prevent the growth of bacteria and fungi (Ragasa et al., 2009).
Some specific compounds with great abundance included the following: diazepam, C15-4 treatment; phenanthro[1,2-b]furan-10,11-dione,6,7,8,9-tetrahydro-6-(hydroxymethyl)-1,6-dimethyl-, 2C15-5 treatment; phthtalic acid and 2-ethylhexyl undecyl ester, R15-5 and 1C15-3 treatments; 2-(3-chlorophenyl)-2H-tetrazole-5-carboxylic acid ethyl ester, W15-3 treatment. Some of the specific compounds detected do not yet have a classification, except diazepam, which belongs to the benzodiazepine group and is widely used as a sedative. The data on increasing diazepam was obtained from a generic GC-MS database in the research center. There was a possibility that the detected diazepam was not the specific diazepam found in animals and humans. Further analysis is needed to determine the role of diazepam according to the plant database by comparing retention time and m-z. Diazepam has been mentioned to decrease stress levels in humans and animals; therefore, diazepam in plants might be combined with the blue/red light treatment for 15 hours.
Phytochrome A (PHYA) is a red/far-red light photoreceptor involved in photomorphogenesis, whereas phytochrome B (PHYB) is a red/far-red photoreceptor involved in the regulation of de-etiolation. PHYA was expressed in the low-intensity light treatments, such as red light (R15-3), blue:red light (1:1) combination (C15-3), and white light (W15-3). By contrast, the expression of PHYB showed no significant difference among the various treatments. CRYPTOCHROME CIRCADIAN REGULATOR1 (CRY1) encodes a cryptochrome protein sensitive to blue light. CRY1 was highly expressed under low-intensity red light (R15-3) and under the low-intensity blue:red light (1:1) combination (W15-3). Under white and blue light, CRY1 was highly expressed in the medium- and high-intensity treatments, i.e., W15-3, W15-4, B15-4, and B15-5. HYPERSENSITIVE TO RED AND BLUE (HRB1) is hypersensitive to blue and red light. This gene showed the highest expression under both red and blue light at medium intensity with an irradiation time of 21 h (R21-4 and B21-4, respectively) and was highly expressed under blue:red light (2:1) at low intensity (1C15-3). HYPOCOTYL 5 (HY5) is responsible for the accumulation of anthocyanins under far-red and blue light. HY5 was highly expressed in the polychromatic light treatments, namely, medium and low-intensity white light (W15-4 and W15-3) and low-intensity blue:red (1:2) light (1C15-3). SUPPRESSOR OF OVEREXPRESSION OF CONSTANS 1 (SOC1) and CO genes connected with proline and ethylene biosynthesis are involved in the flowering stage (Samach et al., 2000).
SOC1 was highly expressed in the treatments with 21 h of irradiation, such as R21-4, B21-4, and C21-4, although its expression was higher in the R21-4 treatment than in the other treatments. SUPPRESSOR OF PHYA-105 (SPA2), which regulates seedling development in the dark, was highly expressed in the low-intensity red light treatment (R21-3). Compared with blue light, red light contributes more to the accumulation of proanthocyanidins (PA) by upregulating the expression of LAR and ANR. Previously, the expression of F3H was suppressed in blue and red light treatments. However, DFR and ANS showed high transcript levels in blue light treatments, resulting in high anthocyanin content in strawberries (Zhang et al., 2018).
HY5 is involved in the accumulation of anthocyanins under far-red and blue light. The HY5 photoreceptor is a direct target of COP1, and this gene is associated with transcriptional activators in the flavonoid pathway in response to light (Shin et al., 2013; Stracke et al., 2010). The expression pattern of HY5, a positive regulator of the light signaling pathway, was similar to that of SPA2 and SPA3. PHYA encodes a photoreceptor apoprotein in Fragaria, like phyC, cry2, ZEITLUPE (ZTL), and FLAVIN BINDING KELCH REPEAT F-BOX 1 (FKF1) (Thomas, 2006).
Photoreceptors belonging to four different classes, including PHY, CRY, phototropin (PHOT), and UV resistance locus 8 (UVR8), are known to respond to light quality. The expression levels of genes encoding these photoreceptors are regulated in strawberry plants grown under blue light, compared with those grown under other light spectra (Zhang et al., 2018). The expression of photoreceptor genes decreases gradually during strawberry fruit development (from small green to red stage); therefore, a decrease in photoreceptor gene transcript levels is considered a sign of intact fruit color (Kadomura-Ishikawa et al., 2013). Consistently, anthocyanin biosynthesis is usually associated with blue light via CRYs (Kang et al., 2008). Regulation of anthocyanin biosynthesis via CRY requires PHY activity (Más et al., 2000). CRY also requires interaction with UVR8 to regulate target gene expression in natural environmental conditions (Jenkins, 2014). Thus, other types of light, besides blue light, can also significantly affect anthocyanin biosynthesis in plants.
Exogenously applied gibberellins (GA) inhibit flowering in wild strawberries (Guttridge & Thompson, 1964). Endogenously, the GA hormone was observed in short-day (SD) strawberries, but no apparent differences were found in the expression of GA biosynthesis and GA catabolism genes under SD. Conversely, in everbearing (EB) strawberries, GA2ox and GA3ox were strongly suppressed at the apex after flower initiation. The GA biosynthesis pathway is regulated from early flower development until flower transition. Thus, while wild strawberries do not harbor the GA2ox gene and show the runnerless property, this does not support the role of endogenous GA as a flowering induction regulator (Mouhu et al., 2009). SOC1 functions under a long-day (LD) photoperiod, causing the CO peak to coincide with light irradiation, which results in the accumulation of the CO protein in the leaf phloem, which activates the expression of FLOWERING LOCUS T (FT) (Yanovsky & Kay, 2002).
In conclusion, with the highest accumulation of glucose and fructose occurring in the 21 h treatments with medium-intensity blue/red combination light (C21-4) and white light (W21-4), the blue light treatment resulted in the highest content of chlorophyll a, specifically at medium-intensity for 15 h (B15-4). In comparison, the blue:red (1:2) treatments for 15 h at low and high intensity (1C15-3 and 1C15-5) resulted in the lowest accumulation of chlorophyll a. Common compounds found in strawberry leaves included tyrosol (phenol group), phytol (diterpenoid group; involved in vitamin E synthesis), and linoleic acid (saturated fatty acid group). The specific compounds found in this study were generally derived from unidentified compounds. Among the medium-intensity light treatments, the 15 h polychromatic (combined and white) light treatments had the highest intercellular CO2 concentration, while red light had the lowest stomatal conductance and transpiration rate. The expression of genes involved in the antioxidant and plant flavonoid pathways (ANS, CHS, DFR, F3H, and HY5) was analyzed in this study. The blue/red combination light led to the highest expression of ANS and CHS. The DFR and F3H genes showed the highest expression in the blue and low-intensity red light treatments, respectively. GA3ox was very sensitive to low-intensity red light, while GA2oxwas sensitive to low-intensity blue/red combination light. PHYA, PHYB, CRY1, and HRB1 were sensitive to low-intensity blue and red light. SOC1, which controls flowering, was highly expressed in treatments with 21 h of irradiation, such as R21-4, B21-4, and C21-4. SPA2, which regulates seedling development in the dark, was highly expressed under low-intensity red light.
