. Introduction
The Elaeis guineensis Jacq., more widely known as the oil palm, is a single, unbranched tree that demands multiple years of dedication and hard work before it yields fresh fruit bunches with high oil content (Uning et al., 2020). Around one-third of global vegetable oil originates from this tree, surpassing the oil yield from soybean and rapeseed (Morcillo et al., 2013). Oil palm fruit offers two primary types of vegetable oil: crude palm oil from the fruit’s mesocarp and palm kernel oil from its seeds. In optimal conditions, industrial oil palms generally yield between 12 and 18 tons of fruit annually per hectare. Notably, oil palms are unique permanent plants, deviating from the norm of annual, biennial, and perennial crops. Harvesting occurs bi-monthly throughout the plant’s life, barring the early growth phase (Ismail & Mamat, 2002; Legros et al., 2009). Yields are relatively stable, albeit seasonal factors (Jelsma et al., 2019) and such issues as inadequate fertilization, pest infestation, and disease can affect them. Effective field management, disease control, and optimal harvesting patterns bolster yield quality and quantity. However, several factors can still reduce the overall yield (Gérard et al., 2017). Given these challenges, there is an increasing need for more precise cultivation techniques, where machine learning and data-driven technologies can play a crucial role in optimizing field management and improving yield efficiency (Xia et al., 2024).
Thailand considers oil palm a pivotal economic crop due to its remarkable yield rate compared to other oil crops. In 2016, the nation dedicated 729,600 hectares to oil palm cultivation, which has been on an upward trajectory (Suppalakpanya et al., 2019). By 2020, Thailand’s oil palm plantation area spanned over 9,954.27 km2, trailing only Indonesia and Malaysia globally. The majority of this area, approximately 8,500 km2, is situated in southern peninsular Thailand. Krabi boasts the largest plantation stretch in this region, whereas Ranong is renowned for its impressive yield per unit area (Worachairungreung et al., 2023). However, Thailand’s oil palm industry faces challenges, and one of these challenges is the presence of over 200,000 small-scale growers. Additionally, associated production costs and logistical complexities further impact the industry. In contrast to key producers like Indonesia and Malaysia, which utilize vast transportation networks, Thai farmers predominantly employ smaller vehicles. Furthermore, sector-specific expertise is needed to boost the optimal amount of oil production. Thai oil palm cultivators face the pressing challenge of harvesting their crops prematurely, which diminishes oil content and reduces potential profits (Raksaseri, 2023; Treerutkuarkul, 2021). Machine learning can play an essential role in addressing the challenges of premature harvesting in Thailand’s oil palm industry by predicting optimal harvesting times. Accurate prediction of when to harvest allows farmers to maximize oil content in the fruit, directly improving yields and increasing profitability. Given Thailand’s reliance on small-scale growers and the logistical hurdles they face, adopting machine learning can streamline operations by providing data-driven insights on when to harvest, helping farmers avoid premature harvesting, which significantly lowers oil content.
With the advent of machine learning, precision agriculture is experiencing revolutionary advancements. These recent advancements have demonstrated the significance of machine learning in predicting crop yields by identifying linear and nonlinear patterns within intricate agro-meteorological data. Oil palm cultivation, striving to adhere to global sustainability benchmarks, also incorporates these innovations (Behmann et al., 2015; Chlingaryan et al., 2018; Dimitriadis & Goumopoulos, 2008; Rahman et al., 2018). Tasks like soil and crop management, crop selection, yield predictions, and more are evolving through machine learning. Despite this capability, the utilization of machine learning techniques for predictive analysis remains limited within the oil palm industry, particularly in Thailand. A systematic review by Khan et al. (2021) identified an imbalance in the focus of oil palm research, with 84% of studies using classification techniques and only a small proportion exploring regression methods for predictive analysis. The geographical distribution of the analyzed articles revealed that the top six countries involved in oil palm research were Malaysia, with 38 articles, followed by Indonesia, the UK, the USA, Australia, China, and Thailand, with 11, 8, 5, 4, and 4 articles, respectively. Based on the geographical distribution of studies, Thailand is significantly underrepresented compared to key players like Malaysia, further highlighting a gap in research specific to the Thai oil palm industry. The limited adoption of regression-based approaches for oil palm predictions has left a crucial gap in developing precision agriculture solutions for this crop. Hence, adopting automation and precision approaches through machine learning in this domain is imperative, especially in Thailand, as the integration of machine learning techniques can assist in guiding farmers on the best harvesting times to optimize oil yields. Such guidance can augment oil quality, aligning it with countries like Malaysia and Indonesia, which are considered premium producers.
This study aimed to compare machine learning algorithms for predicting the oil content from different parts of both ripe and raw oil palm fruits (top, middle, and down). Additionally, we compared algorithms for predicting oil volume in semi-ripe and unripe fruits. The findings have the potential to provide critical insights to farmers, enabling more informed decisions about harvesting times, thus improving oil quality and stabilizing supply-demand relationships. This research not only contributes to the growing body of work in precision agriculture but also underscores the need for Thailand to catch up with global leaders in oil palm cultivation by leveraging the full potential of machine learning.
. Materials and methods
Machine learning is becoming increasingly pervasive, impacting human society and the natural world, including agriculture (Dahal et al., 2021; Gonzalez-Rivero et al., 2020). These algorithms enable data-based decision-making and predictions. Predicting agricultural outcomes, such as crop yields, can significantly affect food security and livelihoods.
Machine learning algorithms are typically categorized into three main types based on their learning feedback (Murphy, 2018; Verbraeken et al., 2020): supervised, unsupervised, and reinforcement learning. Our study focused on supervised learning, which predicts outcomes based on labeled data. Moreover, this approach has several algorithms that can be used to build the predictive model. Thus, to predict agricultural outcomes, this study selected seven popular algorithms based on different constructions to fit the model, namely Linear Regression, Decision Trees, Support Vector Regression, Random Forest, Gradient Boosting, Extra Gradient Boosting Machine, and Light Gradient Boosting Machine.
. Linear regression
Simple linear regression involves predicting a dependent variable using a single independent variable, known as univariate regression analysis. In simple linear regression, the dependent and independent variables are differentiated to determine the relationship between the two variables. This relationship is similar to correlation, but unlike correlation, simple linear regression distinguishes between the dependent and independent variables.
. Decision Trees
Decision Trees (DT) are a non-parametric and simple structure classification algorithm for capturing nonlinear relationships between features and classes (Friedl & Brodley, 1997). They are represented as a tree-based hierarchy of rules and functions by recursively partitioning or splitting the input data into smaller subsets (Friedl & Brodley, 1997; Song & Ying, 2015). This splitting process is guided by thresholds defined at each internal node in the tree. Starting from the root node in the DT, the input data are successively divided into sub-nodes and further sub-nodes (Sharma et al., 2013; Song & Ying, 2015). Ultimately, the input data are classified based on this binary subdivision, with the final nodes, called leaf nodes or leaves, representing the target classes (Maxwell et al., 2018; Pal & Mather, 2003). Despite their effectiveness, DTs have limitations. They may not always produce optimal solutions, as they rely on a single tree. Overfitting is also a common issue with DTs, requiring careful consideration during their use.
. Support Vector Regression
Support Vector Regression (SVR) is a supervised learning model for classification and regression. This approach is beneficial for examining the connections between a dependent variable and one or more independent variables. By framing an optimization problem, SVR learns a regression function that connects input predictor variables to the output observed response values. SVR is advantageous as it balances model complexity and prediction error, demonstrating strong performance, particularly with high-dimensional data.
Let the dot product pace
. Random Forest
Random Forest (RF) is a robust ensemble learning method that utilizes multiple decision tree classifiers to overcome the limitations of a single classifier in achieving the optimal solution (Belgiu & Drăguţ, 2016; Breiman, 2001; Cutler et al., 2007). By incorporating many trees instead of a single tree, the RF algorithm employs a majority vote technique to assign a final class label, thereby improving accuracy. This approach also helps address issues related to handling many variables in the model. To achieve this, each tree in the RF model is trained on a randomly generated subset of the training data and uses only a subset of the tree’s variables. While this strategy may reduce the performance of individual trees, it reduces the correlation between trees, making the ensemble more reliable. Additionally, since RF incorporates multiple classifiers, there is no need to prune individual trees, simplifying the model-building process (Breiman, 2001). Overall, RF is effective in improving classification performance and handling complex datasets.
. Gradient Boosting Machines
Gradient Boosting Machine (GBM) is a prediction algorithm based on decision trees (Friedman, 2001). It constructs a model gradually, additively, and sequentially by combining multiple decision trees in linear combinations (Biau et al., 2019). GBM shares a foundational concept with AdaBoost, making it easier to understand. However, the critical difference lies in how they address the weaknesses of weak classifiers.
In AdaBoost, weaknesses are identified using high-weight data points that are difficult to fit, whereas in GBM, they are identified using gradients. The methodology involves modeling data with simple base classifiers, analyzing errors, focusing on hard-to-fit data points to correct them, and assigning weights to each predictor to combine all predictions for a final result.
GBM has demonstrated significant success in various applications, including text classification, web searching, landslide susceptibility assessment, and image classification (Chen & Guestrin, 2016; Samat et al., 2020). However, GBM may not perform well with exceptionally noisy data, as it can lead to overfitting (Jafarzadeh et al., 2021).
. XGBoost
Extreme Gradient Boosting Machine (XGBoost), developed by Chen and Guestrin (2016), is a gradient tree boosting method that builds upon regular Gradient Boosting Machines (GBM) with several enhancements. It introduces features like regularization to prevent overfitting tree pruning that specifies tree depth using the Maximum Tree Depth (MTD) parameter and prunes the tree backward instead of based on loss criteria, resulting in improved computational performance and parallelism that utilizes a block structure for parallel learning, leading to faster computation (Zhong et al., 2022). XGBoost employs a decision tree as a booster and has shown outstanding performance across various ranking tasks, classification, and regression (Samat et al., 2020). Despite its success, XGBoost has not been extensively studied in remote sensing image classification tasks, particularly concerning spectral and spatial features, classification accuracy, computational efficiency, and the influence of crucial parameters. The main advantages and disadvantages of only numerical values are accepted for processing.
. LightGBM
The LightGBM algorithm is a gradient-boosting framework that builds on the concept of decision trees (Shi et al., 2019). It is designed to reduce computation time while maintaining high accuracy (Friedman, 2001; Ke et al., 2017; Shi et al., 2019). An important distinction between LightGBM and other decision-tree-based algorithms lies in its tree growth strategy. While traditional methods grow trees level-wise (horizontally), LightGBM grows trees leaf-wise (vertically), leading to a more complex structure (Machado et al., 2019). This approach enhances the efficiency of the algorithm. Although the implementation of XGBoost and LightGBM is similar, LightGBM outperforms XGBoost in training speed and ability to handle large datasets. However, both methods require extensive parameter tuning for optimal classification performance and reliable results compared to methods like Random Forest (RF).
. Data preparation
The dataset used in this study was obtained from the Southern Palm Oil Industry (1993) Co. Ltd. in Surat Thani province, Thailand. The data collection process involved two main components. Firstly, data were gathered in real-time situations using specially designed devices based on IoT (Internet of Things) technology. These devices featured Resistive Level Sensors and Temperature Humidity Sensors installed on the ESP32 NodeMCU board, as depicted in Figure 1.
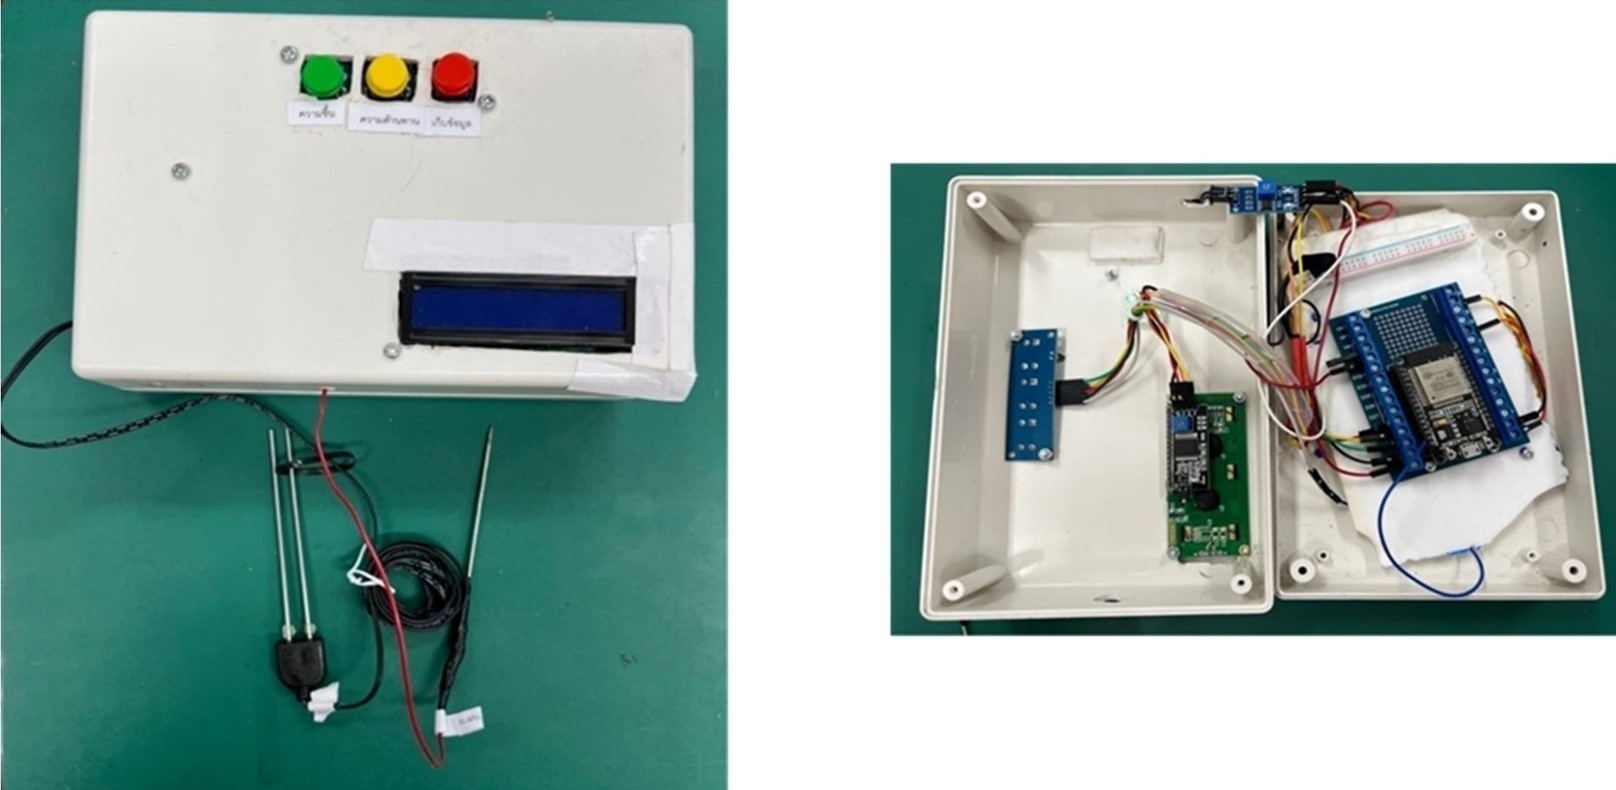
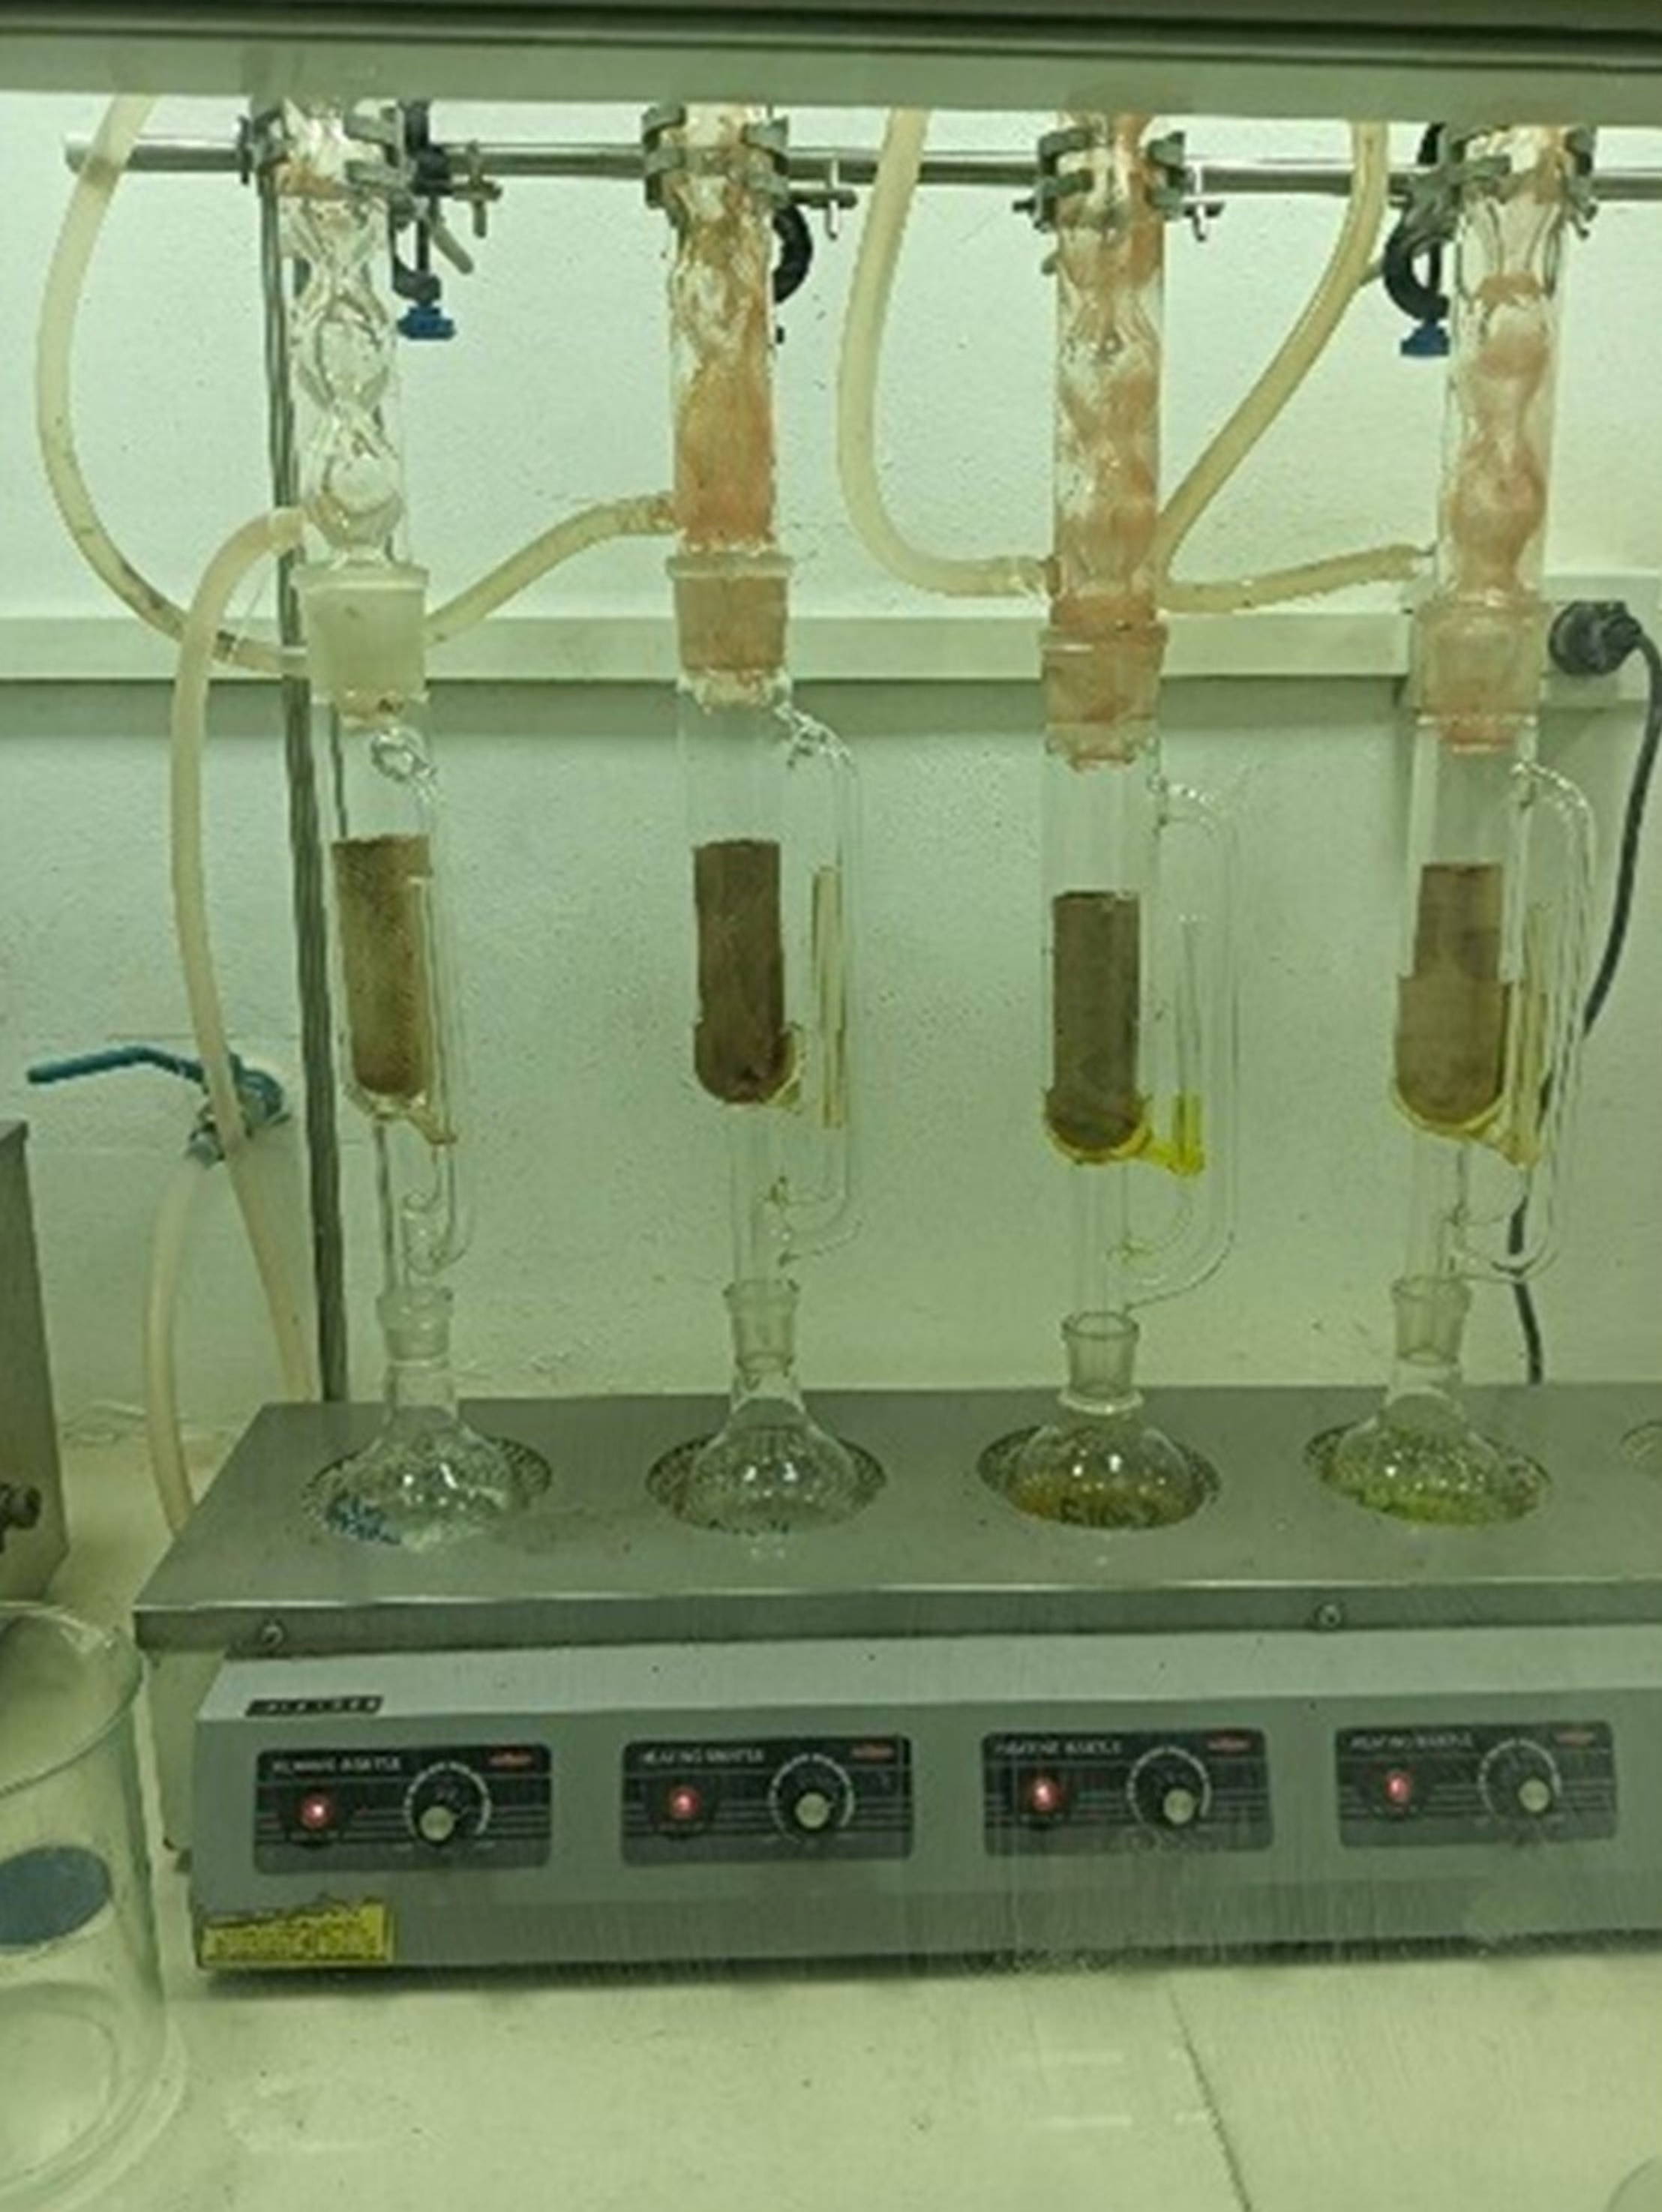
The collected humidity and resistance level data were transmitted to the server using the Internet as a web application. Simultaneously, laboratory experiments were conducted utilizing Soxhlet extraction (see Figure 2), followed by laboratory scientists performing the measurements and recording the results in a spreadsheet. Due to the preliminary nature of this study and the time constraints involved, a sample size of 30 seedlings was used. The data collection spanned two months, from February to March 2023, with data collected continuously daily throughout this period. Each day, the testing team could test only 2–3 samples. Additionally, to ensure data accuracy and completeness, efforts were made to avoid missing values, especially considering the limited sample collection.
For the IoT data, the average of measurements from 3 positions at each level of the oil palm fruit was used to minimize potential discrepancies. The data source in Surat Thani province of Thailand provided valuable insights for the study’s analysis and conclusions.
. Data model
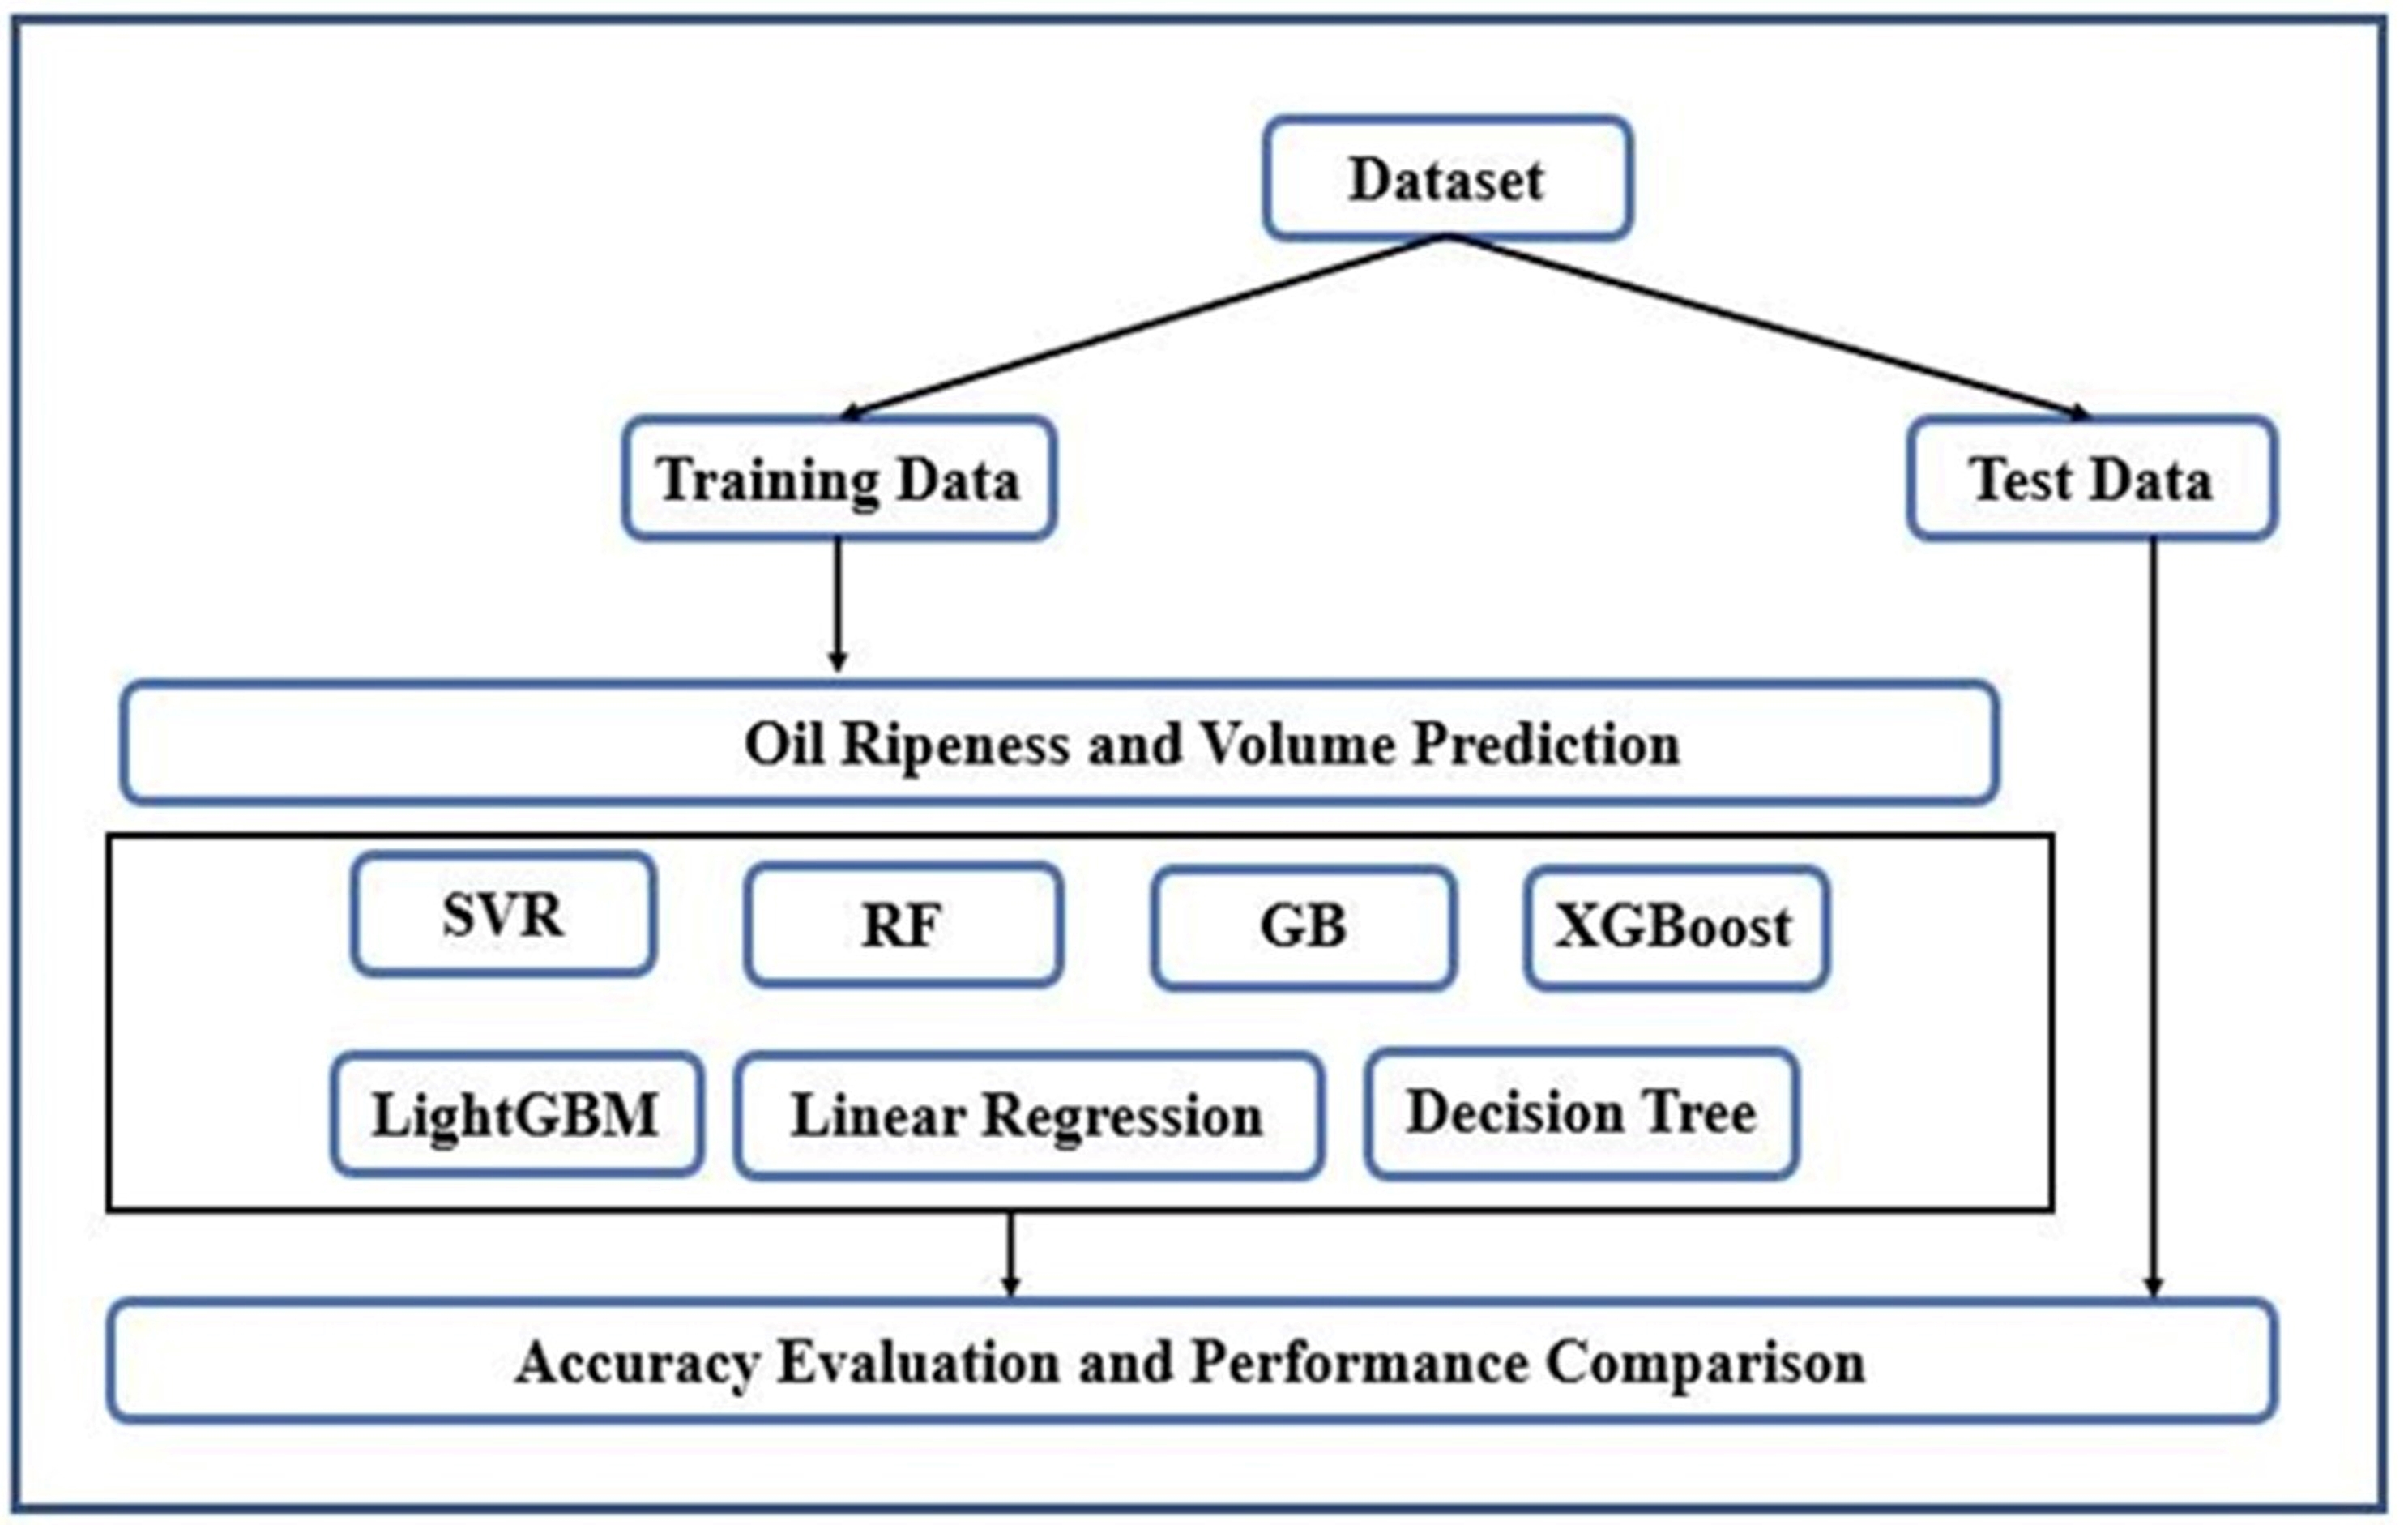
Machine learning involves a set of methods where computers can model the relationship between numerical data representations and specific target values (Hao & Ho, 2019). Machine learning is broadly categorized into two types: supervised learning (which trains on known inputs and outputs to predict future outputs) and unsupervised learning (which discovers patterns or structures in the input data) (Swamynathan, 2017) (Figure 1). The machine learning techniques applied in our study included linear (linear Regression) and nonlinear models (Decision Tree, Random Forest, Gradient Boosting (GB), eXtreme Gradient Boosting (XGBoost), Light Gradient Boosting Machine (LightGBM), and Support Vector Regression (SVR)).
These algorithms are some of the most commonly utilized approaches in recent literature (Çakıt & Dağdeviren, 2022). Each belongs to a distinct algorithmic family with fundamentally different internal architectures (Fernández-Delgado et al., 2014). Basic descriptions of these methods are presented in Table 1.
Table 1
Overview of machine learning methods and Python packages.
All the models were implemented in Python/Jupyter Notebook, and scikit-learn packages were employed to incorporate these machine-learning algorithms into our study (Pedregosa et al., 2011). An overview of the modeling done is presented in Figure 3.
. Performance metrics
To assess the disparity between the observed and predicted values (error) for the models employed in this study, various performance metrics were utilized, as described by Çakıt and Karwowski (2017) and Çakıt et al. (2020). In this analysis, the effectiveness of the algorithms used was determined by evaluating the model’s accuracy through metrics, such as Root Mean Squared Error (RMSE), Mean Squared Error (MSE), and the coefficient of determination (R2). Low values of RMSE and MSE indicate more precise model outcomes, while higher R2 values signify a stronger alignment between observed and estimated values. These metrics were computed using the following eqnarrays:
where
. Results
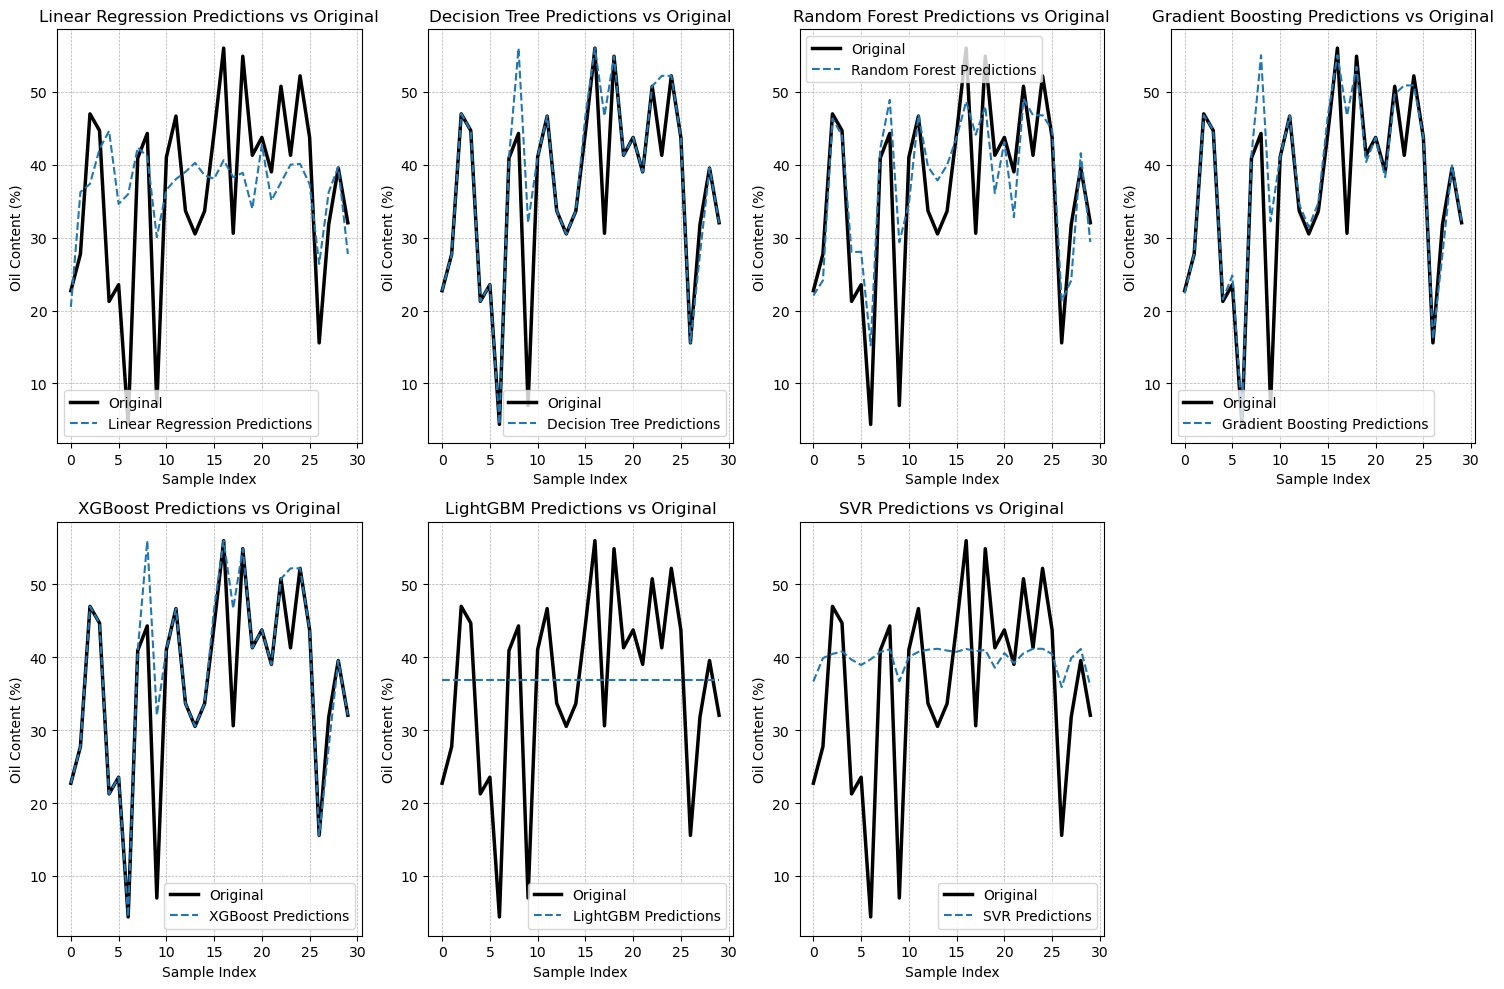
In this study, we present the results obtained from our predictive analysis. The predictions of oil content in ripe and raw oil palm fruit at the top, middle, and down positions are illustrated in Figure 4, Figure 5, Figure 6, Figure 7, Figure 8, and Figure 9, respectively.
Figure 4
Comparison between real-world observations and the outputs generated by the proposed algorithms for ripe oil palm in the top position.
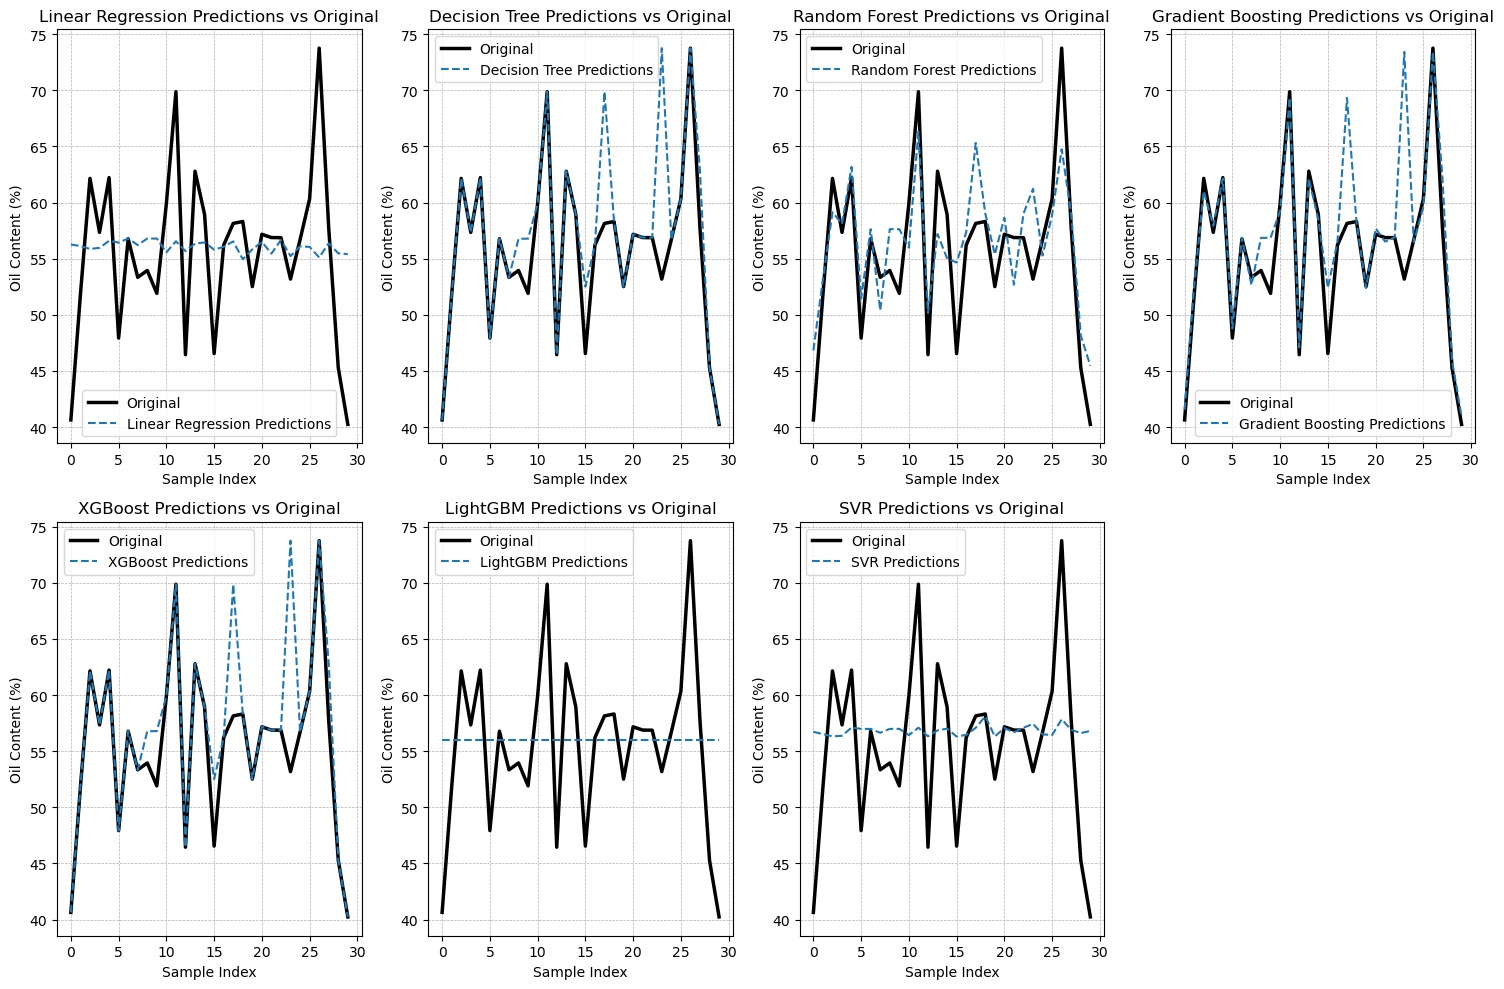
Figure 5
Comparison between real-world observations and the outputs generated by the proposed algorithms for ripe oil palm in the middle position.
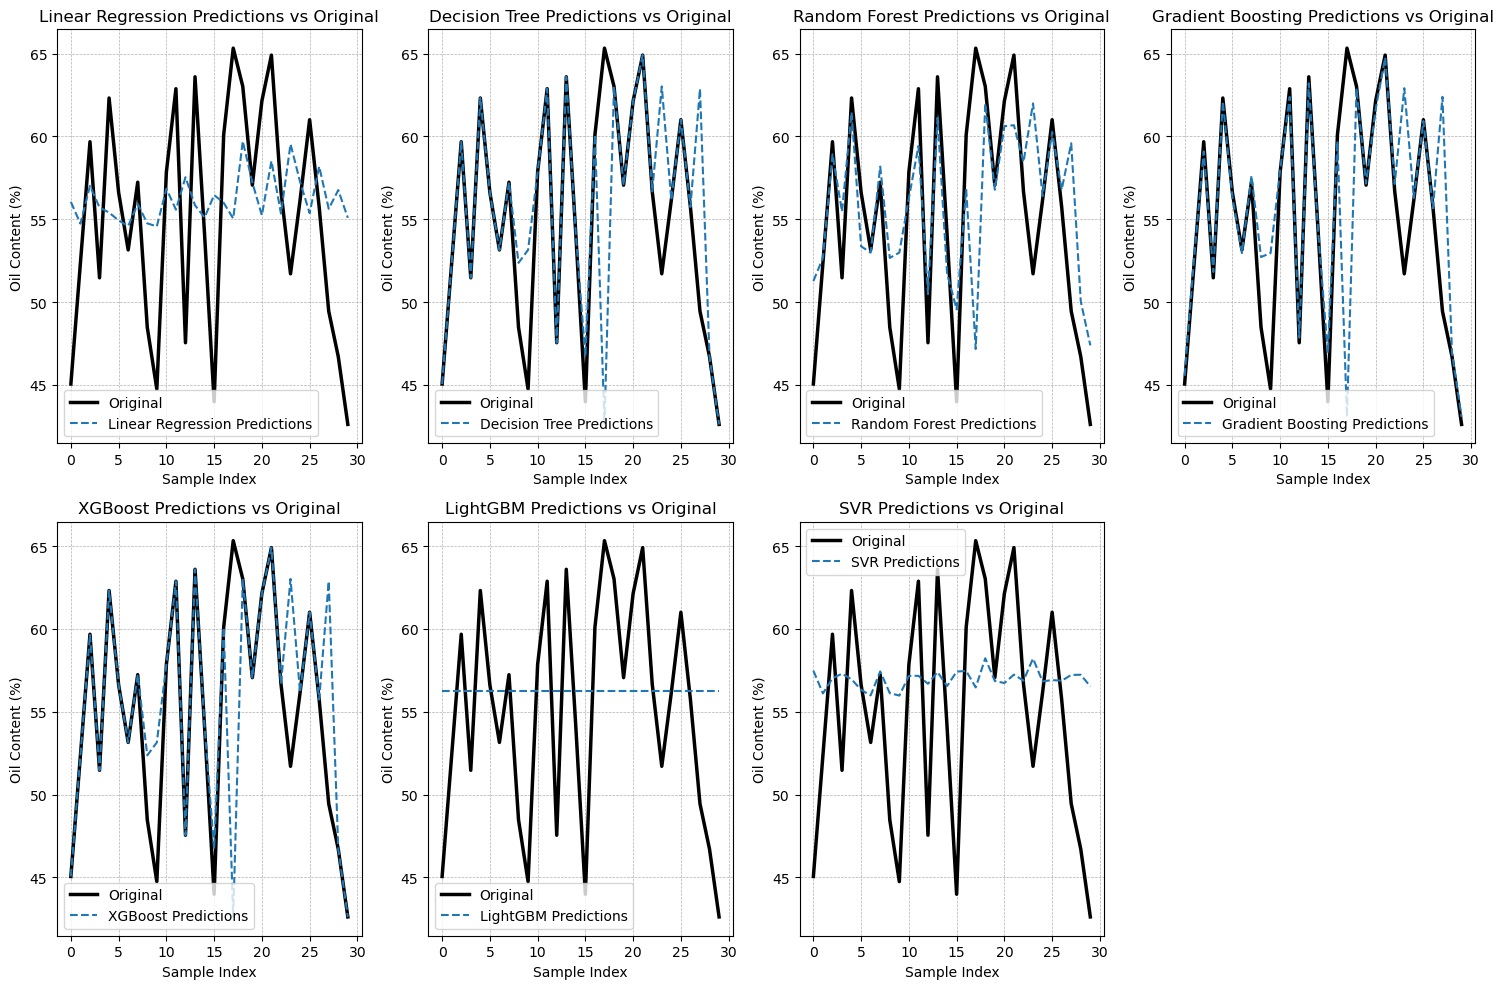
Figure 6
Comparison between real-world observations and the outputs generated by the proposed algorithms for ripe oil palm in the down position.
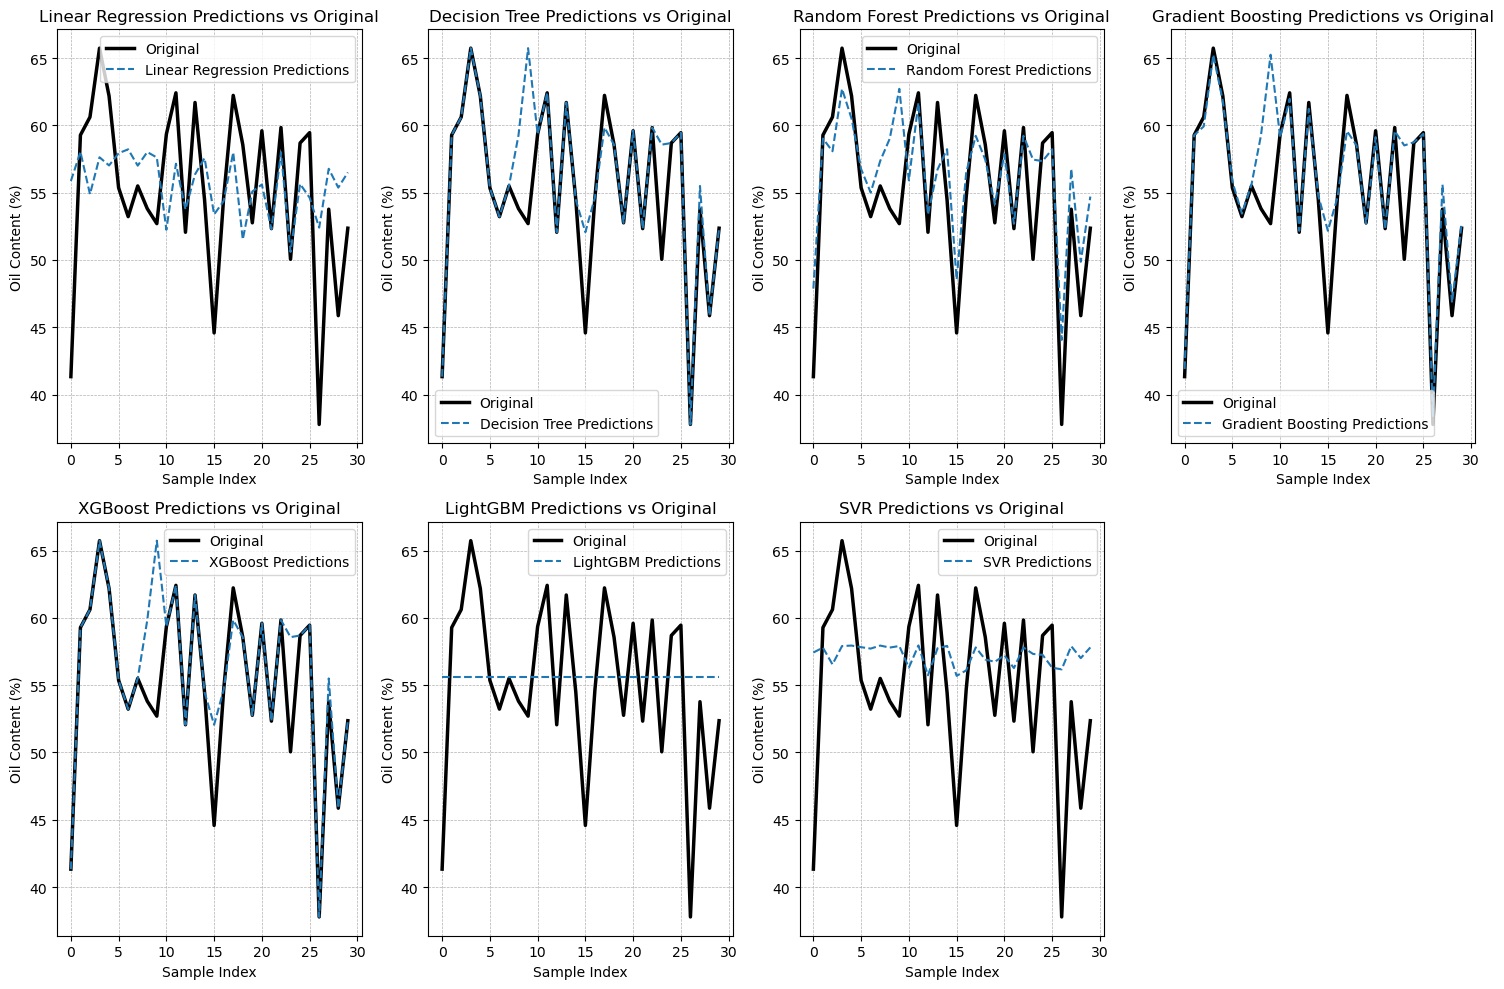
Figure 7
Comparison between real-world observations and the outputs generated by the proposed algorithm for raw oil palm in the top position.
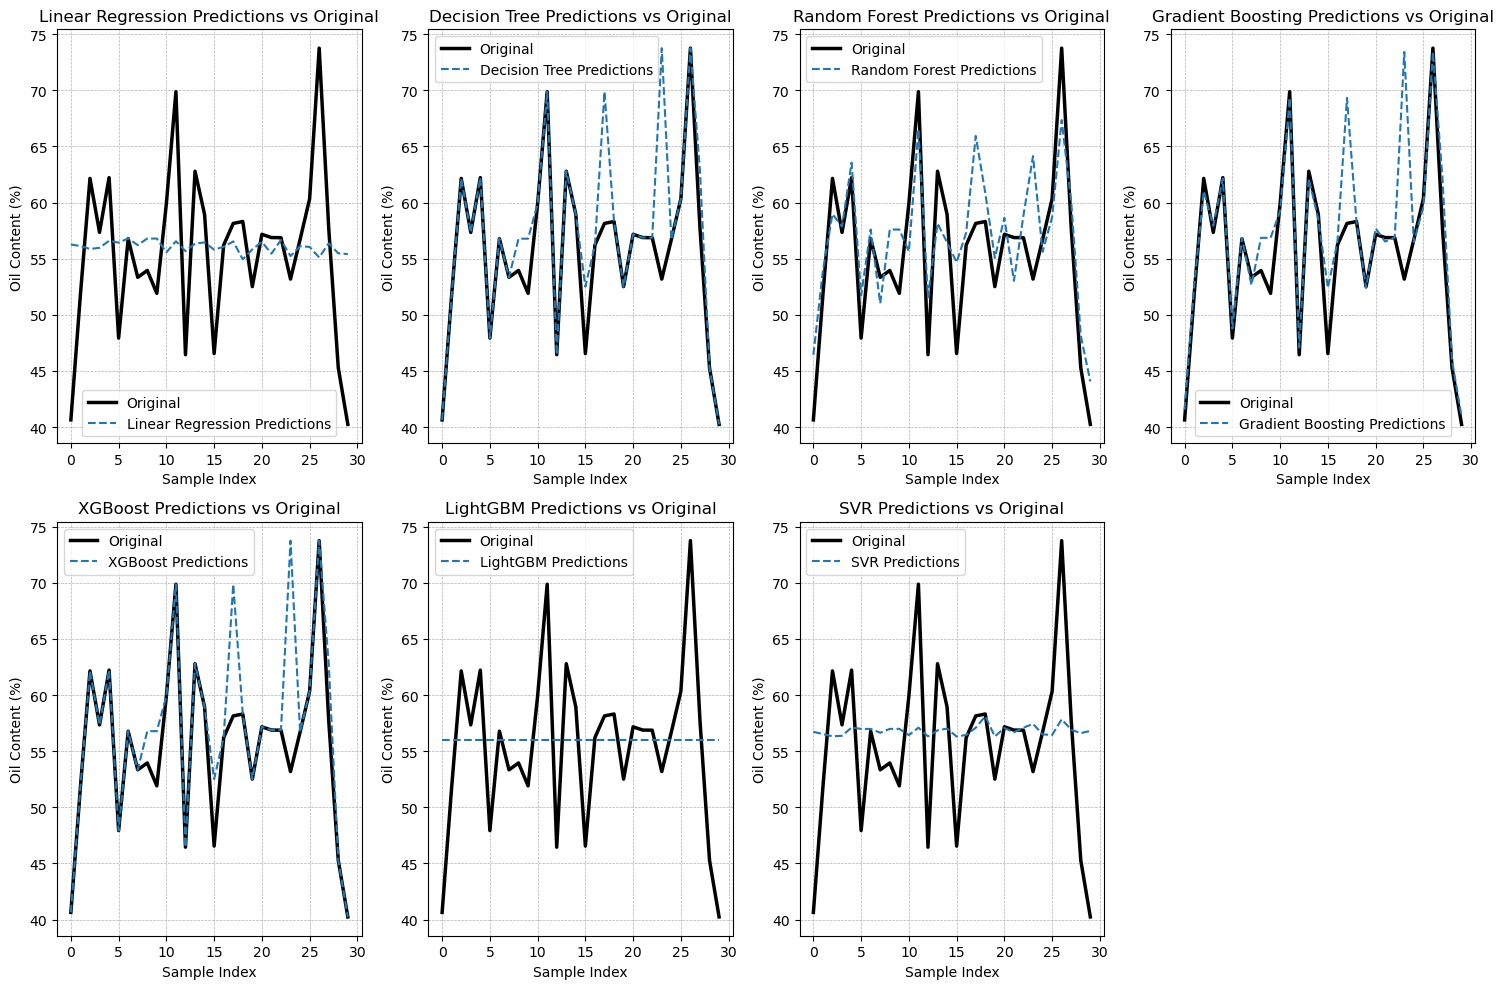
Figure 8
Comparison between real-world observations and the outputs generated by the proposed algorithms for raw oil palm in the middle position.
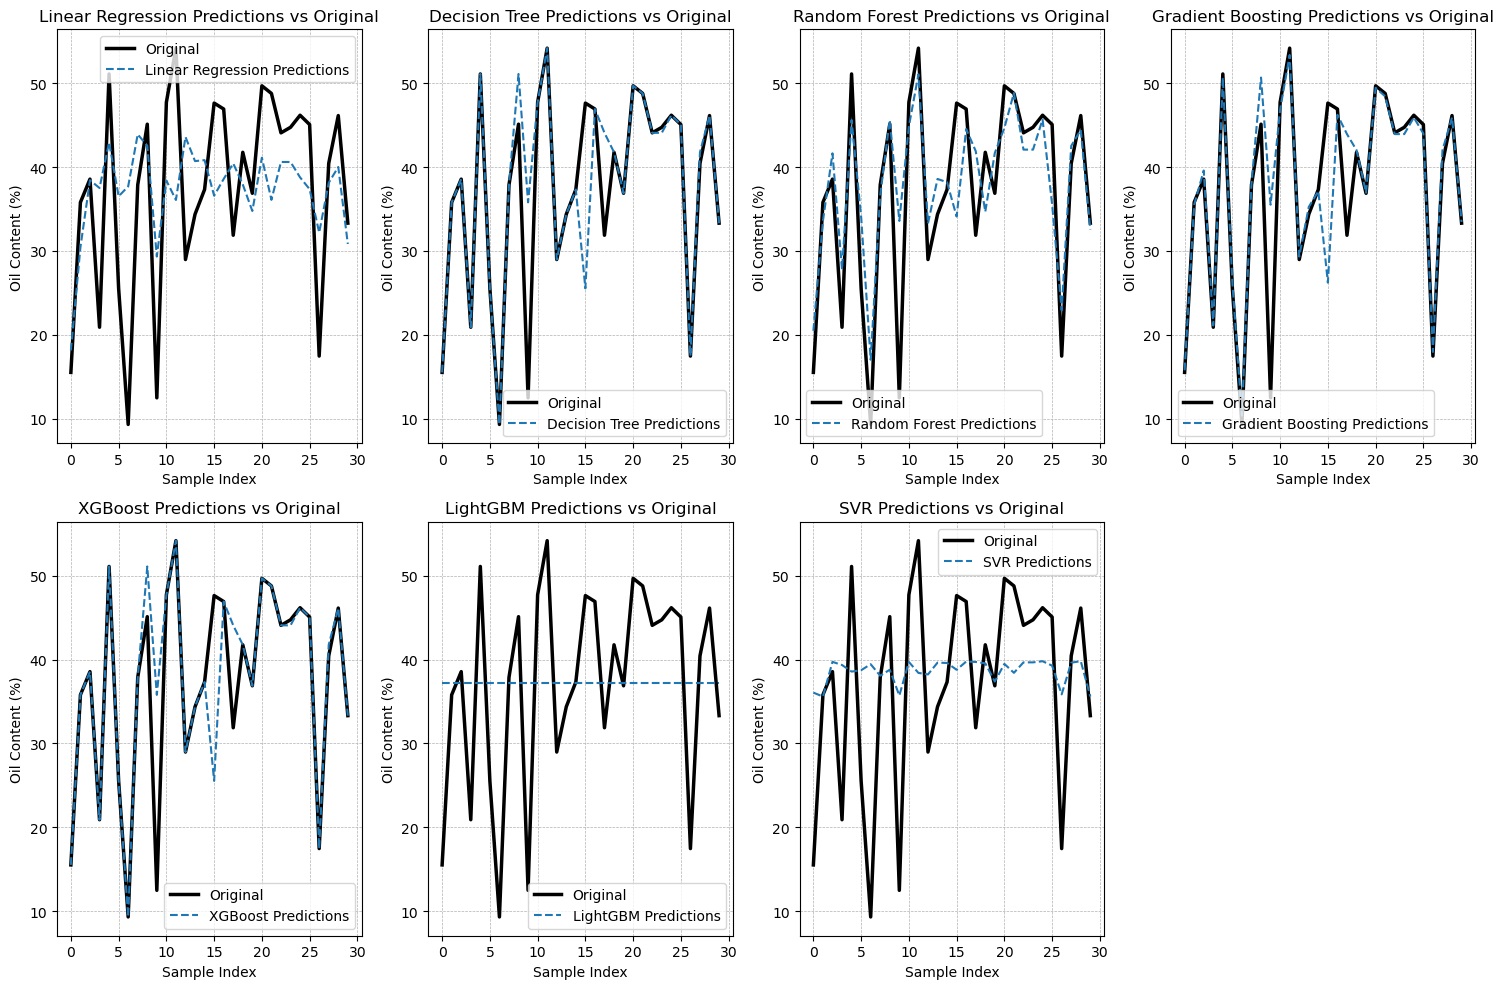
Figure 9
Comparison between real-world observations and the outputs generated by the proposed algorithms for ripe oil palm in the down position.
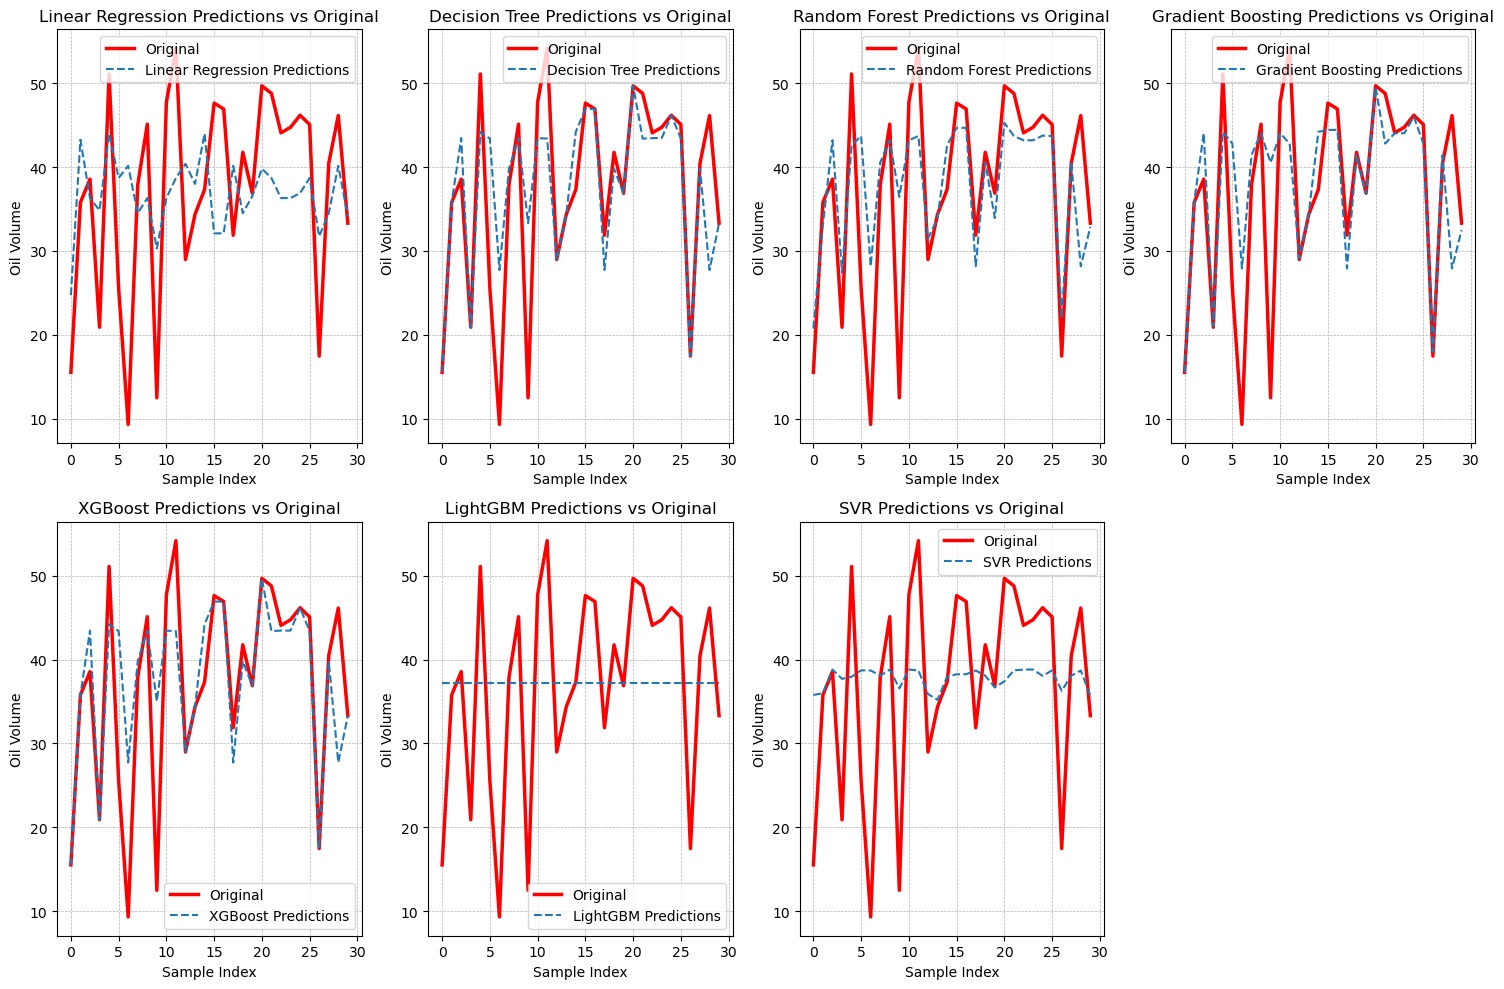
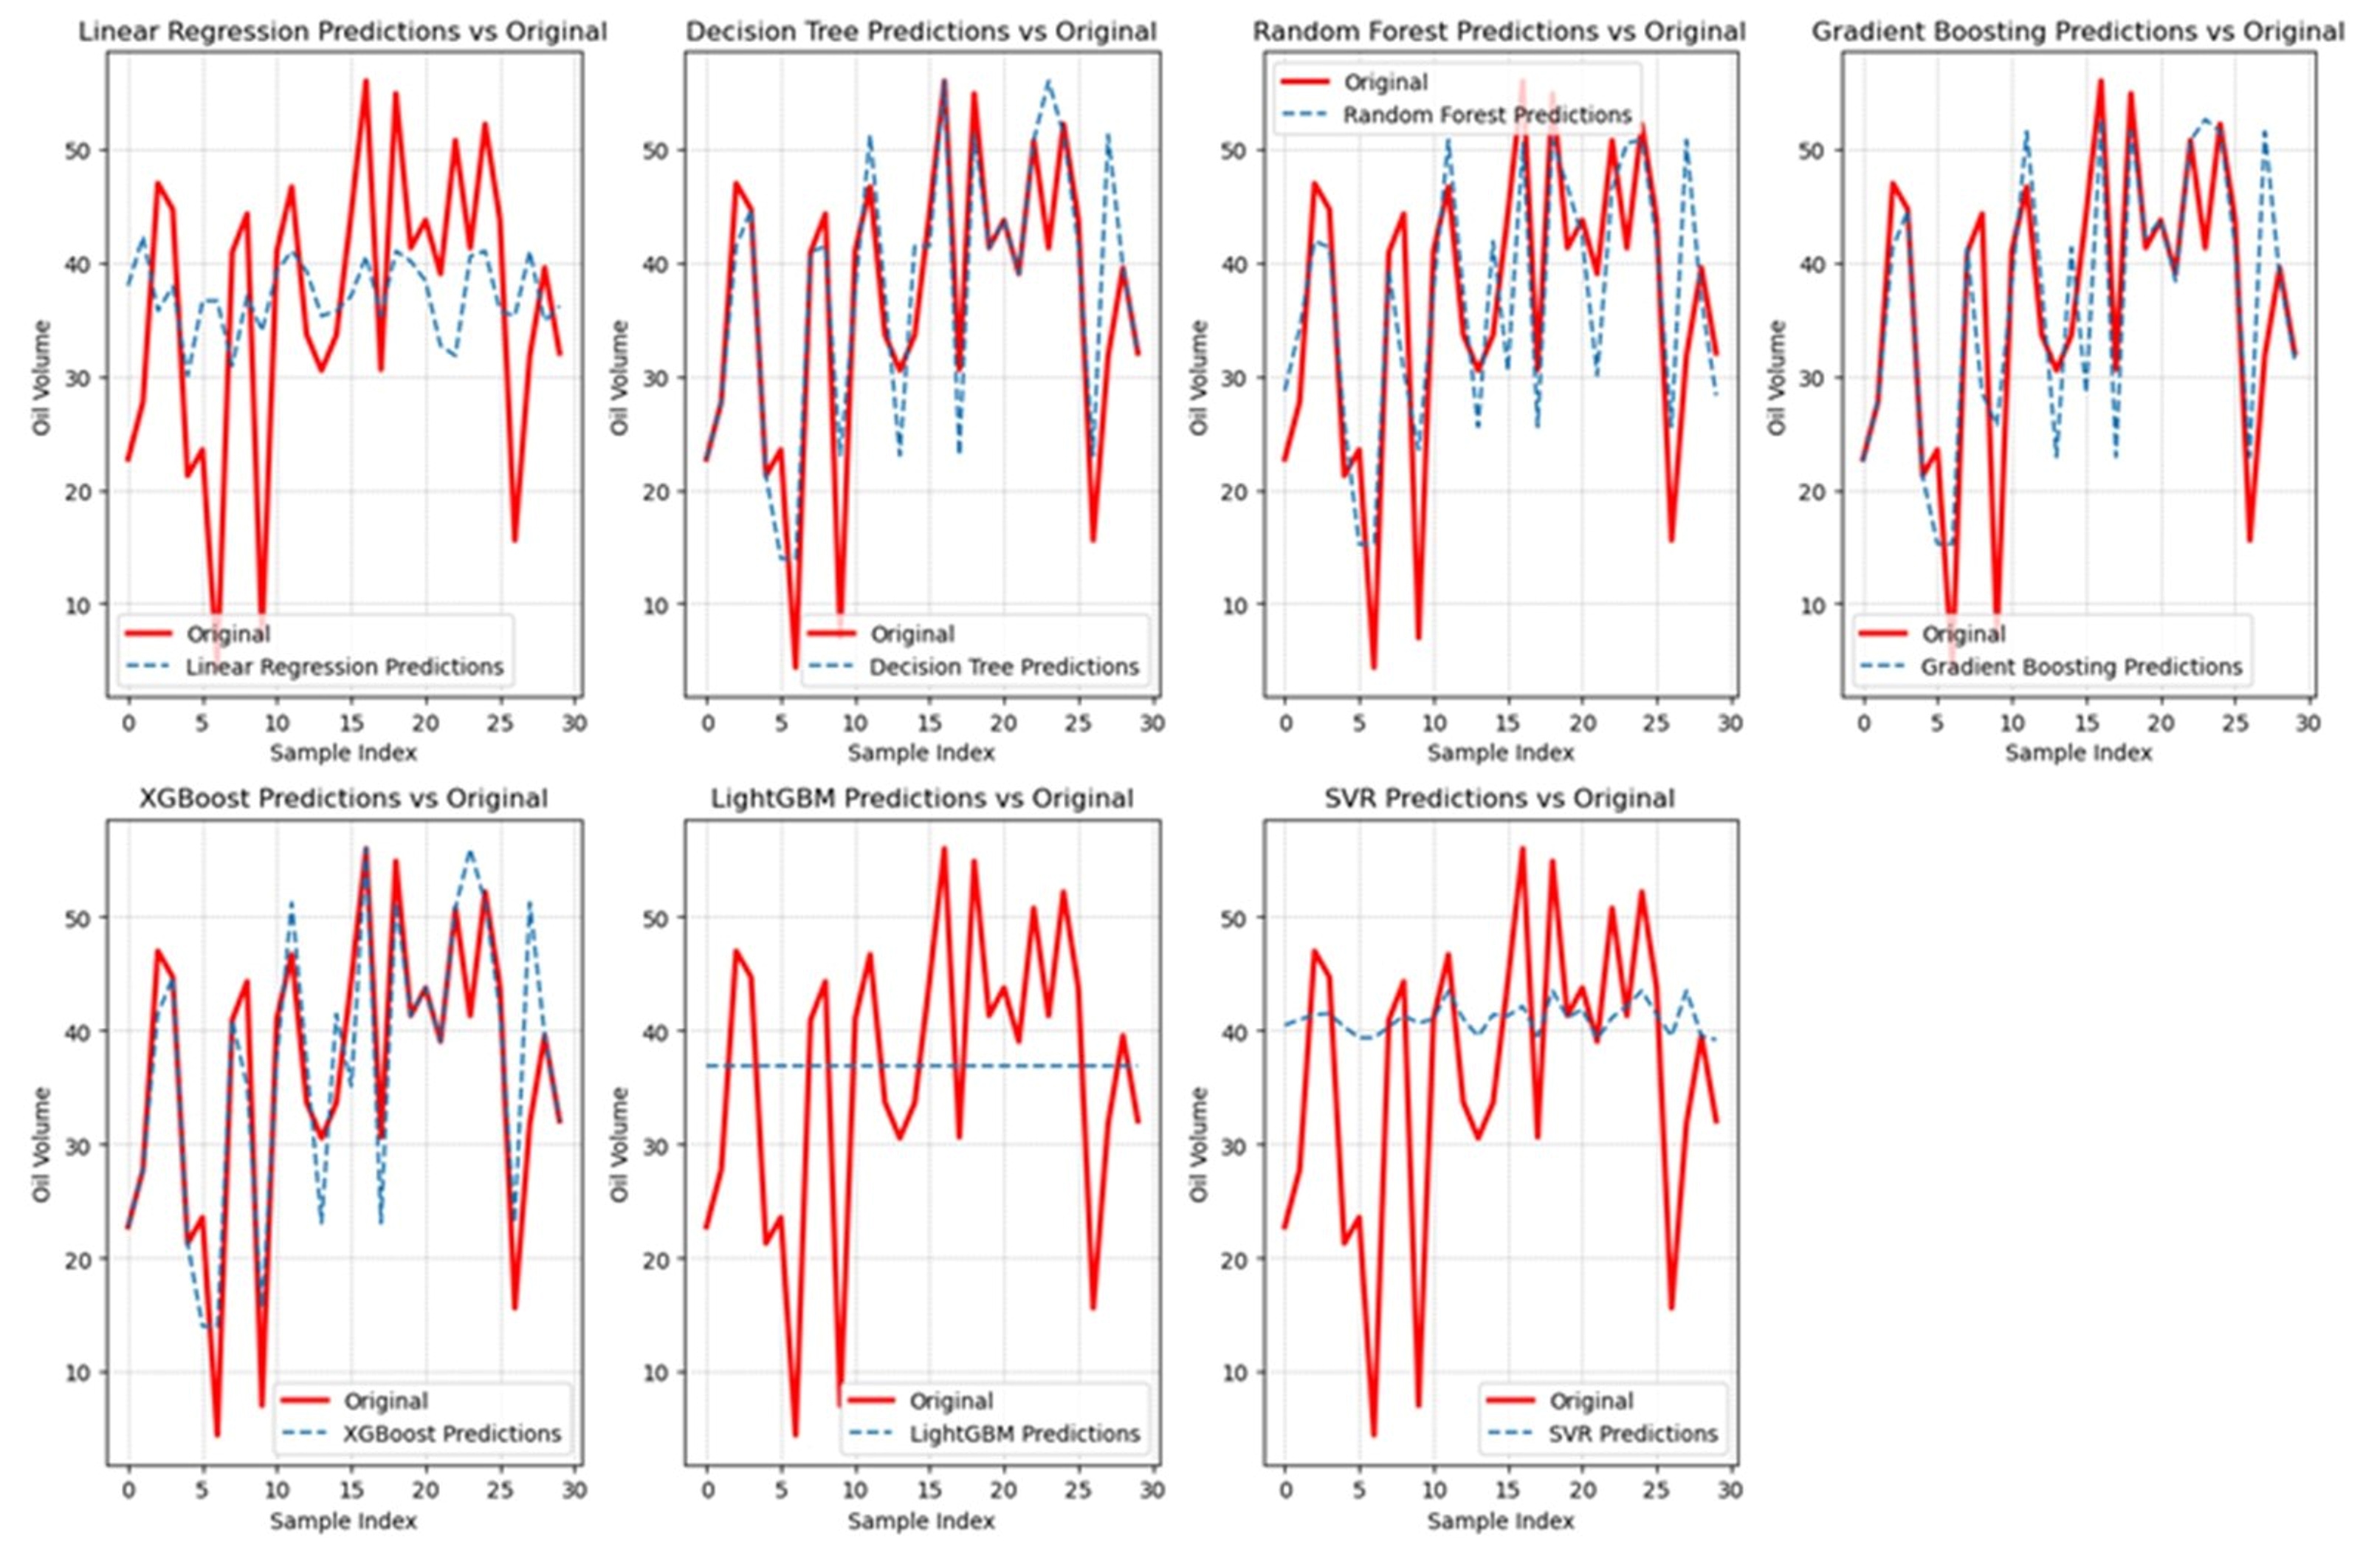
Additionally, Figure 10 and Figure 11 present the results obtained from oil volume predictions in semi-ripe and unripe oil palm fruit, respectively.
. Discussion
. Performance evaluation based on oil palm fruit position (ripe fruit)
In our analysis of oil content prediction in ripe fruit (Table 2), in the ‘Top’ position, both GBM and RF models exhibited superior predictive accuracy compared to the other algorithms. The RF model, in particular, had a higher R2, indicating a more precise fit to the data. The XGBoost and DT methods closely followed suit, underscoring their strong performance in capturing variations in ripeness. Similarly, the Decision Tree and RF models had the lowest MSE and MAE values for oil palm fruit in the ‘Middle’ position. GBM and XGBoost also demonstrated strong performance, emphasizing their reliable predictive capabilities across different positions on the palm tree. Lastly, in the ‘Down’ position, the Decision Tree and Gradient Boosting models consistently outperformed the other methods. These findings align with Sinambela et al. (2020), who also highlighted the central position of the fruit as a critical indicator of ripeness. Sinambela’s statistical approach using two-way ANOVA supports our conclusion that model accuracy is influenced by the fruit position on the tree.
Table 2
Performance metrics for oil content prediction.
. Performance evaluation based on oil palm fruit position (raw fruit)
For oil content prediction in raw fruit (Table 3), the RF model stood out as the top-performing model in the ‘Top’ position, demonstrating superior accuracy with the lowest MSE values and a relatively high R-squared value, indicating a strong fit to the data. The other models, such as GBM, XGBoost, and DT, performed well with slightly higher MSE and a lower R-squared value than the RF model.
Table 3
Performance metrics for oil content prediction.
In the ‘Middle’ position, the DT model with the lowest MAE value and GBM with the lowest MSE and the highest R-squared value demonstrated superior performance compared to the other models. This indicates their ability to predict oil content in raw fruit more accurately than the other models. The Random Forest and XGBoost models also showed competitive performance in this position, highlighting their consistency across different scenarios.
In the ‘Down’ position, DT, with the lowest MAE value, and GBM, with both the lowest MSE and the highest R-squared value, outperformed the other models. The XGBoost model also performed well, indicating its robust predictive capabilities even in challenging scenarios. These results highlight the effectiveness of DT and GBM for predicting oil content in raw fruit, with XGBoost also proving to be a strong performer. Similar approaches were utilized by Sae-Tang (2020), who employed machine learning models, like convolutional neural networks, to estimate oil content in fresh fruit bunches using surface color as a predictor. Their results also demonstrated high accuracy, emphasizing the importance of advanced algorithms in oil content prediction.
. Performance evaluation based on oil volume (semi-ripe fruit)
In our evaluation of predictive models for oil volume in semi-ripe fruit, Table 4 compares the seven algorithms used, highlighting their accuracy and performance. Linear Regression demonstrated the weakest predictive capability, with the highest MSE of 126.5536 and an MAE of 9.5926, signaling significant deviations from actual values. The low R-squared value of 0.1130 underscores its poor fit to the data, making it an ineffective model for the current data. In contrast, DT emerged as the best-performing model, with the lowest MSE (58.2306) and MAE (4.3087) and an R-squared value of 0.5919, suggesting it can effectively capture patterns in the data for predicting oil volume in semi-ripe oil palm fruit. While Random Forest (RF) also performed well, it did not surpass DT, showing a higher MSE of 69.1243 and a lower R-squared value of 0.5156. This indicates that although RF remains a strong model, it does not provide the same level of accuracy as DT. SVR yielded high prediction errors, with an MSE of 131.8618 and a weak R-squared value of 0.0759, marking it as less reliable than the other models. GBM showed moderate performance, with an MSE of 70.6910 and a fair fit (R-squared = 0.5046), while XGBoost performed better, with a lower MSE (60.7034) and an R-squared value of 0.5746, making it a competitive alternative to DT. Finally, LightGBM displayed poor predictive capability, with the highest MSE (142.6922) and an R-squared value close to zero, demonstrating its unsuitability for this analysis. In conclusion, DT stands out as the most accurate model for predicting oil content in semi-ripe fruit, outperforming all the other algorithms. This complements the findings by Wangrakdiskul and Yodpijit (2015), who applied an exponential growth model for forecasting palm oil production and consumption in Thailand, showing the significance of accurate prediction models in optimizing palm oil yield.
Table 4
Performance metrics for predictive models on semi-ripe and unripe fruit.
. Performance evaluation based on oil volume (unripe fruit)
In our evaluation of predictive models for oil volume in unripe fruit, Table 4 highlights distinct variations in accuracy and performance across the seven algorithms. Linear Regression demonstrated the weakest performance, with an MSE of 150.6958, reflecting a considerable discrepancy between the predicted and actual values. Its MAE of 9.8980 and low R-squared value of 0.0802 further emphasize its limited capacity to capture the underlying patterns in the data. In contrast, DT significantly outperformed Linear Regression, with a notably lower MSE of 46.0533 and MAE of 4.3287, indicating a more accurate prediction of oil volume in unripe fruit. The R-squared value of 0.7189 underscores the model’s ability to fit the data well. RF exhibited a slightly higher MSE of 66.1267 compared to DT. However, it still provided a solid fit with an R-squared value of 0.5964, positioning it as a robust alternative for prediction. SVR performed poorly, yielding an MSE of 168.8536 and a negative R-squared value (−0.0306), signifying its lack of predictive accuracy and weak model fit. GBM displayed moderate predictive capability, with an MSE of 59.8810 and an R-squared value of 0.6345. XGBoost further enhanced performance, delivering a lower MSE of 45.0934 and the highest R-squared value (0.7248) among the models evaluated. LightGBM, however, showcased poor performance, with an MSE of 164.3930 and an R-squared value of −0.0034, reflecting its inability to model the data effectively. Overall, DT and XGBoost emerged as the top performers in predicting oil volume in unripe fruit. These results resonate with the work of Puttinaovarat and Horkaew (2019), who leveraged deep learning and machine learning methods for identifying oil palm plantations, demonstrating the versatility and robustness of advanced machine learning techniques in the context of oil palm yield prediction and detection.
Based on the discussions of the obtained results, the following are suggestions for the models employed in this study to improve the current understanding of oil palm fruit harvesting and processing. Firstly, DT, XGBoost, and RF consistently demonstrate a strong predictive accuracy for oil content across different stages of ripeness. The accurate predictions of oil content help determine the optimal time for harvesting based on the fruit ripeness. This will reduce waste generated from harvesting fruit too early or too late, directly improving yields. Thus, industry professionals can implement data-driven harvesting strategies, ensuring that only fruit at peak ripeness is harvested to reduce losses, streamline operations, and increase profitability significantly.
Next, the analysis of fruit positions (Top, Middle, Down) also reveals that certain models perform better for specific positions on the palm tree. This implies that harvesting strategies can be refined based on the position of the fruit bunches, leading to more precise and customized harvesting methods. Professionals can tailor harvesting schedules to focus on specific areas of the tree where fruit shows the highest potential for oil yield, enhancing labor efficiency and reducing the environmental impact of broad harvesting approaches.
Lastly, machine learning models, especially when embedded into automated systems, can provide real-time predictions for oil content in different oil palm fruit positions. This can be paired with IoT devices or remote sensors, enabling continuous monitoring and data collection for model inputs. Large-scale plantations can leverage these models to monitor oil content continuously, allowing for dynamic adjustment of harvest schedules and predictive maintenance of processing facilities. This approach is consistent with the findings of Worachairungreung et al. (2023), who employed machine learning and data fusion techniques for classifying land use and land cover in oil palm plantations. Furthermore, Suppalakpanya et al. (2019) applied exponential time-series methods for forecasting crude palm oil prices and production in Thailand, which can complement the models we have discussed, opening avenues for more integrated forecasting approaches.
. Conclusions
Recent advancements in precision agriculture have highlighted the critical role of machine learning in predicting crop yields, leveraging its ability to discern intricate linear and nonlinear patterns within agrometeorological data. Despite this potential, the adoption of machine learning techniques for predictive analysis remains limited, especially within the oil palm industry in Thailand. While prior studies have explored various aspects of oil palm ripeness through diverse methods, this research builds upon that foundation by focusing on predicting oil ripeness based on moisture content in different oil palm positions (top, middle, and down) and oil volume content for semi-ripe and raw data, utilizing a supervised learning approach.
In the top position, both XGBoost and RF models demonstrated superior accuracy compared to the other methods. The Decision Tree and Random Forest models exhibited the lowest MSE and MAE values in the middle position. In contrast, in the down position, the Decision Tree and Gradient Boosting models consistently outperformed the other methods. DT and GBM demonstrated exceptional raw oil volume prediction accuracy with low MSE, MAE, and a high R-squared value. In contrast, XGBoost emerged as the standout model for oil volume content, proving to be the most accurate predictor for semi-ripe and unripe oil palms compared to the other methods.
This study highlights the potential of machine learning to enhance oil palm industry practices. It reveals top-performing models for accurate ripeness and volume predictions and provides valuable insights for optimizing agricultural strategies in Thailand.
Data Availability
The data that support the findings of this study is available at: https://figshare.com/articles/dataset/Predictions_of_oil_volume_in_palm_fruit_and_estimates_of_their_ripeness_A_comparative_study_of_machine_learning_algorithms/28090769
Code Availability
The code used to analyze the data in the current study is available at: https://github.com/Ses4short/Oil-palm-Thailand
