. Introduction
Ginger (Zingiber officinale Roscoe) stands as a paramount spice, with its rhizome serving as a source of invaluable tonics (An et al., 2020; Baliga et al., 2011; Engdal et al., 2009; Nicoll & Henein, 2009). The species harbors a plethora of bioactive secondary metabolites, including phenolic compounds and terpenes, each manifesting antiemetic, anti-inflammatory, antioxidant, anti-tumor, anti-cancer, and neuroprotective properties (Mao et al., 2019; Prasad & Tyagi, 2015; Yeh et al., 2014). Its historical role as a folk remedy encompasses diverse therapeutic applications, such as addressing headaches, fever, dyspepsia, nausea, digestive disorders, blood circulation disturbances, and inflammation (Ali et al., 2008; El baroty et al., 2010; Geiger, 2005). Furthermore, the distinctive aroma and traditional medicinal usages of ginger have made it a principal ingredient in the global food processing industry, giving rise to an array of popular processed products, including candied ginger, gingerbread, ginger oil, ginger candy, crystallized ginger, ginger powder, ginger beer, and ginger ale (Govindarajan & Connell, 1982; Nair, 2013; Rajathi et al., 2017; Shukla & Singh, 2007). Ginger’s nutraceutical properties have garnered significant attention within the realms of both food processing and pharmaceutical industries (Bag, 2018; Kubra & Jaganmohanrao, 2012; Vasala, 2012).
Thuy Bieu Ward (Hue City) and the Junction of Tuan (Huong Tho District) represent the primary cultivation regions for one of Vietnam’s most well-known ginger chemotypes (Hue’s ginger). The Hue’s ginger cultivar (characterized by an exceptionally robust flavor) possesses a unique essential oil content, substantiated by the notably high α-zingeberene amount of 32.52% in its essential oil (Hien et al., 2018). This secondary metabolite exhibits antimicrobial activity against various microorganisms (Penicillium spp., Candida albicans, Aspergillus niger, and Bacillus subtilis) and shows potential contributions to antipyretic, antiallergenic, analgesic, antitussive, and chemopreventive effects (El baroty et al., 2010; Sasidharan & Menon, 2010; Sharma et al., 2016). However, uncontrolled trading practices have resulted in the mixing of Hue’s ginger with unidentified ginger types, leading to the erosion and dilution of the native variety.
The initial attempt to differentiate Hue’s ginger from unknown chemotypes was undertaken based on retrotransposon-based markers (An et al., 2022). Although the study successfully identified distinctive markers for Hue’s ginger, the sample sizes from various geographical regions proved insufficient to draw definitive conclusions regarding the genetic attributes of Hue’s ginger.
Given the dearth of substantiating genetic evidence for Hue’s ginger, we have collected a substantial number of ginger samples and employed different molecular markers to fortify the hypothesis that Hue’s ginger genuinely possesses distinct genetic characteristics compared to other chemotypes. Initially, the search for unique markers of Hue’s ginger was conducted using the RAPD technique, renowned for its high discriminatory power in elucidating ginger’s genetic diversity (Ashraf et al., 2014; Harisaranraj et al., 2009; Ismail et al., 2016; Mia et al., 2014). Subsequently, we sequenced the matK gene, a reliable DNA barcode known for its utility in both inter- and intra-specific discrimination (Zhu et al., 2022). Our matK sequence was then compared to a publicly available ginger chloroplast genome sequence to identify single nucleotide polymorphisms (SNPs) for prospective Hue’s ginger identification.
Simultaneously, considering the pervasive mixing of ginger chemotypes in Vietnam, we aimed to extract a concise set of the most efficient RAPD markers characterized by high discriminatory power and capable of distinguishing ginger chemotypes from various regions. This would facilitate selections for cultivation, breeding, and food/pharmaceutical processing. The identification of these markers was accomplished through the application of the XGBoost (extreme gradient boosting) machine-learning algorithm possessing exceptional accuracy, speed, and efficiency in mitigation of over-fitting (M. Chen et al., 2019). Our study represents the first-time utilization of XGBoost with PCR-based marker data. Furthermore, XGBoost allowed us to identify the most important markers in sample discriminations, which is useful for PCR-based genetic diversity studies, particularly in scenarios involving a substantial number of generated markers.
. Material and methods
. Plant materials
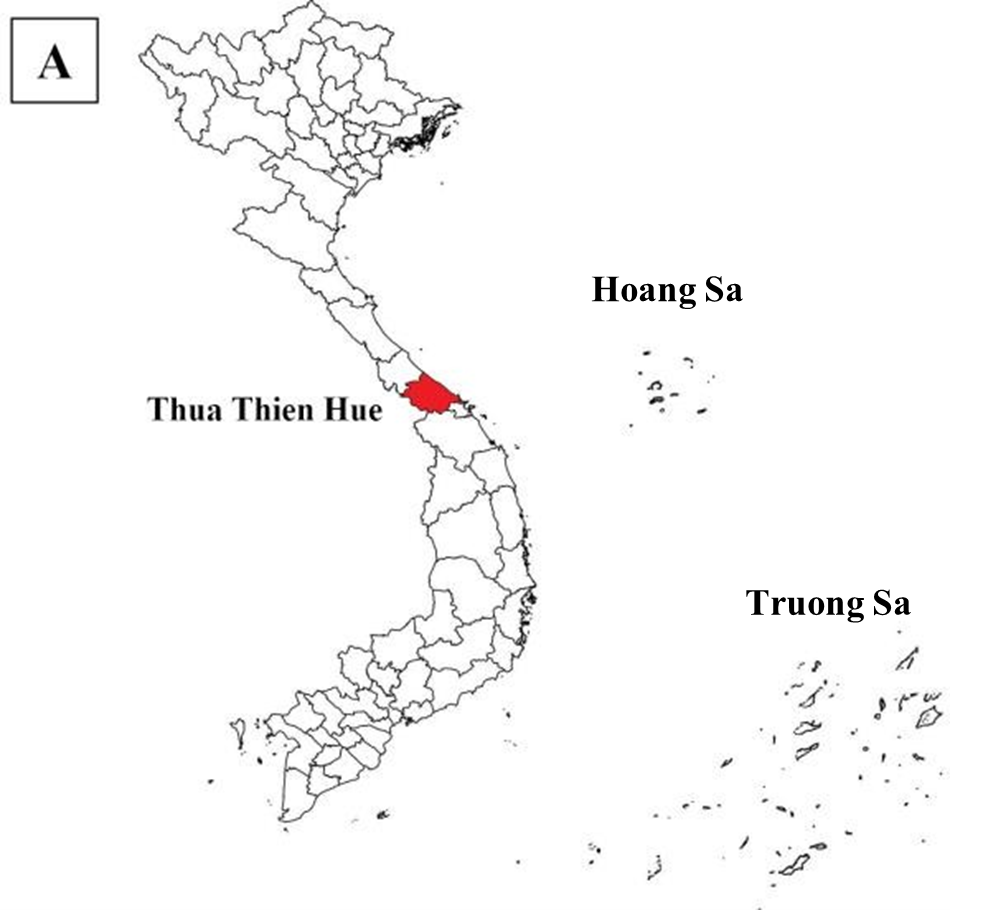
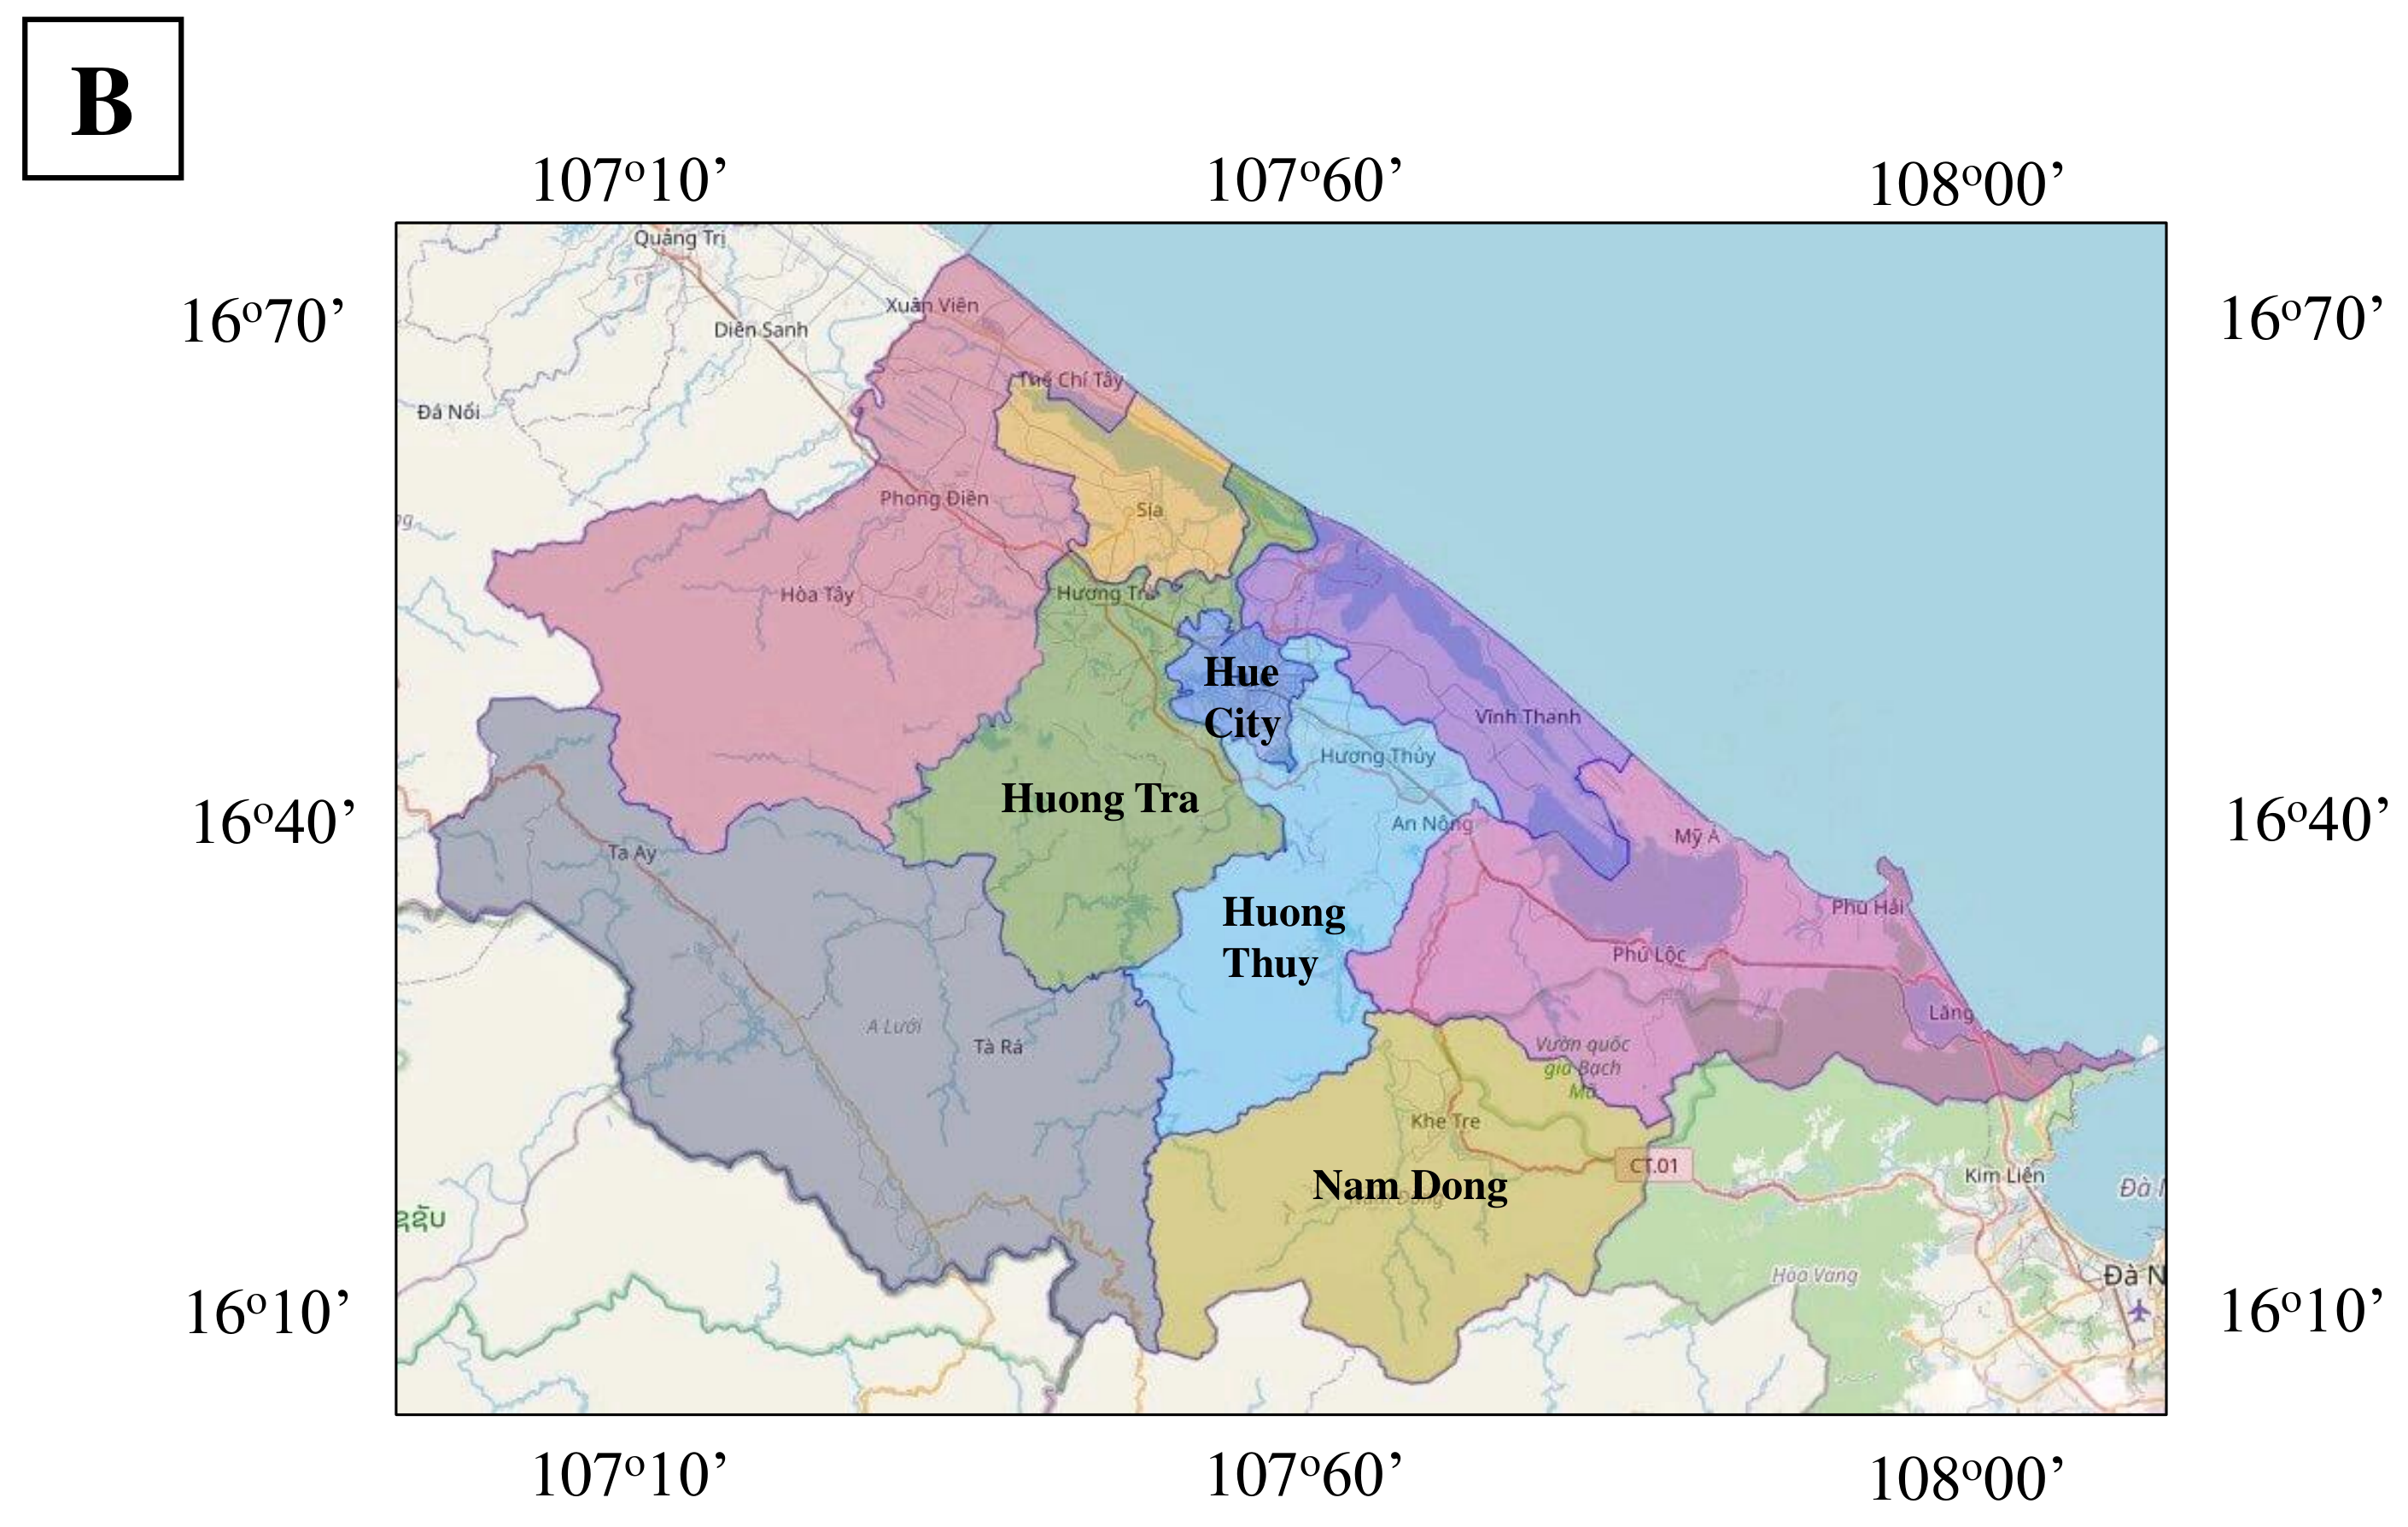
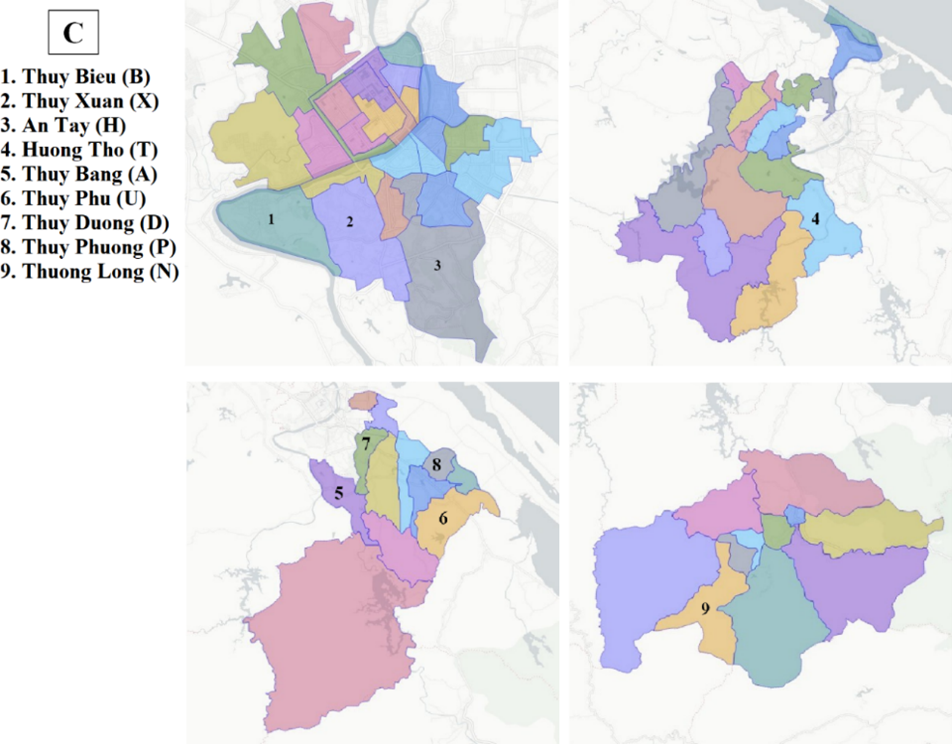
One hundred and five (105) ginger leaf samples were collected from nine different localities for the purpose of total genomic DNA extraction (see Table 1). Young ginger leaves were harvested from 2-to-5-month-old plants and subsequently stored in plastic containers at a temperature of −20 °C within the Gene Technology Laboratory at the Institute of Biotechnology, Hue University. The samples were further categorized into four distinct subpopulations, as outlined in Table 1. Notably, samples within subpopulations 1 and 3 are presumed to represent Hue’s ginger, while the remaining samples are representative of unidentified varieties sourced from various regions within Thua Thien Hue. The specific locations from which the samples were procured are depicted in Figure 1.
Table 1
Localities of Thua Thien Hue province where ginger leaves were collected.
. RAPD profiling and matK sequencing
. Total genomic DNA extraction
Genomic DNA was extracted according to the procedure proposed by Doyle and Doyle (Doyle & Doyle, 1987). The RNA in the DNA solutions was digested by 1 µL of RNase A (100 µg/µL) at the temperature of 37 °C for 30 minutes. The DNA samples were stored at 4 °C.
. Primer screening
Twenty-two primers were employed in the screening process (Table S1) to select primers that can generate high polymorphic rates. Nine representative DNA samples were amplified by each tested primer.
The total reaction volume comprised 20 µL and included the following components: random primer (20 µM), GoTaq Green Master Mix 2X (Promega, USA), genomic DNA (50 ng/µL), and nuclease-free double-distilled water (ddw).
The PCR reaction protocol involved an initial denaturation step at 95 °C for 3 minutes, followed by 42 amplification cycles (comprising denaturation at 92 °C for one minute, primer annealing at 36 °C for one minute, and primer extension at 72 °C for one minute), and a final extension step at 72 °C for 10 minutes. Subsequently, electrophoresis of the amplicons was performed on a 1.4% agarose gel supplemented with ABM’s SafeViewTM Classic dye, utilizing an applied voltage of 40 V for 70 minutes. Electrophoresis images were captured using the Ultra Slim LED Illuminator (Miulab, wavelength: 470 nm), and the lengths of the amplicons were determined through the utilization of GeneRuler 1 kb DNA Ladder (ThermoScientific, # SM0313). Primers exhibiting high polymorphic rates were chosen for RAPD analysis.
. RAPD amplification
The 105 genomic DNA samples were first diluted to a concentration of 50 ng/µL and subsequently subjected to amplification using a set of selected primers (OPA03, OPA04, OPA07, OPA09, OPB01, OPB18, OPD02, OPF04, OPN03, and OPN06). The total reaction volume, PCR reaction protocol, agarose gel electrophoresis, and amplicon visualization are described in Subsection 2.2.2.
. matK sequencing
To establish a DNA barcode for Hue’s ginger, an analysis of the matK gene sequences was carried out using two representative samples, B1 and B2. The initial step involved the isolation of the matK gene from the DNA samples through PCR, with the following reaction components: GoTaq Green Master Mix 2X (Promega, USA), 3F_Kim F primer (CGTACAGTACTTTTGTGTTTACGAG) (10 µM), 1R_Kim R primer (ACCCAGTCCATCTGGAAATCTTGGTTC) (10 µM), genomic DNA (100 ng/µL), and nuclease-free ddw.
Subsequently, PCR amplification was carried out using the following thermal program: an initial denaturation step at 95 °C for 10 minutes, followed by 30 amplification cycles (consisting of denaturation at 95 °C for one minute, annealing at 48 °C for one minute, and extension at 72 °C for one minute), and a final extension step at 72 °C for 10 minutes.
The resulting amplicons were subjected to visualization through the aforementioned electrophoresis procedure and subsequently purified using the GeneJET Gel Extraction Kit (ThermoFisher Scientific, USA) in accordance with the manufacturer’s purification protocol. The purified PCR products were then forwarded to 1st BASE (Apical Scientific Sdn Bhd, Malaysia) for Sanger sequencing.
. Data analysis
. Band scoring
PCR-RAPD products were systematically assigned numerical identifiers according to the presence or absence of bands, thereby generating a binary matrix. Concretely, bands that manifested were assigned the numerical value “1”, whereas those absent were assigned “0”. Bands that were unsighted and failed to meet the criteria for evaluation were also assigned “0”. Amplicons that were exclusive to a specific geographical region and detected in multiple samples were classified as “region-specific markers,” while PCR products observed in only one sample were designated as “unique markers”.
. Evaluation of RAPD discriminatory power and cluster analysis
To evaluate if the RAPD technique had generated significant differences among the four subpopulations (comprising 105 samples), AMOVA (analysis of molecular variance) was used, with the permutation value of 999 (p < 0.01). AMOVA was performed using GenAlEx v6.51 (Peakall & Smouse, 2006).
To observe the genetic relationships of all the samples, PCoA (principal coordinates analysis) was performed using the distance matrix generated from the initial binary matrix. PCoA was also performed using GenAlEx v6.51.
. Identification of the most powerful markers for the discrimination of the subpopulations
Of all the RAPD markers generated, an XGBoost machine-learning model was used to extract the most useful markers with the highest capacity to distinguish the subpopulations using the aforementioned binary matrix as input data. The appearance of markers in the matrix was used as features, and the subpopulation names were used as labels for model building and prediction. The method for important markers identification was based on a reported procedure with some modifications (Nguyen-Hoang et al., 2024) as follows.
The model was generated employing the XGBClassifier class sourced from the xgboost module (T. Chen & Guestrin, 2016). The model utilized the training dataset, encompassing 80% of the total input data. Data partitioning was conducted using the train_test_split() function from the sklearn module (Pedregosa et al., 2011). Model optimization was carried out through the fine-tuning of parameters, including "learning_rate", "max_depth", "min_child_weight", "gamma", and "colsample_bytree", employing the RandomizedSearchCV class from the sklearn module (Pedregosa et al., 2011). Subsequently, the optimized model was saved using the joblib.dump() function (Joblib: Computing with Python Functions., n.d.).
To evaluate the model’s efficacy in distinguishing subpopulations, the input data was divided into training and testing datasets in an 8:2 ratio, employing multiple random seeds spanning the range from 1 to 100. The optimized model was then fitted to each training dataset, and prediction was made for the corresponding testing dataset. Assessment of the model’s accuracy was carried out by means of the accuracy_score() function, available within the sklearn module (Pedregosa et al., 2011). By iteratively conducting the fitting and prediction process, a collection of accuracy scores was obtained. These scores were subsequently leveraged to compute the mean accuracy across the various times of model fitting.
For the identification of the most salient RAPD markers for subpopulation discrimination, the input data was partitioned in an 8:2 ratio, utilizing random seeds ranging from 1 to 100. The model was then fitted to these 100 training datasets. Following each fitting iteration, the command
"model_name.get_booster().get_score(importance_type=gain)"
was executed to compile lists enumerating markers alongside their respective gain scores, signifying their discriminatory potential. Subsequently, the 100 lists of markers and their gain scores were amalgamated into a comprehensive data frame. The markers exerting the greatest influence were ascertained by calculating the mean gain scores across the lists.
. Hue’s ginger DNA barcoding
The matK sequences obtained from samples B1 and B2 underwent a preprocessing step to eliminate regions characterized by low-quality base calling. Subsequently, the sequences were aligned against the reference ginger chloroplast genome (NC_044775) to identify any Single Nucleotide Polymorphisms (SNPs) present within the matK gene of these samples. These analytical procedures were executed utilizing Bioedit (v7.2.5) (Hall, 1999).
. Result
. Primer screening
Among the 22 RAPD primers assessed, 10 primers, namely OPA03, OPA04, OPA07, OPA09, OPB01, OPB18, OPD02, OPF04, OPN03, and OPN06, demonstrated a polymorphic rate of 100%. The other 12 primers exhibited low amplicon numbers and polymorphic rates (Figure S1). Therefore, these primers were not used in further analyses.
The amplicon numbers detected in the nine representative samples were consistent when the selected primers were used to amplify all 105 samples in the main analysis described in Subsection 3.2 below (Figure S2).
. RAPD profiling and identification of unique RAPD markers for Hue’s ginger
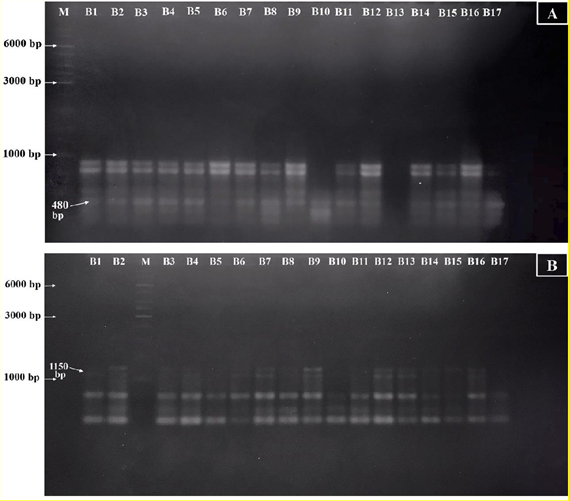
All 10 RAPD primers exhibited a 100% polymorphic rate. The number of amplified bands and their respective lengths ranged from 10 to 19 bands and 200 to 2,400 bp (see Table 2 and Figure S2). All 139 generated PCR products displayed polymorphism, with 14 unique markers and 16 region-specific markers. Notably, the OPA03 and OPB01 primers yielded the highest number of both region-specific and unique bands. Conversely, no unique bands were observed for the OPA04, OPA07, OPB18, and OPF04 primers (Table 2).
Table 2
RAPD amplifications of the 105 ginger genomic DNA samples.
Three markers specific to Hue’s ginger were identified through RAPD profiling. Specifically, two region-specific markers for ginger samples from Thuy Bieu ward (OPA03-480 and OPB01-1150) were detected in 94.12% and 52.94% of Thuy Bieu samples, respectively (see Table 2 and Figure 2). Additionally, the OPA07-1050 marker was exclusively present in samples from Huong Tho, another region of Hue’s ginger cultivation, albeit in only 40% of the Huong Tho samples (Table 2).
. Assessment of RAPD discrimination power and genetic relationship of the ginger samples
The RAPD markers demonstrated significant discriminatory power in elucidating genetic variations among the subpopulations. Specifically, AMOVA revealed that 78% and 22% of the total genetic diversity existed within and among subpopulations, respectively (p < 0.01) (Table 3).
Table 3
Analysis of the molecular variance of the four ginger subpopulations.
| Source | df | SS | MS | Percentage of total variance (%) | PhiPT | p |
|---|---|---|---|---|---|---|
| Among populations | 3 | 313.25 | 104.42 | 22 | 0.22 | 0.001** |
| Within populations | 101 | 1508.26 | 14.93 | 78 | ||
| Total | 104 | 1821.51 | 100 |
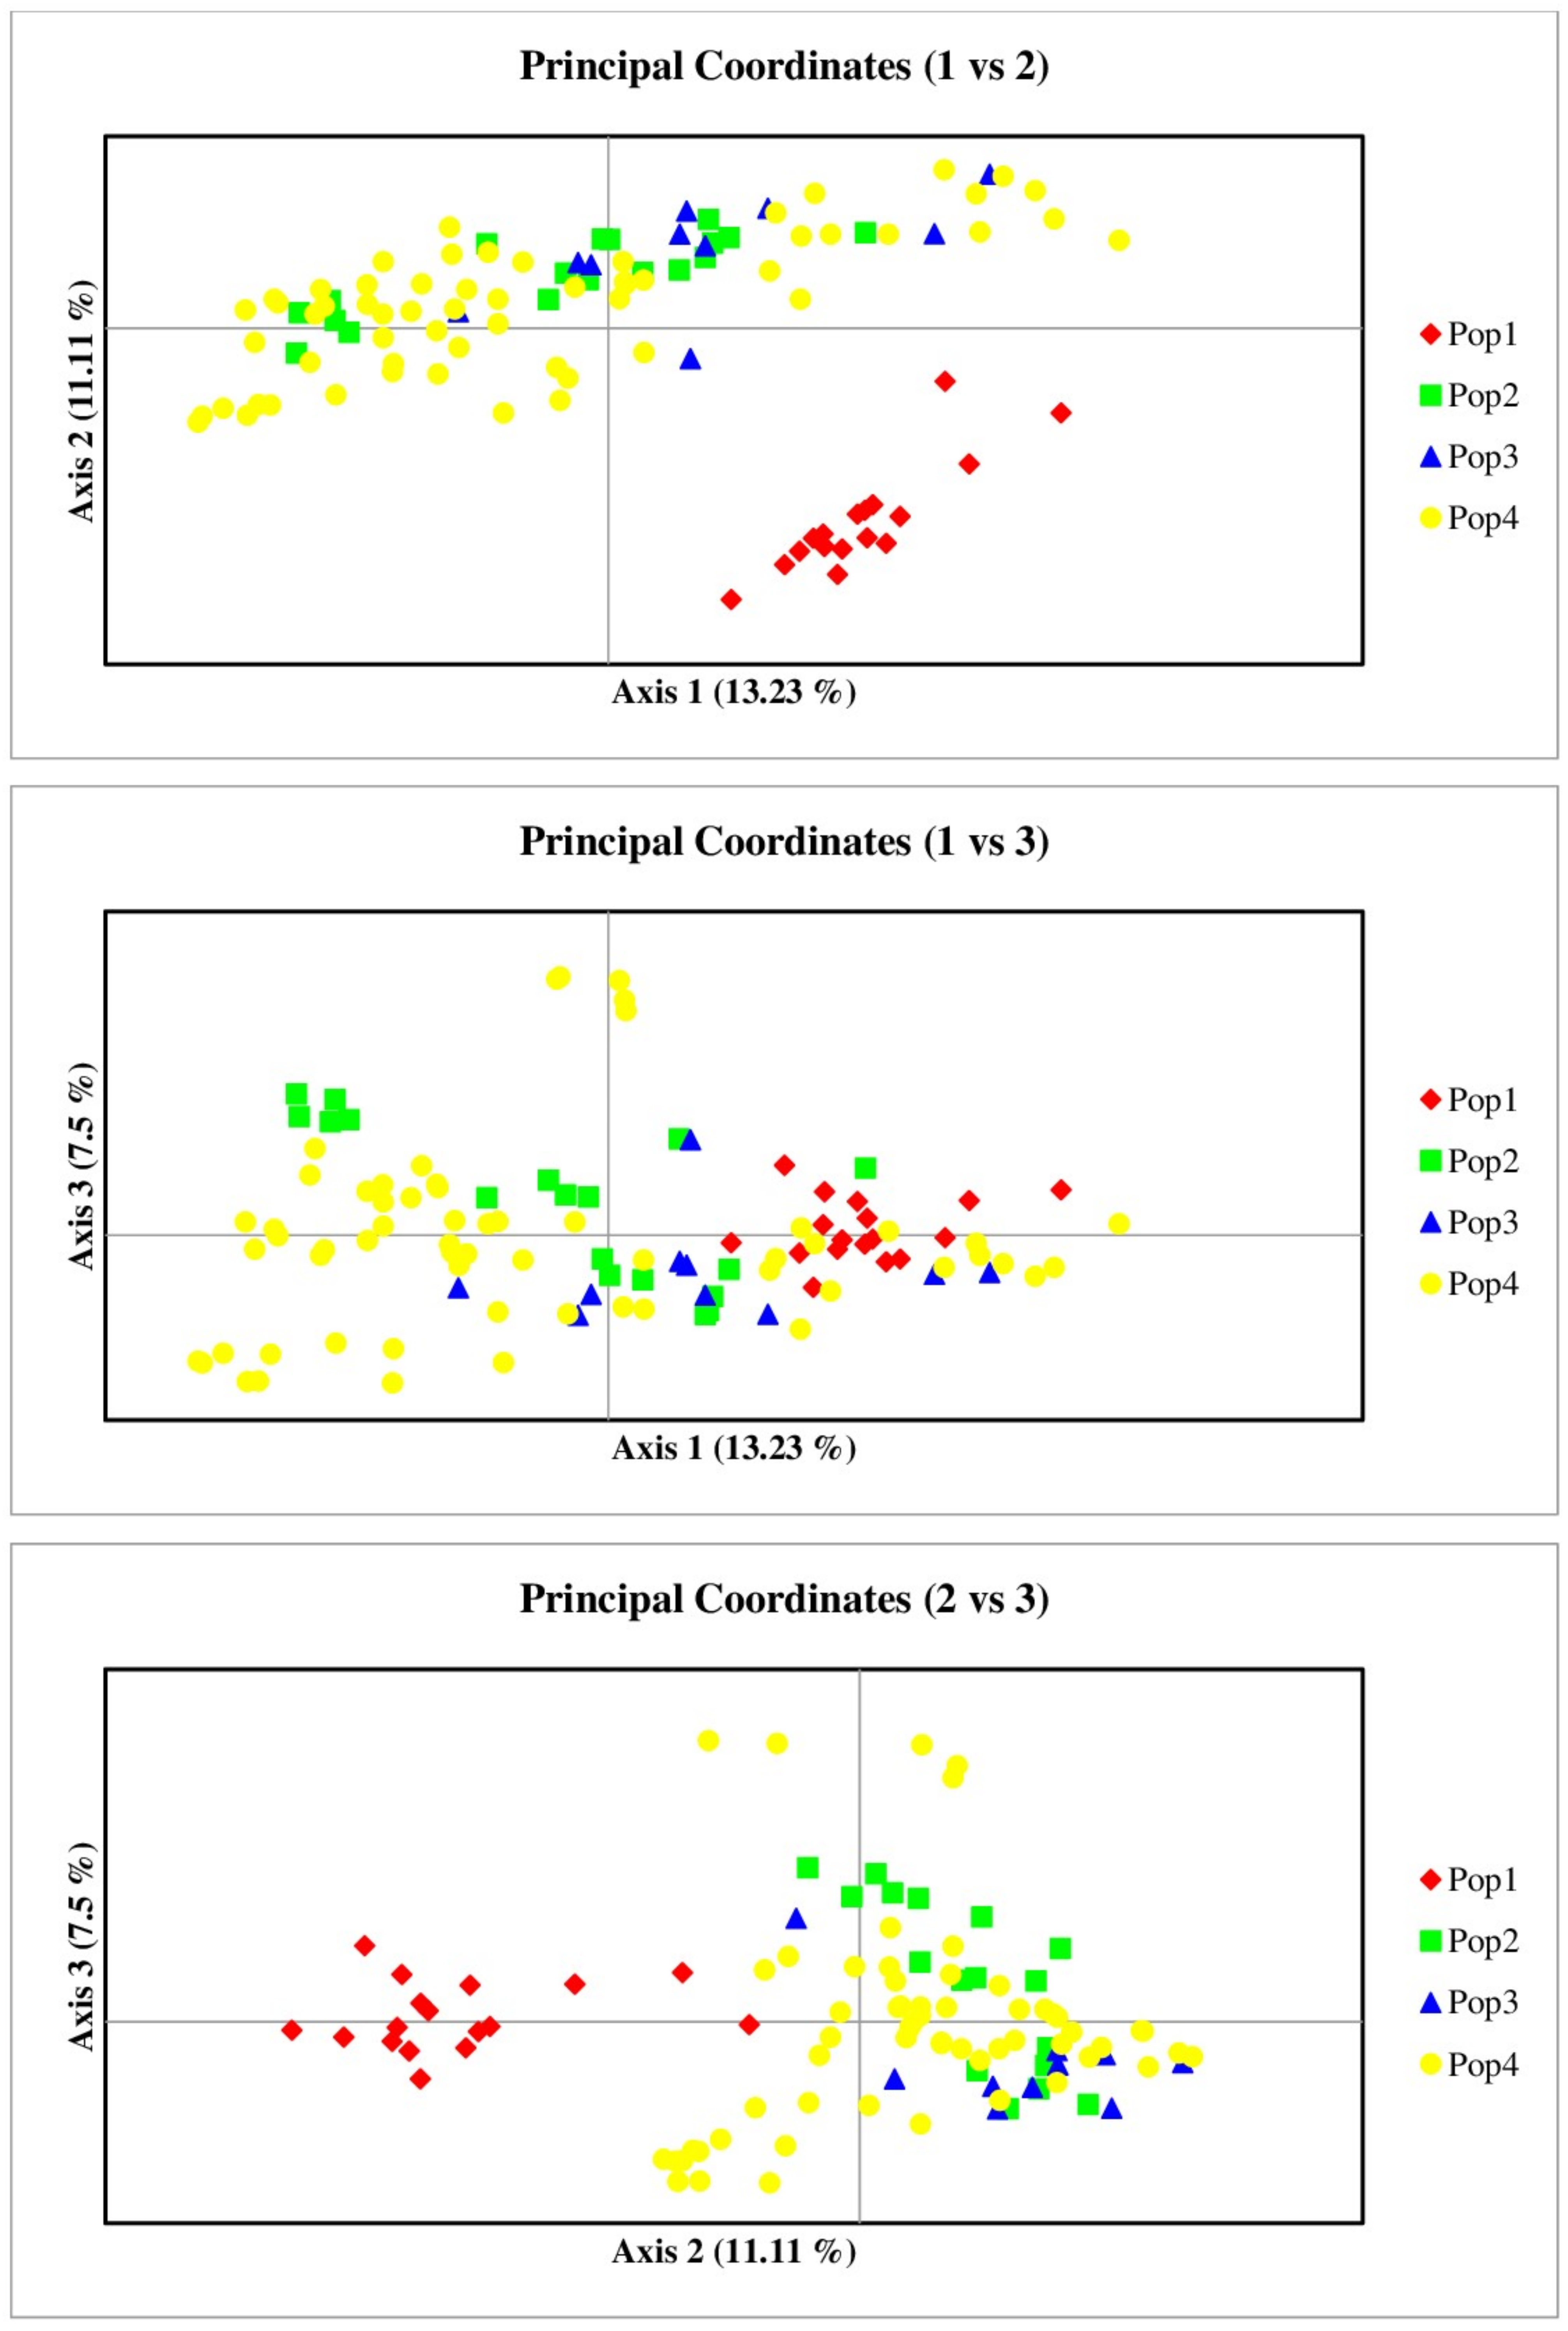
The discerning capabilities of RAPD markers resulted in the clear separation of Hue’s ginger samples from Thuy Bieu from other ginger chemotypes. Notably, 17 Hue’s ginger samples from Thuy Bieu formed a distinct cluster in the 1–2 and 2–3 PCoA plots. Conversely, the samples from Huong Tho clustered with others, indicating potential hybridization or mixing with unidentified ginger types from different regions (Figure 3).
Figure 3
Employing PCoA to delineate groupings among the ginger samples. The PCoA analysis utilizing RAPD markers resulted in the formation of two well-defined clusters. The red points denoting Hue’s ginger samples were consolidated within a single cluster, while the remaining samples constituted a separate cluster. This discernible clustering underscores the genetic distinctiveness of ginger originating from Thuy Bieu Ward (Pop1) in comparison to specimens from the other geographical regions. Axes 1, 2, and 3 represent the three principal coordinates that account for the largest proportions of sample variation.
. matK barcoding of Hue’s ginger samples from Thuy Bieu ward
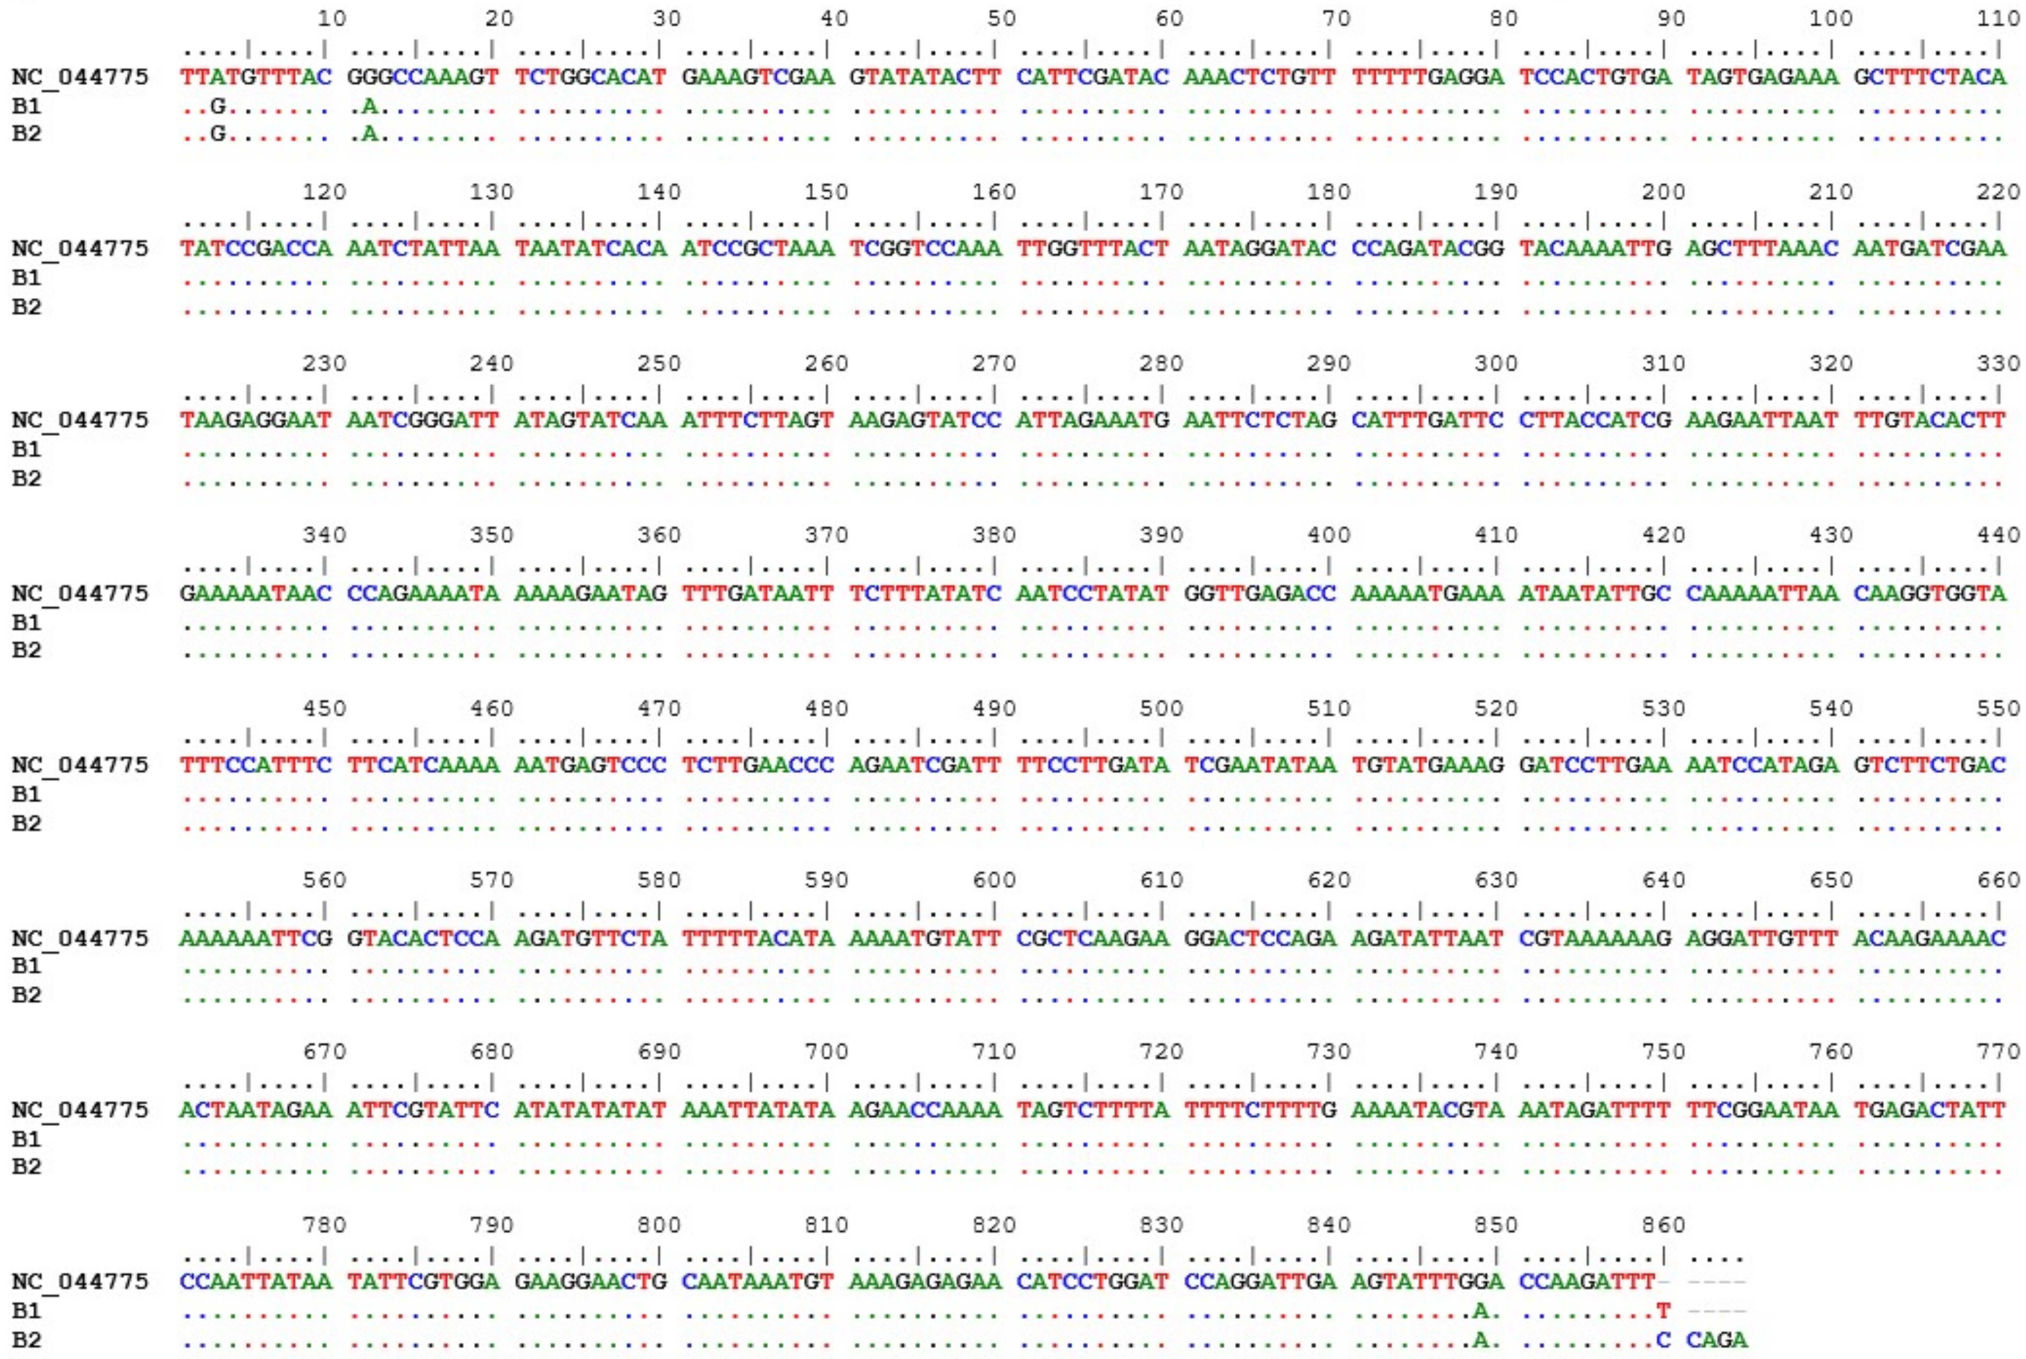
The PCR reactions for matK gene isolation were successful, yielding a single discernible amplicon within the length range of 750 to 900 bp for the B1 and B2 samples. The alignment of the ginger reference chloroplast genome with the processed matK gene sequences of the B1 and B2 samples identified three SNPs that may serve as barcodes for future Hue’s ginger identification. These substitutions are exclusively transitions, namely A to G at position 3, G to A at position 12, and G to A at position 849 (Figure 4). The matK gene sequences of Hue’s ginger samples have been deposited in the Genbank database, with accession number MZ202362 and MZ202363.
. Identification of RAPD markers with the highest discriminatory power
The application of the XGBoost model for discriminating the four subpopulations yielded a successful outcome, with a mean accuracy score of 91.63 ± 5.20%. Among all generated markers, OPN06-350, OPA03-480, OPD02-500, OPF04-950, and OPN06-300 exhibited the greatest contributions to subpopulation differentiation, with the mean gain values of 8.31, 6.80, 6.40, 4.40, and 4.20, respectively (Figure 5).
Figure 5
Assessment of marker significance in subpopulation discrimination utilizing the XGBoost model. The relative contributions of markers in delineating subpopulations are depicted through mean gain values. Among the 139 RAPD markers generated, OPN06-350, OPA03-480, OPD02-500, OPF04-950, and OPN06-300 emerge as the markers exerting the most pronounced impact on discrimination accuracy. Asterisks within the plot highlight statistically significant disparities between the mean gains of OPF04-950/OPN06-300 and OPF04-400 (p < 0.0001). All values presented in the plot are represented as means ± standard deviations.
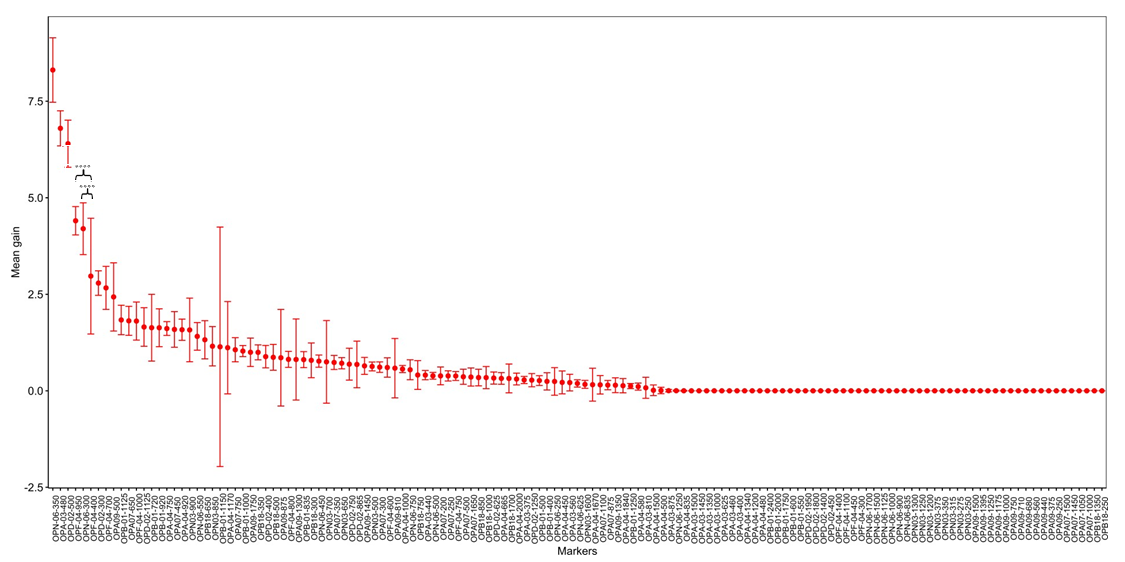
Remarkably, 39.57% (55/139) of the generated markers were identified by the XGBoost model as having no contribution to subpopulation identifications, characterized by a mean gain of zero. Notably, 93.33% (28) of the unique and region-specific markers fell within this category, as their discriminatory power was limited to individual and regional detections (refer to Figure 5).
. Discussion
In this study, we employed RAPD as our chosen method to observe genetic variations and differentiate ginger samples from various regions. This selection is based on a substantial body of evidence from previous studies, which has consistently identified RAPD as one of the most efficient marker systems for genetic diversity analysis (Ardiyani et al., 2021; Baruah et al., 2019; Blanco et al., 2016; Jatoi et al., 2006; Mohanty et al., 2014; Motlagh et al., 2023; Nayak et al., 2005; Zheng et al., 2015). However, our primer screening process revealed that not all RAPD primers could generate sufficient polymorphic marker numbers. Therefore, to maximize the possibilities of Hue’s ginger identification and discrimination of other heavily mixed ginger sub-populations, we discarded 12/22 RAPD primers with low detected polymorphisms and employed only 10 primers (showing the polymorphic rate of 100%) for subsequent analyses. The impressive polymorphic rate of 100% remained unchanged when the 10 selected primers were utilized to amplify 105 ginger samples, surpassing the rates observed by Sajeev et al. (2011) and Baruah et al. (2019) (92.66% and 84.1%, respectively). The remarkable discriminatory power of RAPD is further exemplified in our study, where the markers accounted for a substantial 22% of the genetic variation among subpopulations (Table 3), despite the fact that ginger chemotypes in Thua Thien Hue exhibit extensive mixing, and ginger cultivation predominantly relies on vegetative propagation (Zahid et al., 2021).
In addition to its robust discriminatory power, we opted for RAPD due to its capacity to yield a substantial number of amplicons, a characteristic exemplified by Baruah et al. (2019), who reported the observation of 196 bands. Our study further underscores RAPD’s suitability as a marker, as it generated a total of 139 bands, reaffirming its effectiveness. Significantly, we identified RAPD markers specific to Hue’s ginger in Thuy Bieu (OPA03-480 and OPB01-1150) and Huong Tho (OPA07-1050). These specific markers played a pivotal role in distinguishing Thuy Bieu samples from others, as evident in the PCoA plots (Figure 3). Notably, this differentiation of Thuy Bieu samples aligns with the findings reported by An et al. (2022). The presence of distinct genetic features in Thuy Bieu ginger is further substantiated by the identification of three substitution variants in the matK gene (Figure 4). Collectively, these diverse molecular pieces of evidence solidify the conclusion that Thuy Bieu represents the sole region in Thua Thien Hue where Hue’s ginger is cultivated without genetic admixture. Conversely, samples from Huong Tho have unfortunately intermingled with unidentified ginger types, rendering them indistinguishable via PCoA, with the region-specific band of Huong Tho appearing in only 40% of the samples from this region (Table 2).
The utilization of machine-learning algorithms to differentiate plant accessions through PCR-based markers remains relatively limited. To the best of our knowledge, only three studies have delved into this subject (Beiki et al., 2012; Costa et al., 2019; Vásquez et al., 2010). Most notably, single nucleotide polymorphisms (SNPs) constitute the predominant marker type employed by the majority of studies implementing machine learning in plant research. In particular, machine learning algorithms are primarily harnessed for predicting plant traits based on SNP-based genotypic data, often generated through microarray or sequencing technologies (Kang et al., 2023; Sirsat et al., 2022; Zhang et al., 2023). However, when it comes to discriminating plant accessions or predicting plant phenotypes, the utilization of SNPs for constructing machine learning models presents significant drawbacks. Notably, the microarray technology is not universally applicable across all plant species, as it necessitates pre-existing genomic information. Furthermore, sequencing entire genomes or transcriptomes for a substantial number of plant accessions incurs substantial costs (Friel et al., 2021; You et al., 2018).
Hence, for the task of distinguishing plant accessions using genotype data, cost-effective, straightforward, universally applicable, and expeditious PCR-based marker techniques like RAPD (Babu et al., 2021) offer promising alternatives to SNPs. The efficacy of PCR-based markers in machine learning model development is underscored by the high accuracy scores achieved in our study (91.63%) and by Beiki et al. (2012) (100%). Moreover, in Costa et al. (2019) work, where PCR-based markers served as input genotypic data for the construction of a deep learning model, successful discrimination between two grapevine cultivars (420-A and Kober 5BB) with identical genetic origins and similar morphological characteristics was achieved. Beyond their high predictive accuracy, our XGBoost model also identified the most pivotal markers for subpopulation classification. These essential markers have the potential to significantly facilitate future ginger classification efforts in Thua Thien Hue. Specifically, future investigations could focus solely on RAPD primers that yield the most effective markers for classification, thereby streamlining the primer selection process from a pool of numerous RAPD candidates.
. Supplementary material
The following supplementary materials are available for this article:
Figure S1. Amplifications of nine representative DNA samples by 12 unselected RAPD primers.
Figure S2. Electrophoresis of amplified DNA samples by ten selected RAPD primers.
Table S1. List of primers used for the screening process.
