. Introduction
Many environmental situations e.g., drought, saltiness, and critical temperatures cause drought stress in numerous plant species (Hassanein, et al., 2020; Saddiq et al., 2021). Soil salinity is a major agricultural problem that impacts plant growth, affecting approximately 20% of irrigated land (Okon, 2019) and causing global reduction in crop yields. High concentration of harmful salts in plant cells hinders water absorption of soluble salts in the root zone, causing osmotic stress and nutritional imbalance (Hussain et al., 2013; Shrivastava & Kumar, 2015), especially for potassium (K+) and calcium (Ca+) (Salim & Raza, 2020). Common reactions to salt stress include protein changes, antioxidant metabolism activation, and energy increase through biomolecular metabolism (Das et al., 2015; Reddy et al., 2017). Salt stress limits growth and development in sensitive species and reduces leaf area, photosynthesis, respiration rate, protein synthesis, nitrogen fixation, yield, and biomass (Atieno et al., 2017; Farooq et al., 2015; Huang et al., 2017; Javaid et al., 2019; Ologundudu et al., 2014; Zahra et al., 2018). Nevertheless, some salt-tolerant species such as Spinacia oleracea showed improved osmotic adjustment and suitability for bioactive secondary metabolite production based on salinity situation (Muchate et al., 2019). Salinity tolerance in plants is a complex feature influenced by both physiological and genetic properties (Joseph et al., 2010). Growth at the seedling stage is most susceptible to salt stress, and numerous genes impacting seedling salt tolerance have been identified (Liu et al., 2019). Molla et al. (2015) demonstrated that 200 genes may be involved in salt stress at the seedling stage. Therefore, it is interesting to investigate how salt stress affects rice growth at the early stage.
Many plant species respond to stress by adjusting their biochemical processes, such as increasing glycine betaine (Muchate et al., 2019), proline (Felipe et al., 2019), ethylene (Hussain et al., 2017), and reactive oxygen species (ROS) that affect lipid peroxidation and malondialdehyde (MDA) content. Plant oxidative stress and cell membrane damage are indicated by lipid peroxidation (Su et al., 2019). Plants growing in saline environments accumulate ions and free radicals that negatively impact their growth. As a result, stressed plants modify their survival systems by production of specific chemicals (Wang et al., 2017) as bioactive secondary metabolites for salinity adaptation (Muchate et al., 2019). Previous research revealed that the salt-tolerant rice cultivars ‘Dendang’ and ‘Fatmawati’ had higher sugar content under salinity stress than the salt-sensitive cultivar (‘Nipponbare’) (Chang et al., 2019). Sugar was a suitable solute because high sugar levels promoted osmotic adjustment, allowing the roots to absorb water into the plant cells (Acosta-Motos et al., 2017). Anatomical adaptations also occur under salinity stress, e.g. an increase in cuticle, epidermis, and leaf thickness to prevent water loss (Taratima et al., 2020), while stomatal size and density changes were recorded as significant anatomical adaptation characteristics under drought and salinity stress to reduce transpiration (Hameed et al., 2010).
Thailand is an important global rice producer, and soil salinity impacts crop yields, especially in the northeastern of the country, where 29% of the land area is classified as saline (Yuwaniyom, 2003). Selection of salt-tolerant cultivars by farmers is necessary to maximize their growth and production yields.
The ‘Hom Mali Daeng’ rice cultivar was produced from KDML105R-PSL-E-14 derived from Thai jasmine rice or KDML 105, Thailand’s most popular commercial rice variety. After several improvements, the ‘Hom Mali Daeng’ cultivar now has a remarkable red seed coat that distinguishes it from KDML105. In Thai, “Hom Mali Daeng” rice means red jasmine aromatic rice. The ‘Hom Mali Daeng’ is a photoperiod-sensitive rice cultivar that can grow all year and is resistant to brown planthopper and rice blast disease. The cooked rice has a delicate and flavorful taste, and this cultivar is also used as an ingredient in cosmetic products for the elderly (Maksup et al., 2019). The nutritional contents of ‘Home Mali Daeng’ are superior to other cultivars. This landrace has a low glycemic index (GI), which ameliorates the buildup of excessive blood sugar (glucose) levels after consumption, and is suitable for people with type II diabetes (Rice Department of Thailand, 2019). However, no previous reports have examined the growth and physiological and anatomical characteristics of ‘Hom Mali Daeng’ rice under salinity cultivation. Thus, here, the influence of salinity stress on growth, physiology, and leaf anatomy of ‘Hom Mali Daeng’ rice was investigated. The findings can be used as a model for future research in the healthcare industry and also by farmers interested in growing this rice cultivar.
. Materials and methods
. Plant materials and salinity treatment
Mature seeds of the Thai rice landrace ‘Hom Mali Daeng’ were soaked in sterile distilled water for 24 h and allowed to stand for 1 day until the radicle appeared. Germinated seeds were transferred to nursery trays and cultured in soil with everyday watering. The 14-day-old rice seedlings were transferred into pots (25 cm diameter) using the same soil, with two plants per pot. The plants were then cultured until 28 days before starting the NaCl treatment. Twenty-eight-day-old plants were used as explants in all treatments. Various NaCl solution concentrations (0, 50, 100, 150, and 200 mM) were applied instead of water at 300 ml once every other day for 14 days. Each treatment was conducted in three replicates with three pots per replicate.
. Plant growth
Treated and control plants were cultured at the Department of Biology, Faculty of Science, Khon Kaen University, Thailand from June to December 2020. Plant height, leaf number, leaf size, root number, and fresh and dry weight of the control and treated plants were recorded after culture for 14 days. Green intensity was recorded as SPAD units using a Chlorophyll Meter (Konica Minolta SPAD-502 Plus).
. Electrical conductivity (ECe)
Electrical conductivity was measured following the method proposed by Rayment and Higginson (1992). During the NaCl treatments, 3 g of soil samples were collected every second day and transferred into 15 ml deionized water before leaving the soil to settle for 24 h. Electrical conductivity was recorded using a PL-700 Series Bench Top Meter (Gondo: PL-700PC(S)).
. Electrolytic leakage (EL)
Electrolytic leakage was tested following the method developed by Dionisio-Sese and Tobita (1998). After 14 days of treatment, the plant samples were cut into small pieces (approximately 1 cm). Six pieces were transferred into a test tube with 10 ml of deionized distilled water and left in the dark for 24 h before EC1 measurement. Then, the test tubes were autoclaved at 121 oC for 20 min before EC2 measurement. Electrolytic leakage percentages were calculated as follows:
. Chlorophyll content
Total chlorophyll, chlorophyll a, and chlorophyll b content were investigated. Mature leaves (0.1 g) were pulverized in a mortar before dissolution in 5 ml of 80% acetone. This procedure was continued until the green substance was completely dissolved. The solution was filtered using filter paper. After all of the green material had dissolved, another 20 ml of 80% acetone was added. A spectrophotometer (Spectronic 20) was used to detect the supernatant by measuring absorbance at 645 and 663 nm, with 80% acetone serving as the blank. The following formulae were used to calculate chlorophyll content based on Arnon (1949).
where V = total volume of solution (ml) and W = weight of leaves (g).
. Malondialdehyde (MDA)
Malondialdehyde (MDA) was measured following the technique proposed by Sunohara and Matsumoto (2004). After NaCl treatment for 14 days, the explant samples were cut off and frozen at −80 oC. Approximately 0.1-g samples were ground with 2 ml of 0.1% (w/v) TCA (trichloroacetic acid) before centrifuging for 5 min (14,000 rpm). The supernatant (0.5 ml) was then transferred to another test tube containing 1.5 ml of 0.5% (w/v) TBA (thiobarbituric acid) before heating at 95 °C for 25 min. All reactions were stopped by freezing on ice for 10 min. The absorbance of the solutions was investigated at wavelengths of 532 nm (A532) and 600 nm (A600); 20% TCA was used as the blank. MDA was calculated as follows:
where FW = fresh weight.
. Leaf anatomical analysis
After 14 days of treatment, mature leaves were collected from the control (non-treated plants) and all treated plants. The leaves were cut into 10 cm lengths at the center of the leaf blade before fixing in FAA70 fixative (70% ethyl alcohol, acetic acid, formaldehyde; 90:5:5). After fixing, 3 leaf portions (leaf margin, midrib, and lamina) were selected and dissected into small pieces before soaking in 15% (v/v) Clorox (sodium hypochlorite) for 20 min and then peeling. Both the abaxial and adaxial epidermis were stained using 1% (w/v) Safranin O in ethyl alcohol before soaking in sequential ethyl alcohol, xylene-absolute ethanol, and xylene before mounting by DePeX. Epidermal cell size as well as stomatal density and size were investigated using a light compound microscope. The leaf blades were freehand transverse-sectioned before staining by Safranin O. The stained samples were dehydrated in successive series of ethyl alcohol followed by xylene-absolute ethanol and xylene before DePeX-mounting. A light compound microscope (Olympus CH 30) and a Zeiss Primo Star with the MB2004 configuration AxioVision application were used to explore anatomical aspects. Twenty-one anatomical features were studied based on Nawazish et al. (2006), Taratima et al. (2019), and Zhang et al. (2015).
. Statistics and correlation analysis
In each treatment, a completely randomized design (CRD) was used, including at least three replicates. Statistical analysis was performed using one-way analysis of variance (One-way ANOVA), while comparative analysis of mean values was carried out using the post hoc test (Duncan’s test) at a 95% confidence level.
To investigate growth performance links based on Searle (1961) and Singh et al. (2018), correlation coefficients between pairs of growth and physiological and anatomical features were calculated at the phenotypic level as in the Equation below.
where cov.XY(p) is the phenotypic covariance between characteristics X and Y, and var.X(p) and var.Y(p) are the variances in the phenotypic levels of characteristics X and Y, respectively. The data were examined using the SPSS program.
. Results
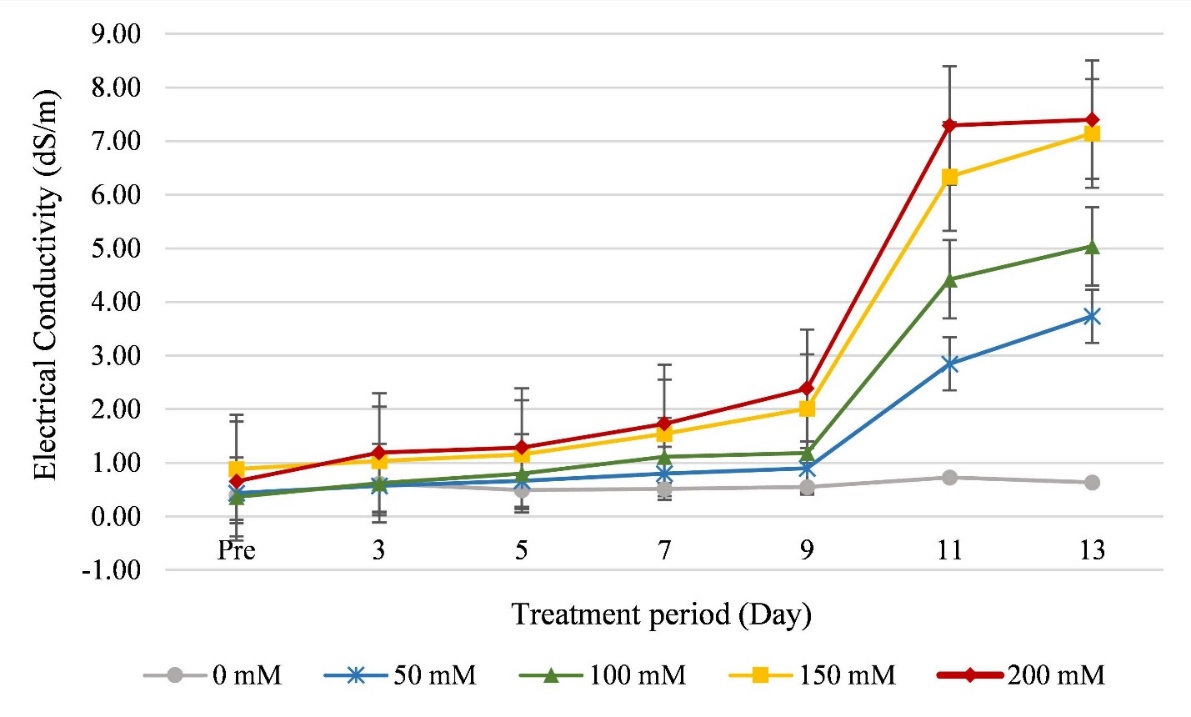
After 14 days, the leaf width and plant height of the NaCl treated plants decreased, compared to the control group, although with no significant difference (p < 0.05, Table 1). The leaf number per clump and the root diameter of the treated plants were significantly lower than in the control (Table 1). Root lengths in the 100 mM NaCl treatment and the control were not significantly different but were significantly shorter in the other treatments. Both fresh and dry biomass weights in the 50 and 100 mM NaCl treatments did not differ significantly from the control. The green intensity (SPAD unit) and chlorophyll content in all treatments were not significantly different, while the electrolyte leakage percentage and malondialdehyde (MDA) contents in the 150 and 200 mM NaCl treatments were higher and significantly different from the control and the other treatments. Soil electrical conductivity (EC) increased after the NaCl treatments (Figure 1). The EC value increased, especially from 9 days of treatment. After 13 days of treatment, the highest EC (7.40 dS/m) was measured from the 200 mM NaCl treatment, while the lowest EC (0.63 dS/m) was recorded in the control group (Figure 1).
Table 1
Growth measurements and physiological characteristics of rice after NaCl treatment for 14 days.
Leaf anatomical characteristics of the control and treated plant were also studied. The results indicated that the leaf thickness decreased after the NaCl treatment (Table 2, Figure 2A1,B1,C1,D1,E1), while the bulliform cell number (Table 2, Figure 2A3,B3,C3,D3,E3), stomatal width, and stomatal density on the abaxial side (Figure 2A4,B4,C4,D4,E4) increased (Table 2). The cuticle and cell wall thickness of the adaxial midrib decreased, while the cuticle and cell wall thickness of the adaxial lamina increased. The vertical length of the midrib vascular bundle in the NaCl treatments decreased, while the horizontal length showed no clear differences, except for the 100 mM NaCl treatment, where the vascular bundle size was significantly lower than in the other treatments, including the control group (Table 2, Figure 2A2,B2,C2,D2,E2). The vessel and phloem surface areas in all NaCl treatments were higher than in the control group.
Figure 2
Leaf anatomical characteristics of the control and treated plants. (A) control; (B) 50 mM NaCl; (C) 100 mM NaCl; (D) 150 mM NaCl; (E) 200 mM NaCl; 1 - leaf blade anatomy; 2 - major vascular bundle at the midrib; 3 - bulliform cells (arrow); 4 - abaxial epidermal cell and stomata.
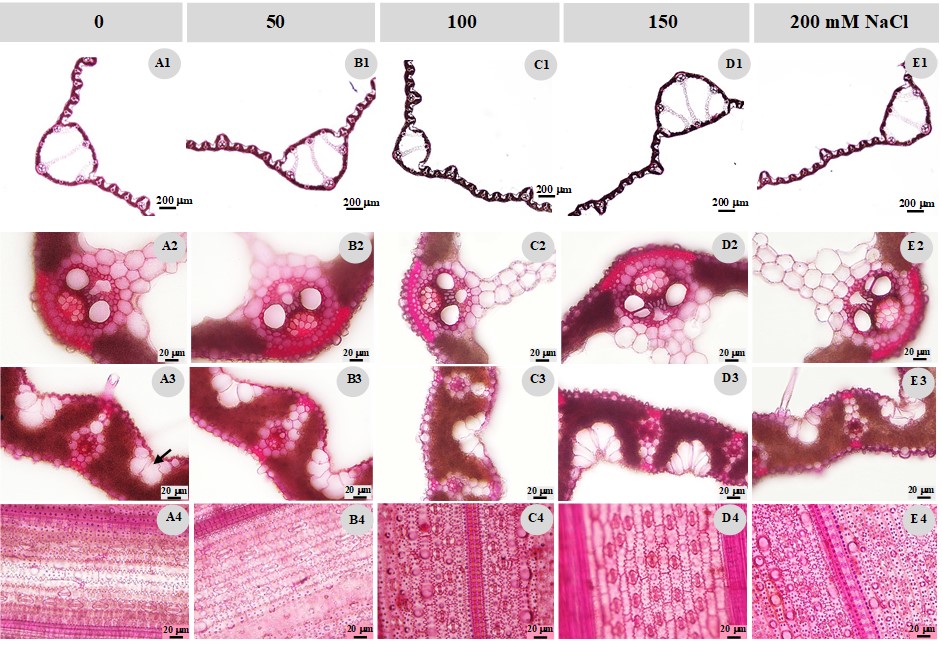
Table 2
Leaf anatomical characteristics of ‘Hom Mali Daeng’ rice after NaCl treatment for 14 days.
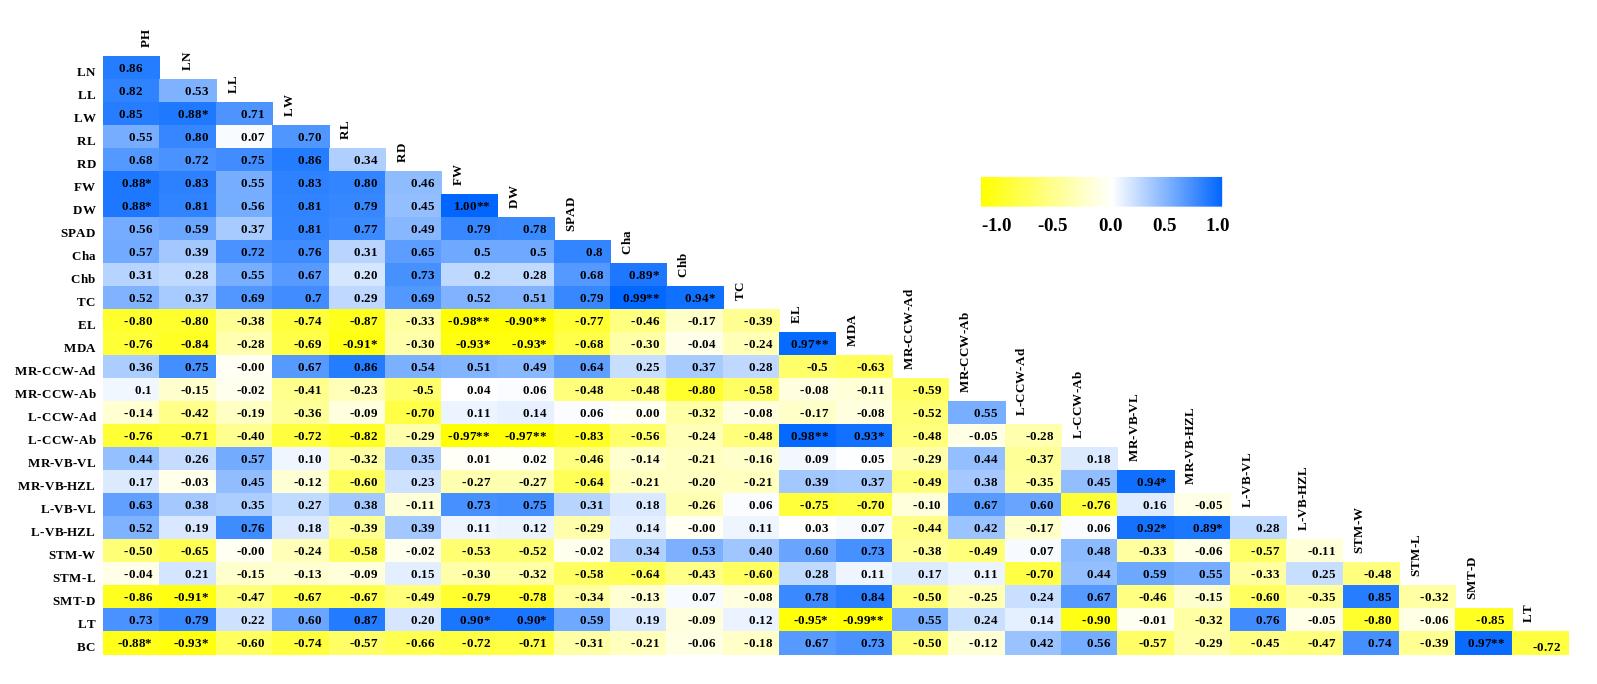
Twenty-seven physiological and anatomical characters were considered for approximation of the phenotypic correlation coefficients (Figure 3). Almost all growth and physiological features (plant height (PH), leaf number (LN), leaf length (LL), leaf width (LW), root length (RL), root diameter (RD), fresh weight (FW), dry weight (DW), SPAD unit, chlorophyll a (Cha), chlorophyll b (Chb), and total chlorophyll (TC)) showed a positive correlation with each other, except for the EL and MDA content. Nearly all anatomical characteristics exhibited negative correlations with the growth and physiological characters. However, some anatomical characteristics showed a positive correlation with such growth features as midrib-cuticle and cell wall of adaxial side (MR-CCW-ad), midrib-vascular bundle (MR-VB) size, lamina-vascular bundle (L-VB) size, and leaf thickness (LT). The leaf thickness exhibited a positive correlation with numerous growth characteristics, including plant height (PH), leaf number (LN), leaf length (LL), leaf width (LW), root length (RL), root diameter (RD), fresh weight (FW), dry weight (DW), SPAD unit (SPAD), chlorophyll a (Cha), and total chlorophyll (TC) (Figure 3).
Figure 3
Heat maps describing the approximation of the phenotypic correlation coefficients of some physiological and anatomical features in Hom Mali Daeng rice after NaCl treatment for 14 days.
* Significant correlation at p < 0.05, ** Significant correlation at p < 0.001. (PH = plant height; LN = leaf number; LL = leaf length; LW = leaf width; RL = root length; RD = root diameter; FW = fresh weight; DW = dry weight; SPAD = SPAD unit; Cha = chlorophyll a; Chb = chlorophyll b; TC = total chlorophyll; EL = electrolyte leakage percentage; MDA = malondialdehyde content; MR-CCW-Ad = midrib -cuticle and cell wall of adaxial side; MR-CCW-Ab = midrib -cuticle and cell wall of abaxial side; L-CCW-Ad = lamina -cuticle and cell wall of adaxial side; L-CCW-Ab = lamina -cuticle and cell wall of abaxial side; MR-VB-VL = midrib-vascular bundle size-vertical length; MR-VB-HZL = midrib-vascular bundle size-horizontal length; L-VB-VL = lamina-vascular bundle size-vertical length; L-VB-HZL = lamina-vascular bundle size-horizontal length; STM-W = stomatal width; STM-L = stomatal length; STM-D = stomatal density; LT = leaf thickness; BC = bulliform cell number.
. Discussion
The high salinity stress impacted plant growth. Under the 50 and 100 mM NaCl treatments, ‘Hom Mali Daeng’ rice exhibited normal growth similar to the control group, especially during the early treatment period. After 14 days, parameters measured for the 50 and 100 mM treatments were not significantly different from those in the control group. This finding was similar to that reported by Saengsanga et al. (2018), who found that salinity at not more than 3 dS/m did not harm rice seedlings. A salinity level of 50 mM NaCl equates to 3.73 dS/m and is considered low (2–4 dS/m). The 100, 150, and 200 mM NaCl treatments exhibited moderate salinity levels (4–8 dS/m) (FAO, 1976), and impacted the growth of ‘Hom Mali Daeng’ rice, especially at 150 and 200 mM. Sodium chloride stress at 100 mM reduced fresh and dry weights by 21.01% and 19.32%, respectively, while the 150 and 200 mM treatments reduced biomass by more than 80%. The growth reduction was caused by ion toxicity or oxidative stress, low osmotic potential, stress damage, and cell wall extensibility limitation (Wang et al., 2017). The addition of the sodium chloride solution changed the electrical conductivity of the soil, while some microorganisms, such as Bacillus sp., were found in the soil for nutrient balancing (Shilev, 2020).
The growth and physiological traits of ‘Hom Mali Daeng’ rice seedlings were not affected by the NaCl treatment in the first week, but changes were observed during the second week. Previous reports suggested that plant response to salinity could be separated into two stages: an ion-independent growth decrease phase and the formation of cytotoxic ion phase (Isayenkov & Maathuis, 2019). The first phase inhibited stomatal closure and cell expansion caused by the ion-independent growth decrease that can occur within minutes and last for several days (Rajendran et al., 2009), while the second phase of cytotoxic ion accumulation takes days or weeks, slowing metabolic activities and inducing early aging and, eventually, cell death (Roy et al., 2014). A variety of physiological and molecular mechanisms govern tolerance to both forms of stress such as ionic tolerance, osmotic tolerance, and tissue tolerance (Isayenkov & Maathuis, 2019; Rajendran et al., 2009; Roy et al., 2014).
In this study, the NaCl treatment reduced plant height, leaf number, root size, and biomass, while green intensity and chlorophyll content were not significantly different from the control group. Salinity tolerance varies among the developmental stages of germplasms within each rice variety (Zhang et al., 2021). Reddy et al. (2017) found that the rice seedling stage is highly saline-sensitive, while Singhal et al. (2017) revealed that the seeding stage was an adaptative period when the rice built up salinity tolerance.
The results showed that the MDA content and the electrolytic permeability of the NaCl solution were not significantly different in plants treated with 50 and 100 mM NaCl, compared to the control group, but increased in the 150 and 200 mM NaCl-treated plants. Therefore, the ‘Hom Mali Daeng’ rice plants were not greatly impacted by the low NaCl concentrations but displayed negative effects in the more highly saline environments. After plant cell and tissue damage, the lipid at the membrane is peroxidized and MDA is produced (Grintzalis et al., 2013). Increased MDA levels and electrolyte leakage then stimulate NADPH oxidase activity, generating reactive oxygen species (ROS) (Tian et al., 2016; Yamane et al., 2009). Plants adapt by developing antioxidant defense systems against ROS toxicity. These include various enzymes, e.g., ascorbate peroxidases (APX), superoxide dismutase (SOD), catalase (CAT), and guaiacol peroxidase (POD), to effectually decrease ROS and protect plant cells during salinity situations (Blokhina et al., 2003).
The anatomical studies indicated that midrib vascular bundle size and leaf thickness decreased, while lamina cuticle, cell wall thickness, and bulliform cell number increased after the NaCl treatment. The EL and MDA content showed a positive correlation with lamina-cuticle and cell wall of abaxial side (L-CCW-Ab), midrib-vascular bundle size-vertical length (MR-VB-VL), midrib-vascular bundle size-horizontal length (MR-VB-HZL), stomatal width (STM-W), stomatal length (STM-L), stomatal density (STM-D), and bulliform cell number (BC). This result indicated that ‘Hom Mali Daeng’ rice showed anatomical adaptation by an increase in cuticle thickness, vascular bundle size, and stomatal size and density. This result concurred with previous results of soybean research, where plants treated with higher NaCl concentrations had thicker cuticles than those treated with lower NaCl concentrations (Dolatabadian et al., 2011). One of the most crucial ways to reduce water loss in plant cells is by thickening the cuticle layer. Stressful and salty conditions cause plant cells to lose water, resulting in wilting and eventual death (Kosma & Jenks, 2007; Samuels et al., 2008). Cell wall integrity is also a crucial aspect of salt stress resistance and plant development (Feng et al., 2018; Zhao et al., 2020).
An increase in the bulliform cell number has a beneficial effect on reducing water deficit in plants (Ngernmuen, 2013). Under drought stress, bulliform or motor cells lose their turgor and constrict, causing the lamina to fold or roll inward from edge to edge (Dickison, 2000; Grigore & Toma, 2010). The surface area of vessels and phloem in transverse section decreased at the midrib vascular bundle but increased at the lamina vascular bundle. This reduced the number of air bubbles, resulting in a more efficient transportation system (Ngernmuen, 2013). Reducing the vascular bundle limits plant water uptake (Hampson & Simpson, 1990). Reduced vascular tissue also decreases Na+ and Cl− absorption, especially under salt stress.
Plants react in similar ways to water deficits induced by salinity and drought stress. The anatomical adaptations determined in this study concurred with previous reports of increases in the cuticle and cell wall thickness of the lamina to maintain water balance within the plant body (Taratima et al., 2020) and increases in stomatal density to reduce water loss (Akram et al., 2002). However, further research is required to elucidate how the physiological and anatomical profiles of the ‘Hom Mali Daeng’ rice plant adapt to respond to salt stress at different growth stages.
. Conclusions
Soil salinity affected the physiological characteristics of ‘Hom Mali Daeng’ rice at an early growth stage, especially at concentrations higher than 100 mM NaCl. The electrolyte leakage percentage and MDA content revealed nutrient imbalance, resulting in inhibited growth and differentiation in ‘Hom Mali Daeng’ rice plants. At low and moderate NaCl concentrations (50 and 100 mM NaCl), the ‘Hom Mali Daeng’ rice plants were able to withstand salinity stress, while the high NaCl concentrations (150 and 200 mM NaCl) impacted their growth. The anatomical adaptations of ‘Hom Mali Daeng’ rice under salinity stress occurred mainly to reduce water loss.
