. Introduction
One of the most advanced technologies of science is nanotechnology. The importance of nanotechnology is seen in many applications, such as drug delivery, biomedical, electronics, biosensor, plastic, and textile use (Anjum & Abbasi, 2016; Milewska-Hendel et al., 2016). In addition, it is possible to increase the quality and efficiency of designed products with nanobiotechnology. Nanobiotechnology will increase the potential of economic production by making sensitive and rapid applications that positively affect the diagnosis and treatment of diseases. As the knowledge on cell and intracellular communication increase, the scientific world can reach a higher level very quickly by means of the improving nanotechnological methods.
Nanobiotechnology focuses on the biosynthesis, characterization, and application of nanomaterials smaller than 100 nm. This study focused on silver nanoparticles (AgNPs). AgNPs are currently used in the textile industry, food packaging, and wastewater treatment, but are most commonly used in biomedical applications (An et al., 2020; Salem & Fouda, 2021). For instance, AgNPs can be applied in biosensing, imaging, and drug delivery. However, they are cytotoxic and are used as antimicrobial, anticancer, anti-inflammatory agents (Gonzalez et al., 2017) or in wound care applications (Aziz et al., 2014; Kumar & Kathireswari, 2016; Singh et al., 2016; Tian et al., 2018; Xia et al., 2016). The current attention has focused on the antiviral activity of AgNPs because of the COVID-19 pandemic (Allawadhi et al., 2021; Jeremiah et al., 2020).
Recently, various synthesis methods have been developed to upgrade fields of science in which AgNPs can be used. One of these methods is the synthesis of AgNPs via plants. Today, the use of the green chemistry method of synthesis has removed the limitations of traditional synthesis techniques, such as physical and chemical methods, and has been developed as an alternative synthesis approach. Generally, the bioreduction mechanism occurs in three stages: (1) silver ion reduction and nucleation, (2) growth stage and aggregation, and (3) capping and stabilization in the final stage (Melkamu & Bitew, 2021). Bioactive compounds [primary (proteins, amino acids) or secondary metabolites (alkaloids, phenolics, terpenoids, ketones, vitamins)] contained in plant extracts play a role as reducing and sealing agents in the synthesis of AgNPs and shorten the AgNP synthesis time (Mukherjee et al., 2014; Sharifi-Rad et al., 2020).
Various plant extracts with the ion reduction ability and low production costs are used for the biosynthesis of AgNPs. Natural tetraploid Trifolium pratense L. grows widely in the Eastern Anatolia Region and the Black Sea Region in Turkey (Elçi, 1982). The natural tetraploid T. pratense L. (red clover) chromosome number is 2n = 4x = 28 (Buyukkartal & Colgecen, 2007). The natural tetraploid T. pratense L. variety contains more secondary metabolites than the diploid variety of the plant (Çölgeçen et al., 2014; Khaosaad et al., 2008). Its phytoestrogenic activity is very high mostly due to its content of isoflavones, which can act as estrogen agonists or antagonists, depending on the compound and its content in the body (Dog, 2005). Plant antioxidant phenolic compounds (lignins and flavonoids), signaling compounds, and tannins can serve as defensive response chemicals. The research area related to the use of natural tetraploid T. pratense L. herb extract as a biosource for the biosynthesis of AgNPs has not been widely investigated in the past. The reasons behind choosing the natural tetraploid T. pratense L. herb extract as a reducing and stabilizing agent are its richness of essential phytochemicals and its medicinal effects. In this study, we focused on the synthesis, characterization, and biological activity of AgNPs through the use of the natural tetraploid T. pratenseL. containing structural polymers, phenolic compounds, and glycosidic bioactive macromolecules.
. Material and methods
. Preparation of plant extracts
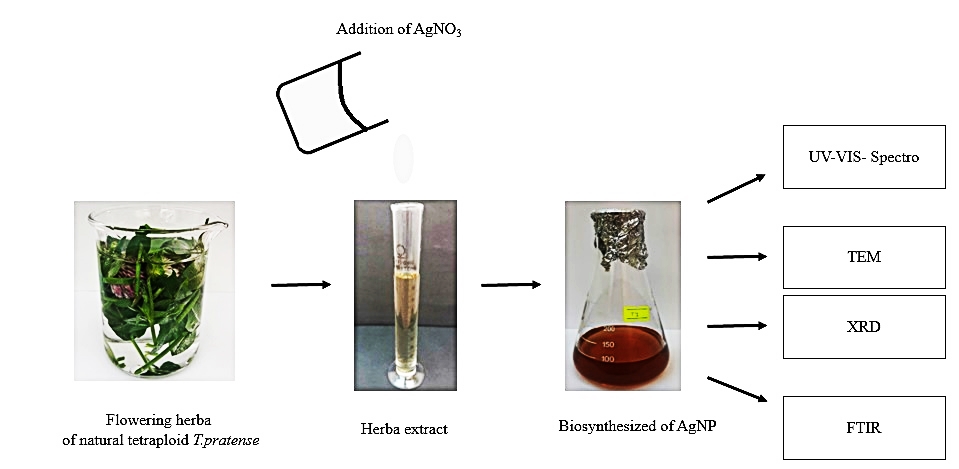
Flowering herb of natural tetraploid T. pratense L. grown in the experimental garden of Zonguldak Bülent Ecevit University, Biology Department (41.45124°N, 31.76037°W), was collected in May and used for the biosynthesis of AgNPs. The herb of the plant was freshly collected from the experimental garden, weighed to 10 g, and cut into small pieces. The samples were thoroughly rinsed 3 times under tap water and then 3 times with distilled water. The pure samples were placed in a 250 ml Erlenmeyer flask after adding 100 ml of sterile distilled water. They were shaken at 80 °C in a water bath at 180 rpm for 1 hour (Anjum & Abbasi, 2016; Netala et al., 2015; Xia et al., 2016). When the temperature reached 24 °C, the extracts were filtered through a Whatman No. 1 filter paper for the biosynthesis of AgNPs. Then, the volume of the filtrate was completed to 100 ml with distilled water (Figure 1). The extract was stored at +4 ± 1 °C in the dark for further studies.
. Biosynthesis of silver nanoparticles
10 mL of the natural tetraploid T. pratense L. extract was taken from stock extract and mixed with different concentrations (0.16, 0.5, 0.84, 1.18, 1.52, and 1.96 mg/ml) of 1 mM freshly prepared silver nitrate aqueous solution (AgNO3) for the biosynthesis of AgNPs.
This reaction mixture was incubated at 24 °C under daylight. The reaction mixture was allowed to stand for 6, 12, 24 hours for the reduction of silver ions. A color change from light yellow to red was observed in the reaction mixture after the incubation period.
To confirm the biosynthesis of AgNPs, 10 ml of the natural tetraploid T. pratense L. extract was added to 1.96 mg/ml AgNO3 (Fluka) aqueous solution at different temperatures (40, 50, 60, 70, 80, 90, 100 °C) and in different pH ranges (5, 7, 10) (Anjum & Abbasi, 2016; Nabikhan et al., 2010; Xia et al., 2016). This yielded a red-brown solution, thus confirming the formation of AgNPs. A suitable control was set up with the experiment.
. Characterization of silver nanoparticles
The UV–Visible spectroscopy analysis was performed with a UV–Visible absorption spectrophotometer (Tetra T80+UV/VIS Spectrophotometer PG) to determine the formation of biosynthesized AgNPs. After mixing the plant extract with AgNO3, the formation of AgNPs was first visually observed and confirmed by color change. The absorbance measurement in the range of 200–800 nm was recorded to distinguish the maximum surface plasmon of AgNPs. The analyses were carried out with the use of quartz cuvettes. Distilled water was applied to zeroize the spectrophotometer and also served as a blank (Öztürk Küp et al., 2020).
Perkin Elmer 400 FTIR/FTFIR Spectrometer Spotlight 400 was used for Fourier Transform Infrared Spectroscopy (FTIR) spectroscopy. According to ATR, the wavelength was measured at a resolution of 4 cm−1 in the range from 400 to 4000 cm−1. The functional groups found in the natural tetraploid T. pratense L. aqueous extract, which have essential roles in the biosynthesis of AgNPs, were analyzed using FTIR. Biosynthesized AgNPs were centrifuged at 12.000 rpm for 10 min. The pellets were washed three times with distilled water to remove all unconverted Ag(I) ions and plant extract residues. Afterward, the samples were dried at 60 °C for 48 hours (Sharifi-Rad et al., 2020).
Phase formation, purity, and crystal structure of biosynthesized AgNPs were determined using X-ray Diffraction (XRD) spectrometry (Panalytical Empyrean). Respective diffractograms of dried AgNPs were acquired in the 2θ range from 20° to 80° using Cu/Kα radiation (λ = 1.54 Å). A scan speed of 0.1°/min, a voltage of 45 kV, tube current of 40 mA, and a step size of 0.02° were used (Öztürk Küp et al., 2020). Biosynthesized AgNPs were centrifuged at 25.000 rpm for 7 min. The pellets were washed three times with distilled water to remove all unconverted Ag(I) ions and plant extract residues. Then, the samples were dried at 24 °C for two days.
The shape and size distribution of AgNPs was determined with TEM (Hitachi HT7800) analysis operated at an accelerating voltage of 120 kV. Biosynthesized AgNPs were centrifuged at 12.000 rpm for 10 min. The pellets were washed three times with distilled water to remove all unconverted Ag(I) ions and plant extract residues. Finally, the pellets were sonicated in distilled water for 5 min and filtered through 0.22 µm filter paper. 3 µl of the sample was dropped onto the carbon-coated grid. All samples were dried at 24 °C for 15 min.
The FTIR and XRD analyses were carried out at the Science and Technology Application and Research Center (ARTMER), Zonguldak Bulent Ecevit University, Zonguldak. The TEM analyses were carried out at the Application and Research Center (ARUM), Eskişehir Osmangazi University Eskişehir.
. In vitro 2,2-diphenyl-1-picrylhydrazyl (DPPH) antioxidant assay
The DPPH free radical scavenging activities of the samples were studied after introducing some modifications to the Sanchez-Moreno method (Wang & Lee, 1996). The radical scavenging activity of AgNPs was evaluated against 2,2-diphenyl-1-picrylhydrazil (DPPH). Different amounts (25, 50, 100, and 200 µl) of aqueous biosynthesized AgNPs were prepared and added to a vial. Then, 2 ml of a freshly prepared ethanolic solution of DPPH solution was added to each vial (Fierascu et al., 2014; Szydłowska-Czerniak et al., 2012). The vials were incubated in the dark for approximately 30 min. During this time, the mixing solution color changed from violet to yellow. The experiments were repeated 3 times with the use of a UV-Spectrophotometer at 1-min intervals at 517 nm absorbance. A butylated hydroxyanisole (BHA) solution was used as a standard. A Tetra Brand T80+UV/VIS Spectrometer PG Instruments Model was used to determine DPPH free radical scavenging activity.
Free radical scavenging activity was calculated using the following equation (Ellnain-Wojtaszek et al., 2003):
. In vitro 2,2′-azinobis-(3-ethylbenzothiazoline-6-sulfonic acid) (ABTS) antioxidant assay
ABTS free radical scavenging activities of the samples were determined after introduction of some modifications to the method developed by Moldovan et al. (2016). To form the ABTS+ radical cation, 6.5 mM ABTS and 2.45 mM potassium persulfate solution were mixed in an equal volume (1:1) and incubated for 16 hours in the dark and at 24 °C until the dark green color was formed. ABTS+ was diluted with distilled water to give an absorbance value of 0.6–0.8 units at 734 nm (Moldovan et al., 2016; Sharifi-Rad et al., 2020). Different amounts (25, 50, 100, and 200 µl) of aqueous biosynthesized AgNP were prepared and added to a vial. Then, a freshly prepared aqueous solution of 2 ml ABTS solution was added to each vial. The vial was incubated in the dark for approximately 30 min. During this time, the mixing solution color changed from dark purple to transparent. The experiments were repeated 3 times with the use of a UV–Spectrophotometer at 1-min intervals at 734 nm absorbance. A BHA solution was used as a standard. A Tetra Brand T80+UV/VIS Spectrometer PG Instruments Model was used to determine ABTS free radical scavenging activity.
ABTS radical scavenging percentage was calculated with the equation:
. Determination of Total Phenolic Content (TPC)
Total phenolic content was estimated following the Folin-Ciocalteu method and demonstrated by the colorimetric oxidation/reduction reaction of phenols. This experiment was done with the modified method developed by Singleton et al. (1999). 100 µl of Folin-Ciocalteu (Merck) reagent was added to 100 µL of biosynthesized AgNPs and incubated at 24 °C for 5 min. Then, 300 µl of 20% (w/v) NaCO3 and 1580 µl of distilled water was added to the same mixture. The resulting mixture was incubated for 30 min at 24 °C. It was measured with a Tetra Brand T80+UV/VIS Spectrometer PG at 765 nm absorbance using distilled water as a blank. Gallic acid at different concentrations (15, 30, 60, 125, 250, 500 mg/L) was used to determine TPC values. The results were compared with a standard gallic acid curve with the total phenol content expressed as gallic acid equivalents (GAE) (Firoozi et al., 2016).
. Results
. Ultraviolet–violet spectroscopy
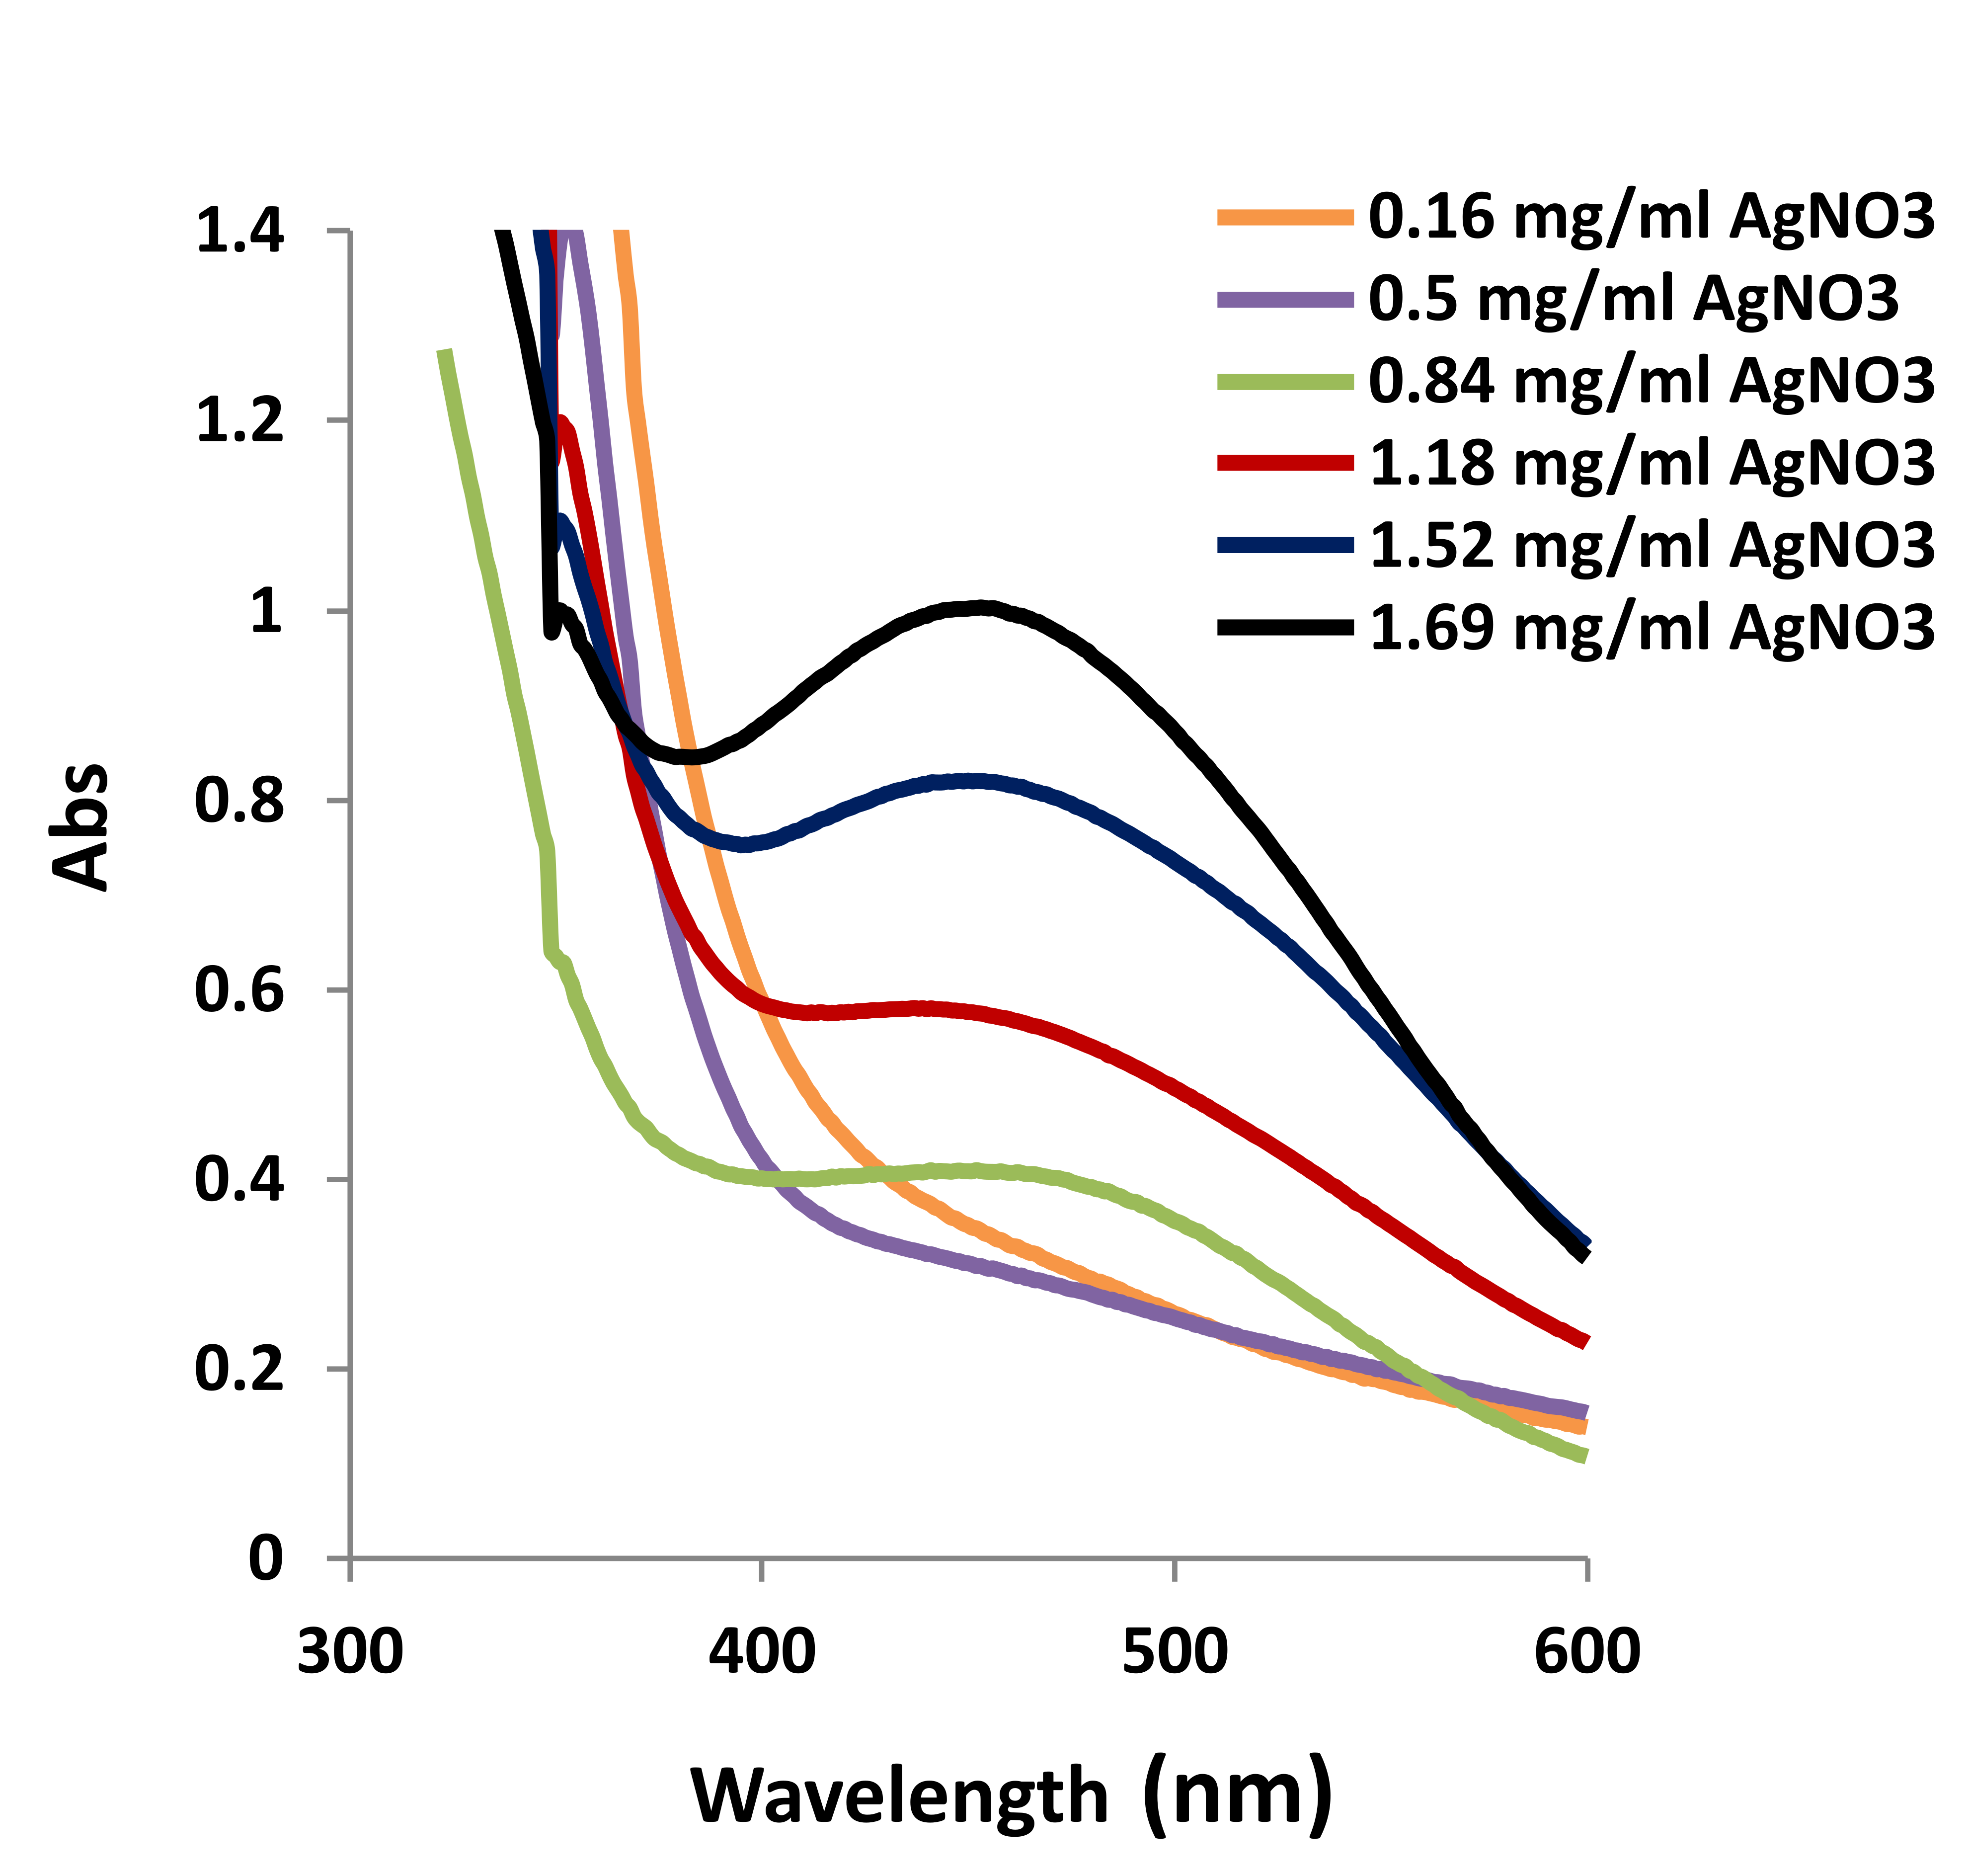
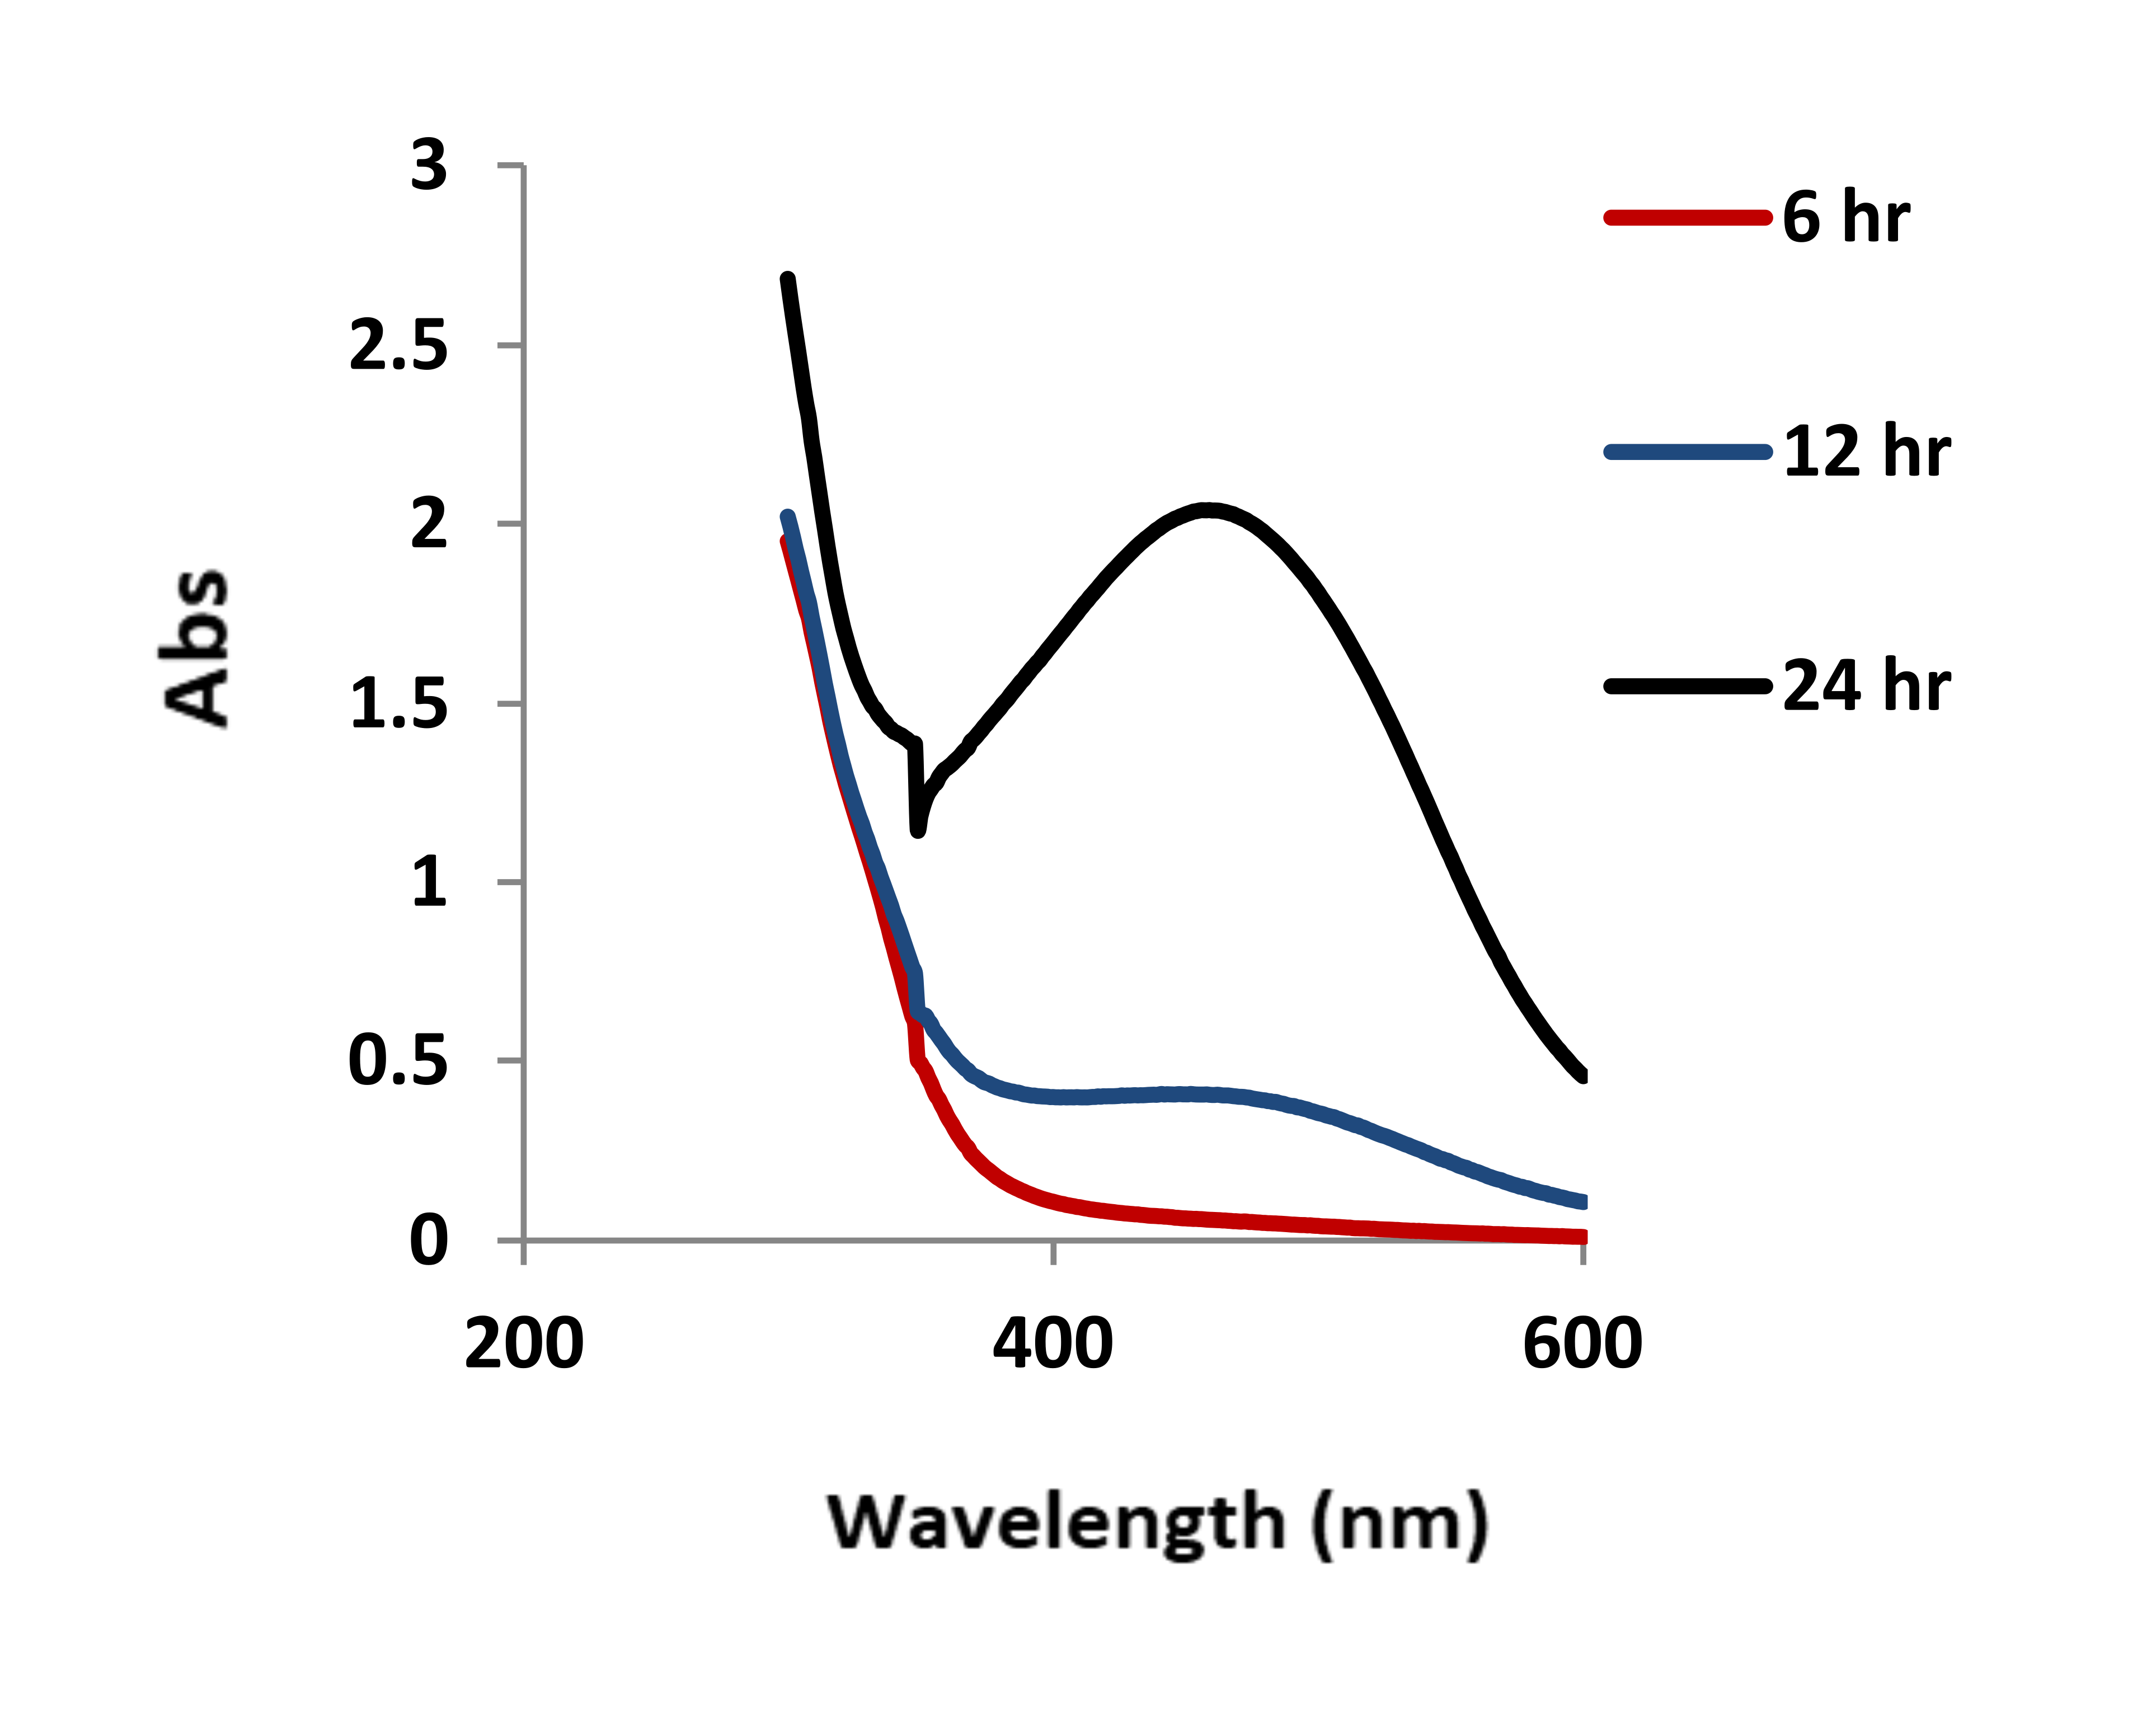
AgNPs were produced by mixing different concentrations of AgNO3 with 10 ml of the natural tetraploid T. pratense L. extract. The maximum absorbance of AgNPs was observed at 453 nm. The highest biosynthesis was determined in 1.96 mg/ml AgNO3 + 10 ml of plant extract. The lowest production was noted in 1.96 mg/ml AgNO3 + 10 ml plant extract (Figure 2, Figure 3). A change in 1.96 mg/ml AgNO3 + 10 ml plant extract in terms of AgNP formation was recorded at 6, 12, and 24 hours (Figure 4). The dark red color of the biosynthesized AgNPs at 1.96 mg/ml of AgNO3 did not change for 6 months. This demonstrated the stability of the biosynthesized AgNPs.
Figure 2
Biosynthesized AgNPs after 12 hours. AgNO3 aqueous solution in different concentrations (a) 0.16, (b) 0.5, (c) 0.84, (d) 1.18, (e) 1.52, (f) 1.96 mg/ml.
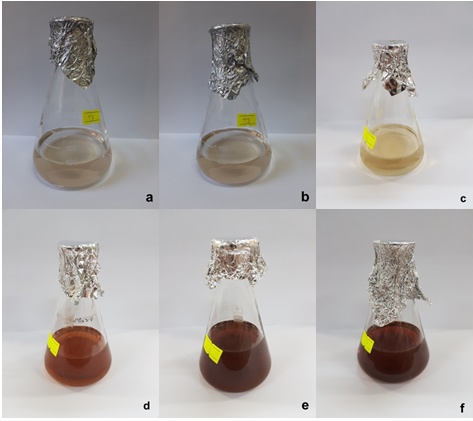
Figure 3
AgNPs biosynthesized using natural tetraploid T. pratense flowering herb at different concentrations of AgNO3.
Since UV–spectra were also obtained for the highest AgNP production at the highest AgNO3 concentration, the temperature and pH experiments were continued using 1.96 mg/ml AgNO3.
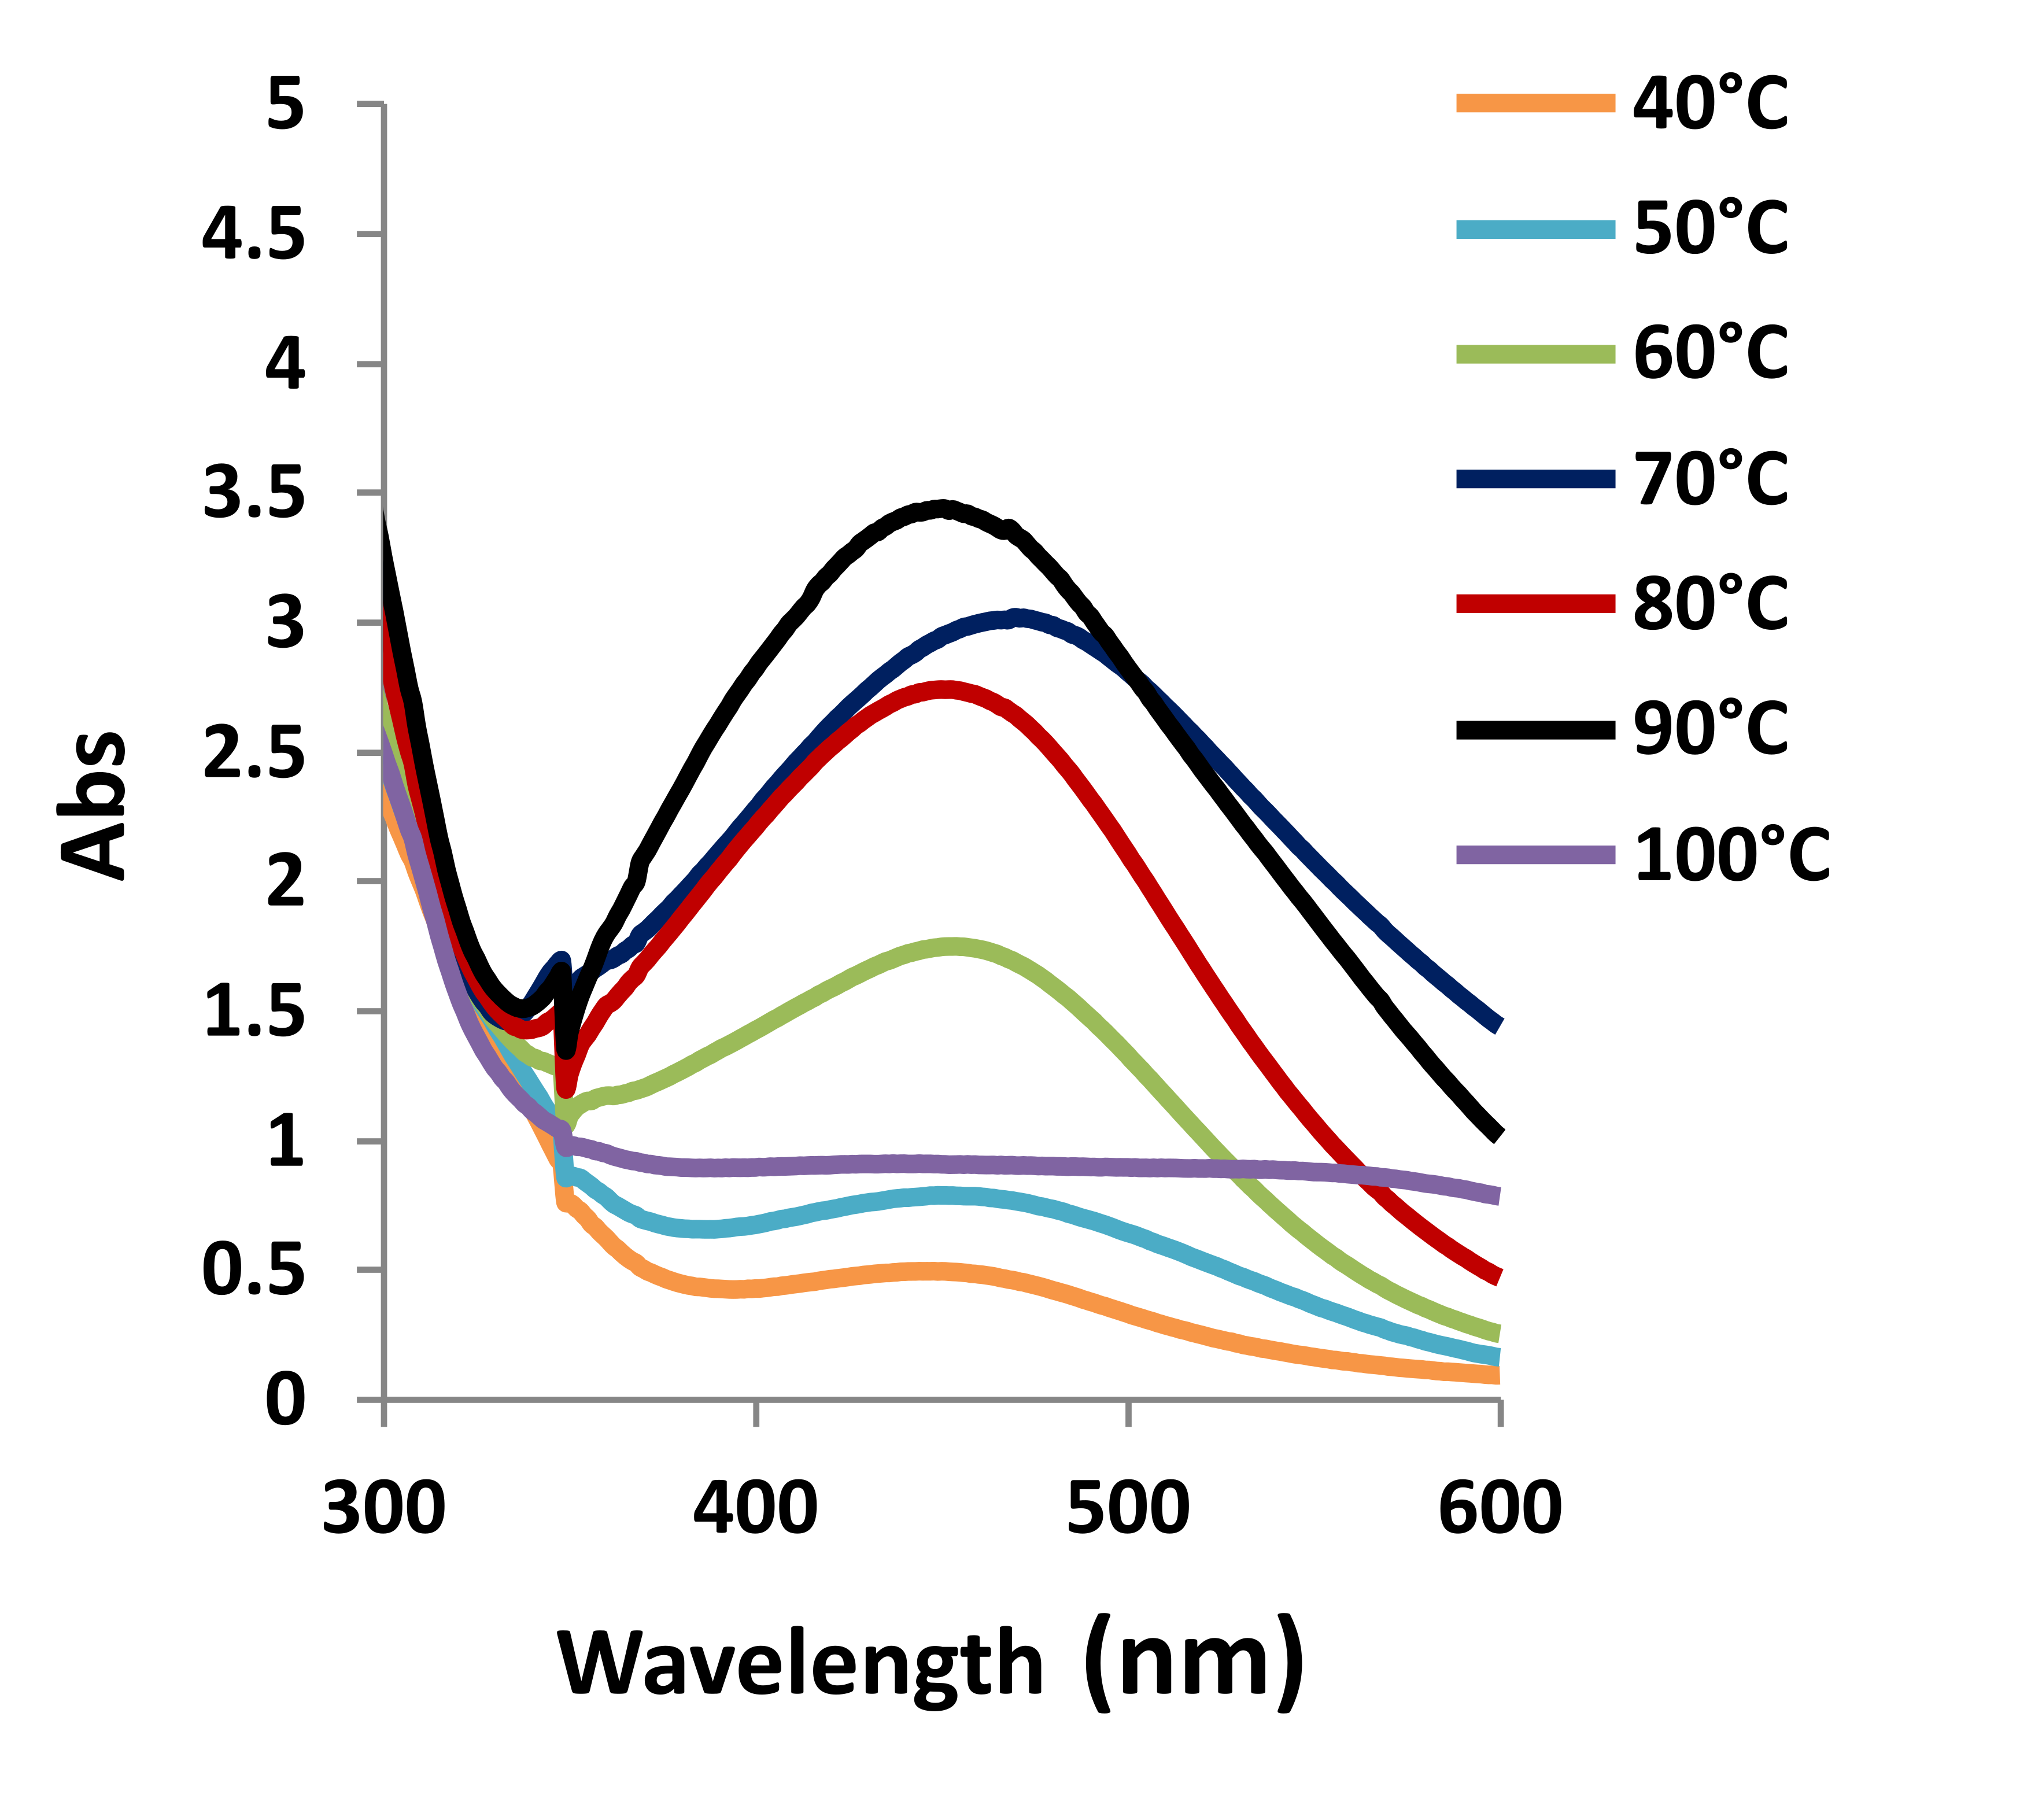
The AgNP biosynthesis experiments were carried out with 1.96 mg/ml AgNO3 + 10 ml plant extract at temperatures of 40, 50, 60, 70, 80, 90, 100 °C. The change in the reaction color started after 2 hours. While the fastest color change in the reaction was observed at 90 °C, the slowest one was observed at 40 °C. The highest biosynthesis was determined at 90 °C and the lowest at 40 °C. The maximum absorbance of AgNPs was observed at 450 nm (Figure 5).
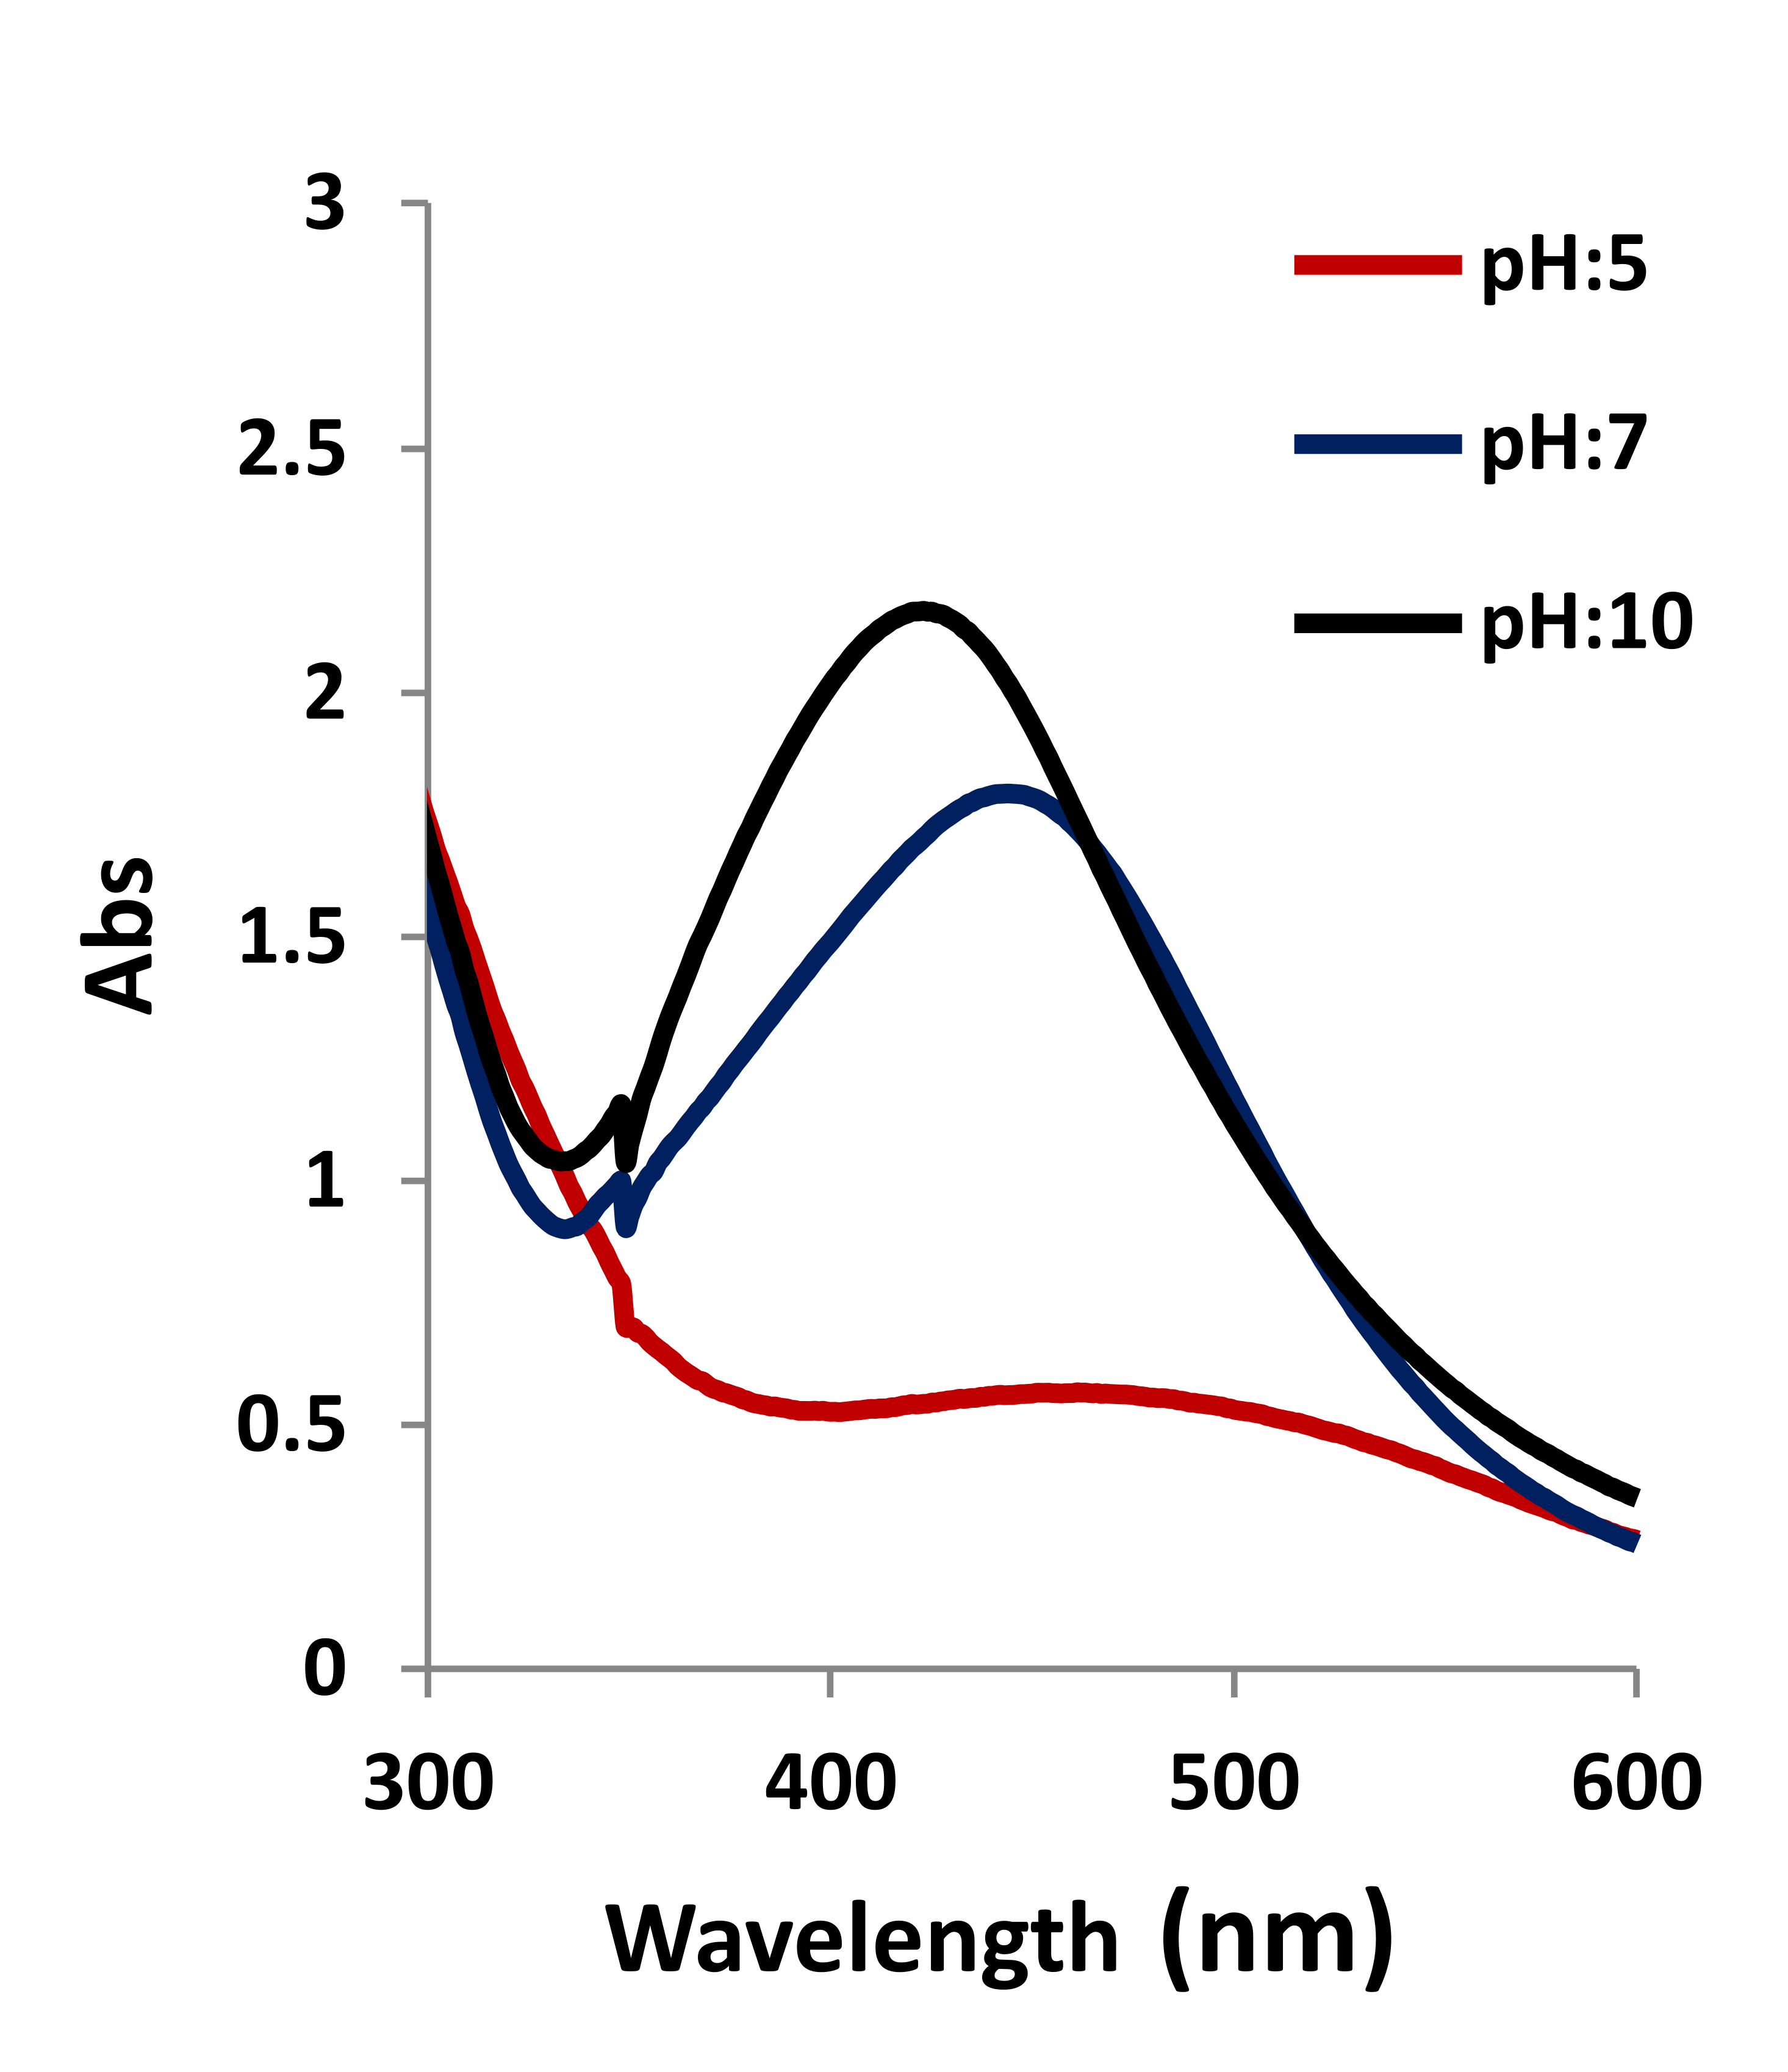
The AgNP biosynthesis experiments were carried out at pH 5, 7, and 10 with 1.96 mg/ml AgNO3 + 10 ml plant extract. The maximum absorbance of AgNPs was observed at 423 nm (Figure 6). At the lower pH, the peak in the UV–Vis curve corresponding to the AgNPs was smooth. As the pH value was increased, the peaks in the UV–Vis curve increased.
A sharp absorbance peak was determined between 400 and 500 nm in the concentration, temperature, and pH experiments. The reduction (Ag+ to Ag0) started as soon as the plant extract was added to 1.96 mg/ml AgNO3. The color of the extract changed from clear to dark red.
. TEM analysis of produced silver nanoparticles
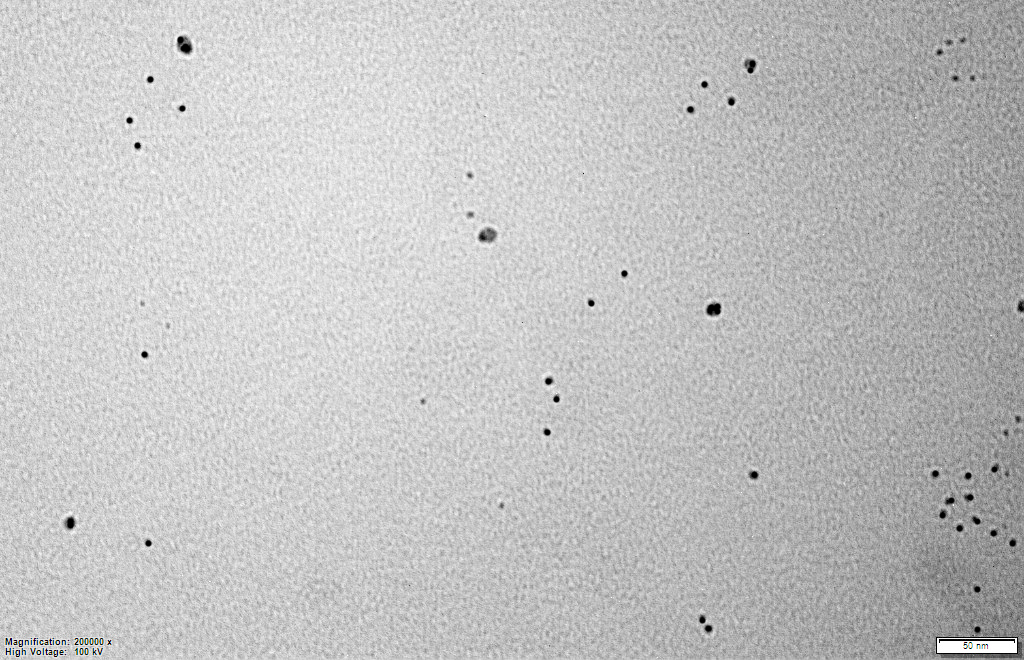
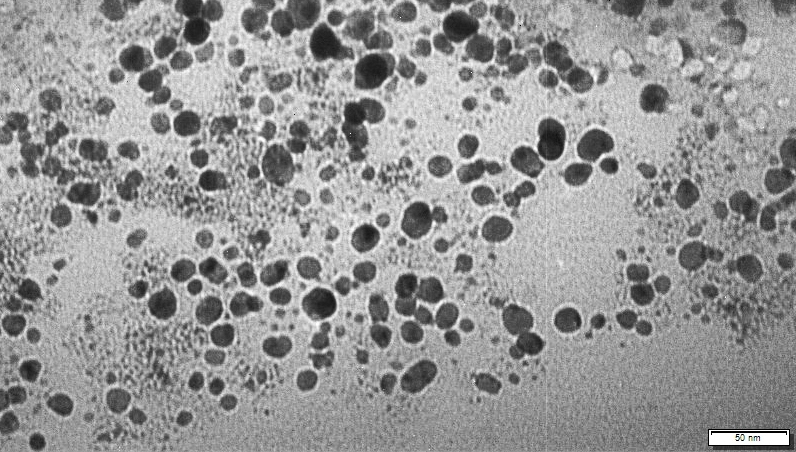
The AgNPs biosynthesized in the concentration, temperature, and pH experiments were evaluated by TEM analysis. The AgNPs biosynthesized at the concentration of 1.96 mg/ml AgNO3 + 10 ml plant extract had different shapes: triangular, cubic, elliptical, and spherical (Figure 7). It was determined that AgNPs biosynthesized at 90 °C using the 1.96 mg/ml AgNO3 + 10 ml plant extract concentration were smaller in size and spherical in shape. The TEM analysis confirmed a size distribution of the biosynthesized AgNPs ranging from 3.57 to 10.71 nm (Figure 8). The AgNPs biosynthesized at 90 °C were separated from each other and did not aggregate.
Figure 7
Transmission electron microscopy image of silver nanoparticles biosynthesized using herb extract at 1.96 mg/ml AgNO3.
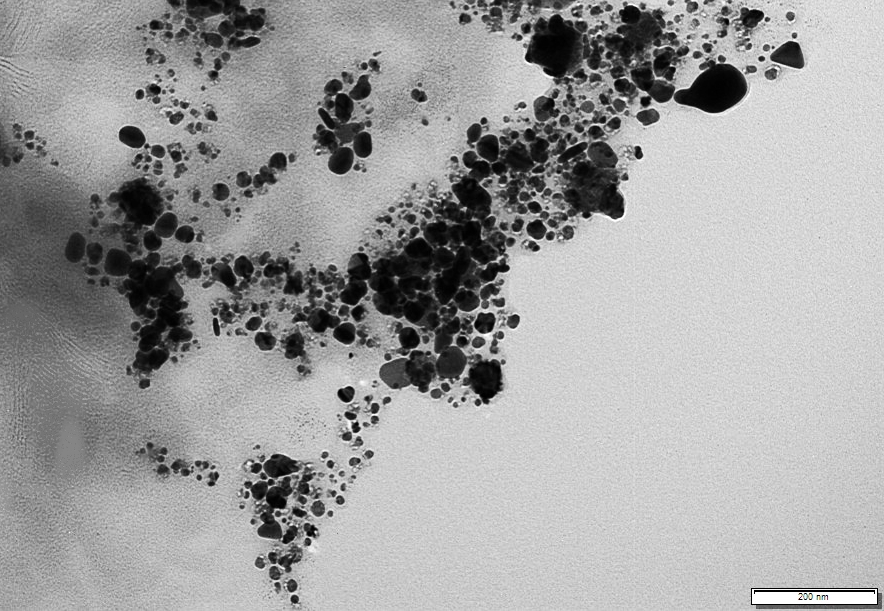
Figure 8
Transmission electron microscopy image of silver nanoparticles biosynthesized using herb extract at 90 °C.
The AgNPs biosynthesized using the 1.96 mg/ml AgNO3 + 10 ml plant extract concentration at pH:10 were determined to be spherical and elliptical. The TEM analysis confirmed a size distribution of the biosynthesized AgNPs ranging from 2.77 to 27.77 nm (Figure 9). The AgNPs biosynthesized at pH:10 were separated from each other and did not aggregate. This study confirmed that the biosynthesized AgNPs were more stable in the temperature and pH experiments.
. XRD analysis of produced silver nanoparticles
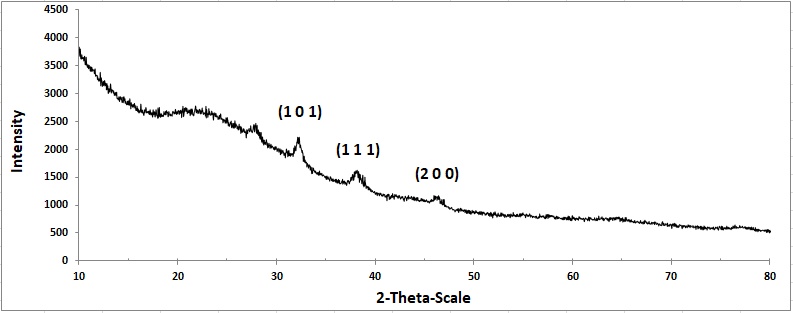
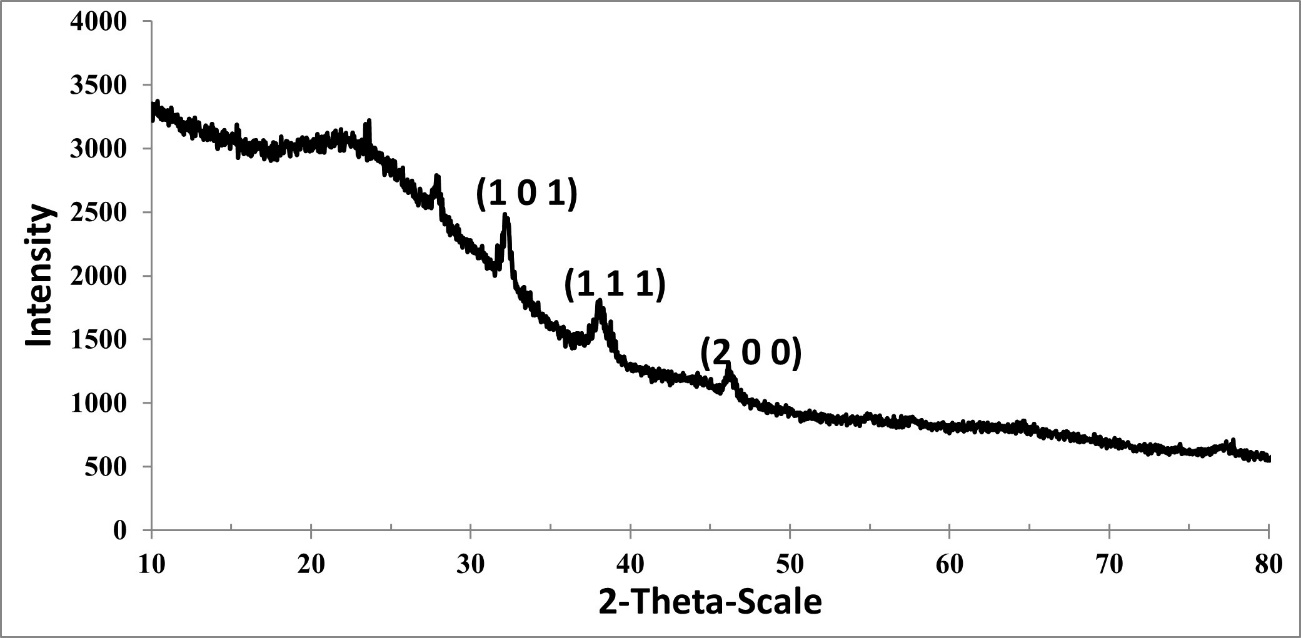
The crystal structure of the biosynthesized AgNPs mediated by the natural tetraploid T. pratense L. extract was evaluated by XRD analysis. For the AgNPs biosynthesized at 24 °C using a concentration of 1.96 mg/ml AgNO3 + 10 ml plant extract, the 2θ peaks were located at 32.19°, 38.11° and 46.30°, attributed to the Miller indices (101), (111), and (200), respectively (Figure 10).
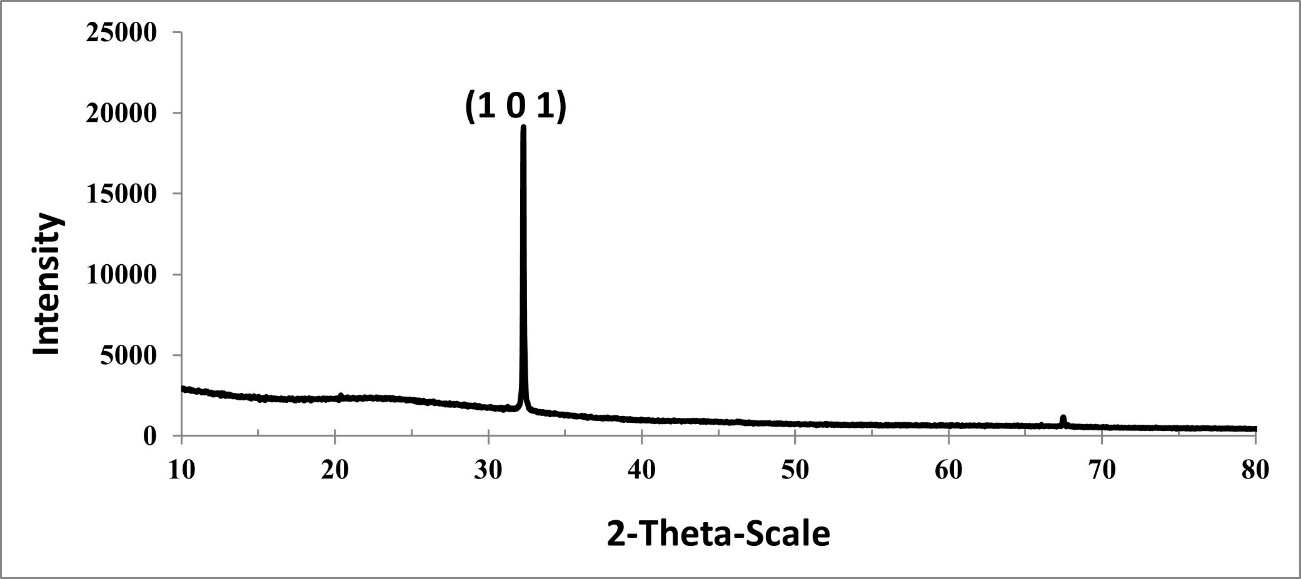
The AgNPs biosynthesized at 90 °C were defined in the diffractogram (Figure 11). This peak was attributed to the Miller index (101). The XRD pattern showed crystallinity of the AgNPs biosynthesized at 90 °C; the resulting graph is a sharp and high peak. The AgNPs biosynthesized at pH:10 were defined in the diffractogram with 2θ peaks: 31.71°, 37.51°, 45.63°, which were attributed to the Miller indices (100), (111), and (200), respectively (Figure 12).
The Miller index of all samples showed the face-centered cube (FCC) crystal structure of AgNPs. These peaks stemmed from the organic compounds present in the extract which are responsible for the reduction of silver ions and stabilization of the nanoparticles.
The Scherer–Debye equation was used to calculate the average crystalline size of the biosynthesized AgNPs (Mohammadi & Ghasemi, 2018).
D is the size of the crystal; its unit is equal to the λ unit and is usually angstrom or nm;
λ is the X-ray wavelength; Used K-Alpha1 wavelength;
K is a dimensionless shape factor, with a value close to unity;
β is the full width at half maximum (FWHM);
θ is the peak position on the horizontal axis of the diffraction pattern, which, if the horizontal axis is 2θ, should be divided into two to get θ.
The average crystal size of the biosynthesized AgNPs was calculated to be 46 nm for the concentration, 5.6 nm for 90 °C, and 10.91 nm for pH:10. The results proved to be similar when compared with the TEM analysis.
. FTIR analysis of produced silver nanoparticles
The FTIR analysis was performed to identify organic biomolecules of the natural tetraploid T. pratense L. extract responsible for the biosynthesized AgNPs (Figure 13). Absorption peaks in the FTIR spectrum of the AgNPs biosynthesized using the 1.96 mg/ml AgNO3 + 10 ml plant extract concentration in the range of 400 to 4000 cm−1 are 2976.5, 2898.2, 2287.2, 1552.7, 1404.4, and 1006.5 cm−1. Absorption peaks in the FTIR spectrum of the AgNPs biosynthesized at 90 °C are 2988.7, 2898.2, 1391.4, and 1066.5 cm−1. Absorption peaks of the AgNPs biosynthesized at pH:10 are 3262.1, 2849.5, 2916.8, 1531.9, 1382.7, 1231.3, and 1026.7 cm−1.
Figure 13
FTIR spectrum of AgNPs biosynthesized using natural tetraploid T. pratense L. flowering herb extract. (a) 1.96 mg/ml AgNO3, (b) 90 °C, (c) pH:10.
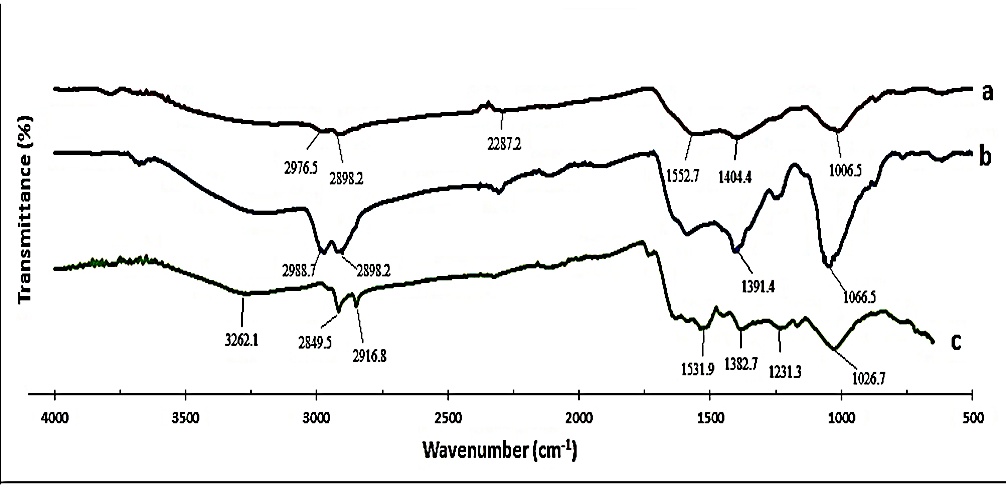
The peaks were assigned as follows: 3262.1 cm−1 - O–H hydroxyl groups and H-bonded OH stretches; 2976.5 cm−1, 2898.2 cm−1, 2849.5 cm−1, and 2916.8 cm−1 - C–H stretch; 1552.7 cm−1 and 1404.4 cm−1 - carboxylate; 1006.5 cm−1 - aliphatic phosphate; 2988.7 cm−1 and 2808.2 cm−1 - the –CH stretching of the –CH3 and –CH2 functional groups; 1391.4 cm−1 and 1382.7 cm−1 - carboxylate stretch, 1066.5 cm−1 and 1026.7 cm−1 - C–N and primary amine stretch (Mourdikoudis et al., 2018; Sahayaraj et al., 2012).
. Determination of antioxidant activity
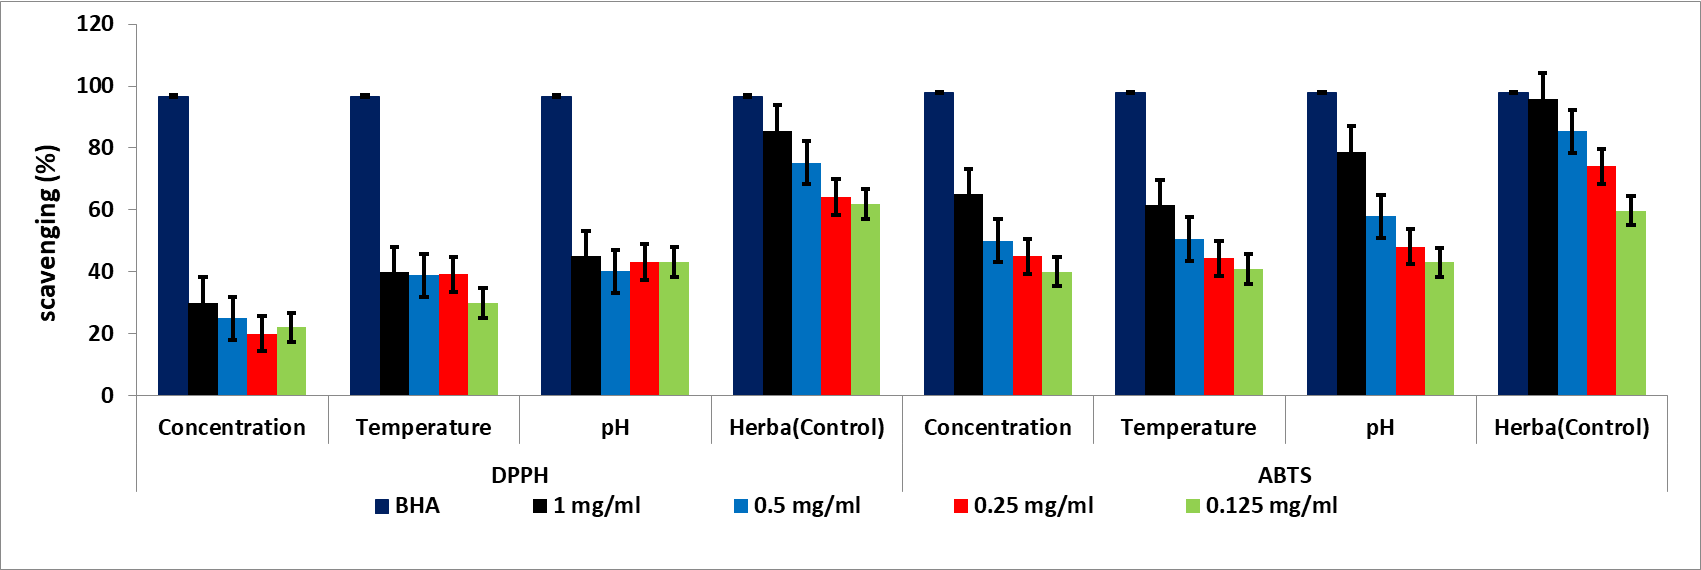
DPPH and ABTS radical scavenging activities were measured for the AgNPs biosynthesized using the natural tetraploid T. pratense L. flowering herb extract. The results of the DPPH and ABTS radical scavenging activity are shown in Figure 14. The free radical scavenging activity of the biosynthesized AgNPs showed that, as the AgNP concentrations increased, the antioxidant activity also increased gradually. The highest DPPH radical activity in the concentration, temperature, and pH experiments was 30, 39, and 45%, respectively; the highest ABTS radical activity was 65, 61, and 78%. The lowest antiradical activity in the concentration, temperature, and pH experiments was 20, 29, and 43% against DPPH and 40, 40, and 43% against ABTS, respectively.
. Determination of total phenolic content
Total phenolic content was determined with the Folin–Ciocalteau method using gallic acid equivalent (GAE) as a reference. Total phenolic compounds showed the content of total phenols in the natural tetraploid T. pratense L. extract and AgNPs.
The total phenolic content in the natural tetraploid T. pratense L. herb extract was determined to be 130.5 ± 2.2 mg GAE/g, while the total phenolic content in the biosynthesized AgNPs in the concentration, temperature, and pH experiments were 143.1 ± 2.1 mg GAE/g, 135.3 ± 3.2 mg GAE/g, and 160.2 ± 3.1 mg GAE/g, respectively. Each sample was replicated three times and data were presented as mean ± standard deviation (SD).
. Discussion
The occurrence of biosynthesized AgNPs was indicated by the color change (dark red) after completion of the reaction between the natural tetraploid T. pratense L. flowering plant extract and AgNO3 at different concentrations (Figure 2). The absorption spectrum of the AgNPs biosynthesized with different concentrations of AgNO3 using the natural tetraploid T. pratense L. extract is shown in Figure 3. UV–Vis spectroscopy is one of the important techniques to determine the reduction of Ag+ from an AgNO3 solution and the formation of AgNPs.
It was determined that the absorbance peak shifted towards the lower wavelength region as the AgNO3 concentration increased. However, it was observed that the peaks became narrow as the AgNO3 concentration increased. According to Figure 3, it was determined that the optimal reaction mixture should have a higher AgNO3 concentration than the extraction concentration. Similar results of many previous studies pointed out that the SPR peak located between 410 and 460 nm was related to the formation and presence of spherical and/or near-spherical AgNPs, as determined in the study conducted by Faghihi et al. (2017). Faghihi et al. (2017) performed AgNP biosynthesis from grapefruit peel. The highest absorption was observed when the nanoparticle concentration in the solution increased (Faghihi et al., 2017).
In the absorption band, a slower increase was observed for lower temperatures. It was concluded that the rate of nanostructure formation is strongly dependent on temperature. Yeshchenko et al. (2013) suggested that higher temperatures increase the activation energy of molecules, thus leading to a faster reaction rate.
As the pH increased, the Surface Plasmon Resonance (SPR) peaks shifted towards the blue wavelength. The same situation was observed in the experiment conducted by Sundarrajan et al. (2018). The stimulation of surface plasmons of silver caused a color change of the solution (Chowdhury et al., 2021). AgNPs contain free conduction electrons. The combined vibration of free conduction electrons in resonance with the light wave was induced by electromagnetic radiation. The outermost orbital free conduction electrons of AgNPs were excited so that the evolution of basic nanoparticles was determined at 400–500 nm (Chowdhury et al., 2021). The broadening of the absorption band in the concentration, temperature, and pH experiments indicated the existence of a wider size range in the solution.
The TEM analysis was done to determine the size and morphology of the biosynthesized AgNPs. Biosynthesized AgNP morphologies were attributed to the study conducted by Gonzalez et al. (2014). The TEM analysis confirmed the AgNP size distribution ranging from 7.4 to 96.29 nm. At the same time, aggregation and a color change from light to dark were noted in the AgNPs. This suggested that the AgNPs were covered by such biomolecules as primary and secondary metabolites in the natural tetraploid T. pratense L. extract, and this was confirmed by studies reported by various researchers (Lu et al., 2014; Roy et al., 2019).
Polyols, such as terpenoids, flavones, and polysaccharides, have been reported to be the main bioreducers in the AgNP formation mechanism (Vijayaraghavan et al., 2012). It is known that biological components bind to metal salts with functional groups in extracts and facilitate the reduction of nanoparticles (Firoozi et al., 2016). The FTIR analysis confirmed our results.
When comparing the DPPH and ABTS trials, ABTS was confirmed to have significantly higher (p ≤ 0.01) scavenging activity. According to some researchers, the antioxidant activity of biosynthesized AgNPs is due to the presence of phenolic compounds, terpenoids, and flavonoids, which allow them to act as hydrogen donors and reducing agents in plants (Bedlovičová et al., 2020).
. Conclusions
In the current study, AgNPs biosynthesized using the extract of natural tetraploid T. pratense L. flowering herb were reported. Biosynthesis with the natural tetraploid T. pratense L. flowering herb extract is a reliable, easy, fast, economical, and environmentally friendly method. The biosynthesized AgNPs had an average size of 2.77–46.73 nm and a spherical shape. They were characterized by XRD, TEM, UV–Visible, and FT-IR spectroscopy. Strong radical scavenging activity and total phenol content were exhibited by the AgNPs biosynthesized using the natural tetraploid T. pratense L. flowering herb extract. This environmentally friendly method can be a competitive alternative to the traditional physical/chemical methods used for the synthesis of AgNPs. With high antioxidant and reducing capacity, plants are suitable not only for the green synthesis of metallic NPs but also for the prevention or reduction of the harmful effects of reactive oxygen species (ROS) produced during the normal cellular metabolism in plants and animals.
