. Introduction
Weed control is important for reducing the water and nutrient competition in crop production, including orchards (Granatstein & Sanchez, 2009; Korotkova et al., 2021). The herbicide fallow is still the most common soil management used in the tree rows. Taking into account the tendency to reduce or eliminate pesticides in fruit production, it becomes essential to have alternative soil management systems (Fogliatto et al., 2020). Mia et al. (2020) suggested that the living mulch in fruit tree rows can ensure weed control, and it is one of the options to replace herbicide fallow. The presence of green mulch in the orchard provides many agroecosystem advantages (Golian et al., 2023; Lemessa & Wakjira, 2015). It improves orchard biodiversity (Tebeau et al., 2017), soil properties (Ping et al., 2018; Qian et al., 2015), and soil microbiological status (Qian et al., 2015). The lower costs of cover plants in alleyways, compared with the initial high cost of synthetic mulch or organic re-applied straw in tree rows, are also advantages of the living mulch (Tebeau et al., 2017).
A living mulch can suppress weed biomass and seed production and reduce rhizome growth (Teasdale et al., 2007). The effectiveness of the weed control with the use of different living mulches is varied and depends on rapid cover crop growth and shading of weeds. In contrast, due to their low growth rate and insufficient height, cover crops cannot effectively compete with weeds (Gandomkar, 2019). The level of weed infestation in the living mulch changes with time. Annual weeds appear often simultaneously just after cover crop sowing. They do not find a sufficient surface for abundant germination when the living mulch sod already covers the soil under the trees well. Perennial weeds can unfortunately maintain a dominant position in the sod longer, sometimes for decades. The presence of cover crop in tree rows does not always provide a satisfactory level of weed control (Licznar-Małańczuk, 2020).
The choice of optimal living mulch was found important for a sufficient fruit tree growth and yield (Mia et al., 2020). It was reported that young trees tend more to compete for moisture and nutrient substances with plants beneath the tree canopy (Hogue et al., 2010; Licznar-Małańczuk, 2012; Mika et al., 1998). Competition for water and nutrients was shown to come from both weeds and planted cover crops, but simultaneously different living mulches had a variable ability to retard weeds (Granatstein & Sanchez, 2009). Although grasses have lower biomass than some plants from the families Fabaceae and Asteraceae (Ping et al., 2018), they were also reported to compete with weeds successfully (Hammermeister, 2016). The aim of the present study was to evaluate the relationship between a cover of four grasses used as a living mulch in an apple orchard and the weed cover as well as its impact on the fruit tree yield, growth, and fruit quality.
. Material and methods
The relationship between covers of the grass living mulch and a weed population and its impact on the fruit tree were estimated at the Fruit Experimental Station of the Wrocław University of Environmental and Life Sciences in Wrocław (Poland) located in Samotwór (51° 06′ 12″ N, 16° 49′ 52″ E). The following living mulches were used: blue fescue (Festuca ovina L.) cv. ‘Noni’, red fescue (Festuca rubra L.) cv. ‘Adio’, Kentucky bluegrass (Poa pratensis L.) cv. ‘Niweta’, and perennial ryegrass (Lolium perenne L.) cv. ‘Info’. Each grass was sown separately at a rate of 50 kg seeds per ha in spring 2017, i.e. one year after the planting the apple trees (Malus domestica Borkh.), between the tree rows were 3.6 m, and a 1.2 m distance was used between the trees in a row. Two-year-old apple trees cv. ‘Chopin’ grafted on a semi-dwarf MM106 rootstock were planted. The tree canopies were trained to the slender spindle form. From the second year after orchard establishment, each tree was fertilized with ammonium nitrate (15 g N in 2017–2018 and 20 g N in 2019–2020) separately. The cutting and protection of the trees were conducted exactly as at a commercial orchard.
The experiment was established following a randomized block design with four repetitions. Each grass was sown separately in the tree rows and in the adjacent tractor alleys on the western side of each row. The glyphosate herbicide was applied in the tree rows at the rate of 2450 g ha−1 one month before the grass sowing. The soil was hoed three weeks later, and the main remaining perennial weeds were hand-picked. The tree-row soil was leveled with a rake. At the end of May, grass seeds were scattered by hand and raked into the soil, after which the floor was rolled with a hand-roll. Tractor alleys were performed one month before the living mulch sowing to till the soil and destroy the weeds between the rows. The floor was leveled three weeks later with a cultivator. As in the tree rows, grass seeds in the tractor alleys were scattered by hand at the end of May, but the following cultivation was limited to rolling with a roll pulled by a tractor. From the summer of the year when the living mulch was sown, the grass sod in the tractor alleys was mown with a lawn mower several times per year in accordance with commercial orchard recommendations (Granatstein & Sanchez, 2009). In turn, the grass sod in the tree rows was mown manually twice or three times per year with a string trimmer.
The main plot area for each separately estimated grass was 17.28 m2 (3.6 m × 4.8 m) and it contained four apple trees. In the middle part of the main plot area, two sub-plot areas were designated for the assessment of living mulch sod and weed infestation in the tree row (1.80 m2) and for the same estimation in the tractor alley (4.68 m2). Whole-plot evaluation was abandoned to avoid non-representative weed communities that occurred at the edges of the investigated grass living mulches. The degree of coverage by the four grass living mulches and each separate weed species were assessed as the percentage of both separate surface areas in 2017–2020. A noninvasive method of separate plant estimation was used, following to the methodology of Lipecki and Janisz (2000). The original share of the scale was modified by splitting the range over 0% up to 20% into two separate groups; as a final result, each taxon was expressed using a discrete percentage scale: 0%, 1%, 20%, 40%, 60%, 80%, and 100%. The estimation was performed separately for each species and for the genus of weeds in some cases. As the share of each species was assessed independently, it was impossible to express the relationship between the total shares of all weed populations at a scale of 100%. Therefore, an additional estimation of total annual and total perennial weed populations were estimated. The first evaluation of the weed cover was made in July 2017. Starting from 2018 up to 2020, the weeds were estimated twice per year: in spring (the end of April) and at the beginning of summer (July). A complete list of identified species was presented in Bałuszyńska et al. (2022), and this work uses data describing the population level of annual and perennial weeds, reflecting their potential competitiveness in relation to the fruit tree. The nomenclature of vascular plants was based on Erhardt et al. (2008).
The number of fruits was counted and total yields per each tree were collected in 2017–2020. The separate fruit mass was calculated as a ratio of the total yield weight from four years (2017–2020) to the total number of fruits and computed separately per each replication. Each harvested yield per each repetition was sorted into classes: over ¾, ¼–¾, and less than ¼ of the apple skin blush surface area. The same samples were divided into classes of the fruit diameter: less than 6.5, 6.5–7.5, 7.5–8.5, and over 8.5 cm. The evaluation was omitted in 2017 due to partial hail damage to fruits. As a measure of each separate tree growth, the trunk cross sectional area (TCSA) and its increment were calculated from two diameters (north–south and east–west direction) measured 30 cm above the grafting height. The measurements were made after planting the trees (spring 2016) and in autumn 2020. The crop efficiency coefficient (CEC) was computed as a ratio of the total yield from four years (2017–2020) to TCSA in autumn 2020.
The temperature and water conditions varied in the successive growing seasons during the experiment. They were similar in 2016–2017 (Table 1). The mean annual temperature fluctuated around 10 °C, and the total annual precipitation was above 600 mm. The amount of precipitation from April to June 2016 had a positive effect on tree adoption after planting in spring 2016. The precipitation favored the germination of living mulch seeds and the early development of grass sod in 2017. The two following years were dry. In 2020, however, the precipitation was abundant and exceeded 800 mm. The wettest months were May and June with 85.4 mm and 262.4 mm, respectively. Compared to 2020, in 2016–2019, the precipitation in these months was much lower.
Table 1
Total precipitation and mean temperatures at the Wrocław-Strachowice Station (51°06′14″N, 16°52′55″E) in 2016 to 2020.
The degree of the soil cover by the total weed population and the ratio of the living mulches to weeds, apple yield, fruit quality, and growth of the trees were evaluated statistically. One-way analysis of variance for the randomized block design was used. In order to fulfill the assumptions of the analysis of variance, at least approximately, angular (Bliss function) or exponential transformations were applied to some of the data. The multiple comparisons were performed at the 5% significance level using Duncan’s Multiple Range Test.
. Results
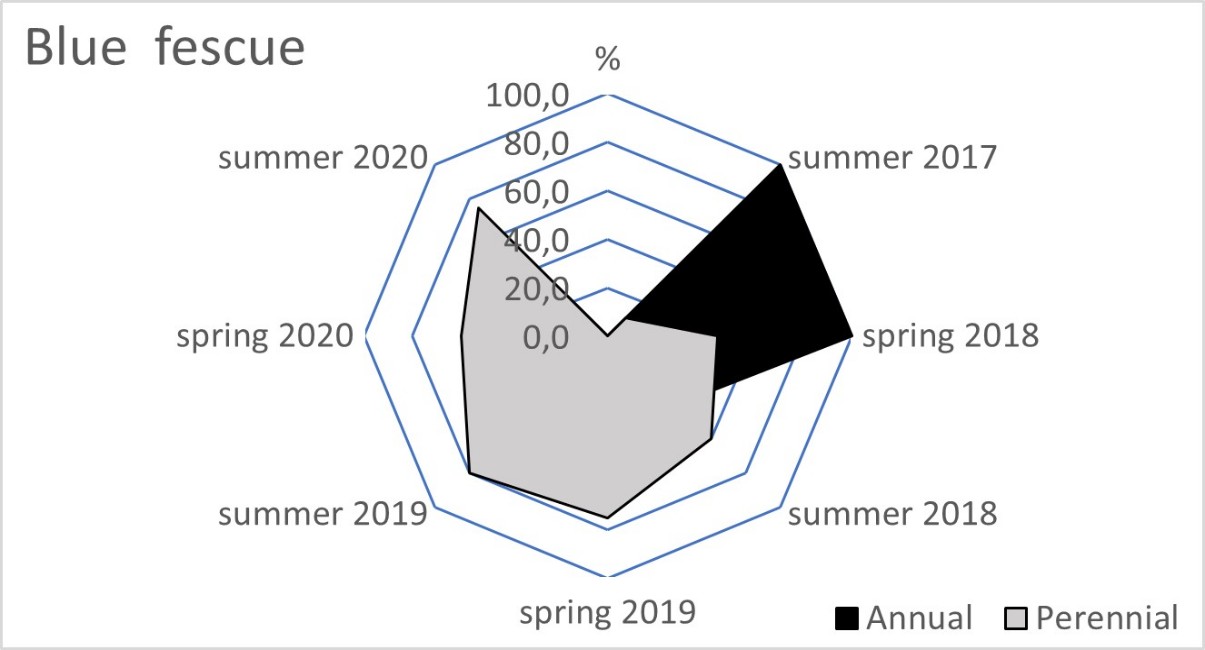
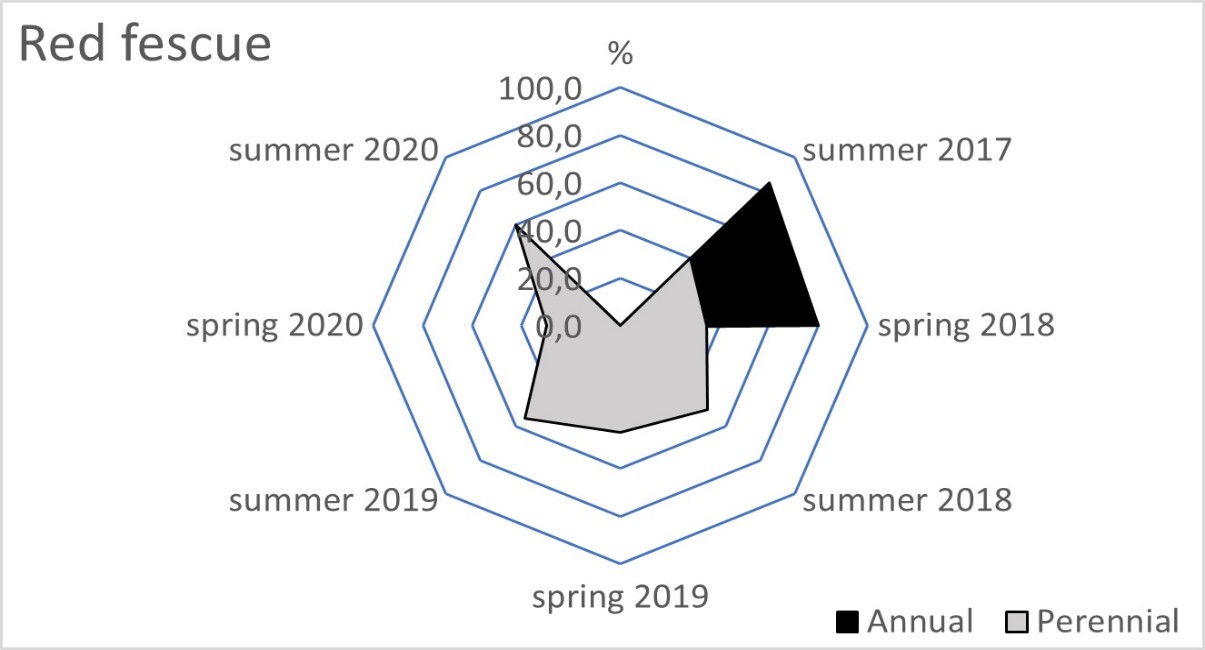
The blue fescue sod was the most weed infested living mulch in the tree rows and tractor alleys (Table 2). One year after sowing, in spring 2018, the total weed population cover in this living mulch was significantly greater compared to the tree rows with red fescue and perennial ryegrass. This tendency continued in the following year of blue fescue cultivation (2019), compared to the other three tested grasses. In the first two years after sowing the grasses, a limitation of weed occurrence was clear in the perennial ryegrass in the tree rows and in the tractor alleys. After four years of the research, the red fescue retarded the growth of weeds the most effectively. The high value of the ratio of the soil surface area under the grass living mulch sod to the total weed population cover confirmed the dominance of red fescue, especially in the tree rows (Table 3). Compared to red fescue, higher values were recorded for perennial ryegrass, but only in the first years of its cultivation. These two species prevented the germination and growth of the total annual weeds as early as the spring of 2018 in the tree rows (Figure 1). This tendency was not observed in the tractor alleys with red fescue, but it was clear in the perennial ryegrass sod (Figure 2). The annual weed infestation of the Kentucky bluegrass sod was very similar to red fescue, but was much larger in the blue fescue sod. In the following years, perennial species dominated the structure of the weed cover. The greater weed infestation in the tractor alleys in the year of mulch sowing was a result of less careful soil preparation for seed sowing compared to the tree rows. The appearance of perennial weeds already in the initial period allowed them to develop a larger population, which determined their high coverage between the rows in the following years. The further development of their population was also stimulated by good water conditions in 2020. In the summer of that year, the ratio of the sod area of all living mulches to the total weed population area decreased rapidly (Table 3) due to an increase in the population of perennial weeds (Figure 1 and Figure 2).
Table 2
Mean percentage of the soil surface under the total weed population cover within the living mulch in the succeeding years 2017–2020.
Table 3
Ratio of the soil surface under living mulch to the total weed population cover in the succeeding years 2017–2020.
| Living mulch | Year and season | ||||||
|---|---|---|---|---|---|---|---|
| 2017 | 2018 | 2019 | 2020 | ||||
| Summer | Spring | Summer | Spring | Summer | Spring | Summer | |
| Tree row | |||||||
| Blue fescue | 0.1 a | 0.4 a | 0.8 a | 1.7 a | 1.6 a | 4.0 | 3.8 a |
| Red fescue | 0.6 a | 2.8 b | 3.8 bc | 5.0 b | 7.5 c | × | 7.5 b |
| Kentucky blue grass | 0.5 a | 0.6 a | 2.9 b | 5.0 b | 4.1 b | 4.4 | 2.6 a |
| Perennial ryegrass | 1.7 b | 5.6 c | 6.3 c | 7.5 b | 5.6 bc | 4.4 | 2.5 a |
| Tractor alley | |||||||
| Blue fescue | 0.1 a | 0.2 a | 0.7 a | 0.7 a | 0.9 a | 1.4 | 0.9 |
| Red fescue | 0.7 b | 1.2 b | 2.1 b | 2.3 b | 2.0 bc | 3.3 | 1.4 |
| Kentucky blue grass | 0.4 ab | 1.1 b | 2.1 b | 3.1 b | 3.1 c | 2.5 | 1.1 |
| Perennial ryegrass | 1.4 c | 2.8 c | 4.4 c | 2.5 b | 1.6 ab | 2.0 | 1.2 |
Figure 1
Mean percentage of the soil surface under the total annual and total perennial weed cover within the living mulch in the tree rows in the succeeding years 2017–2020.
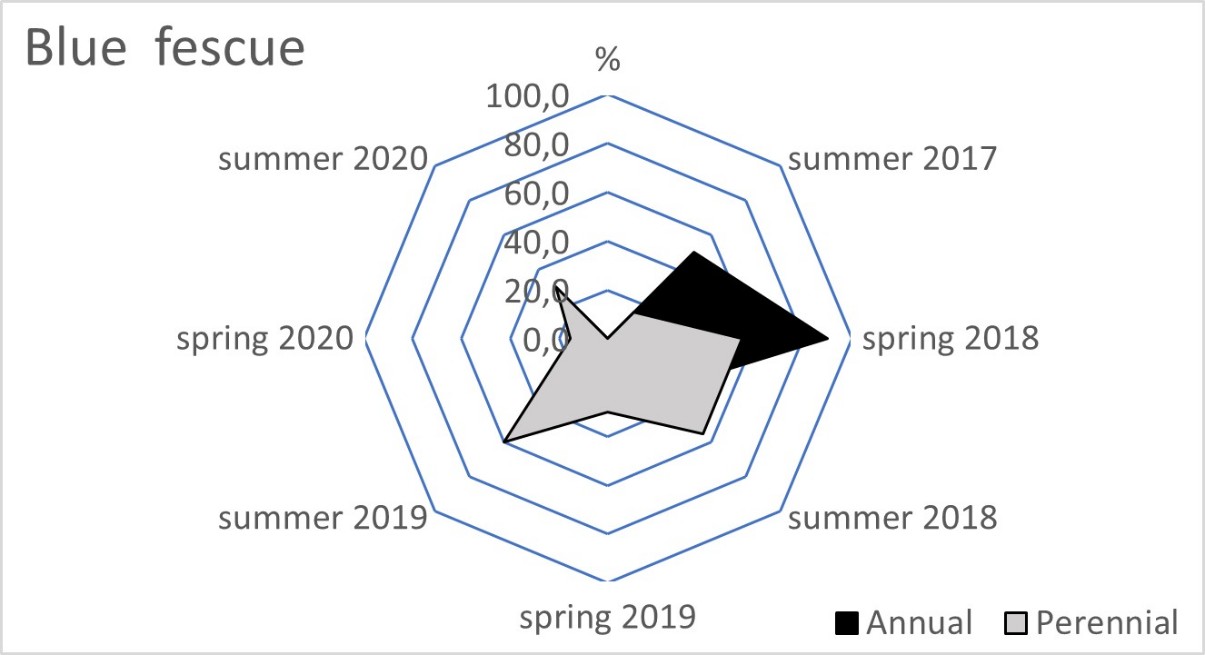
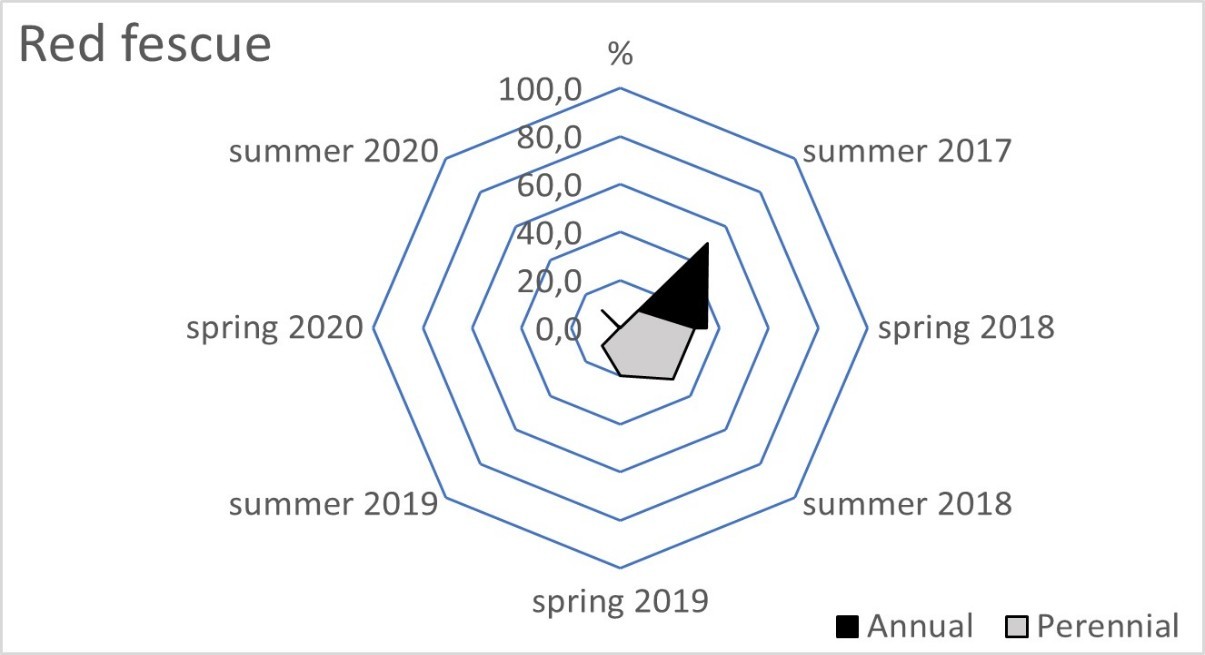
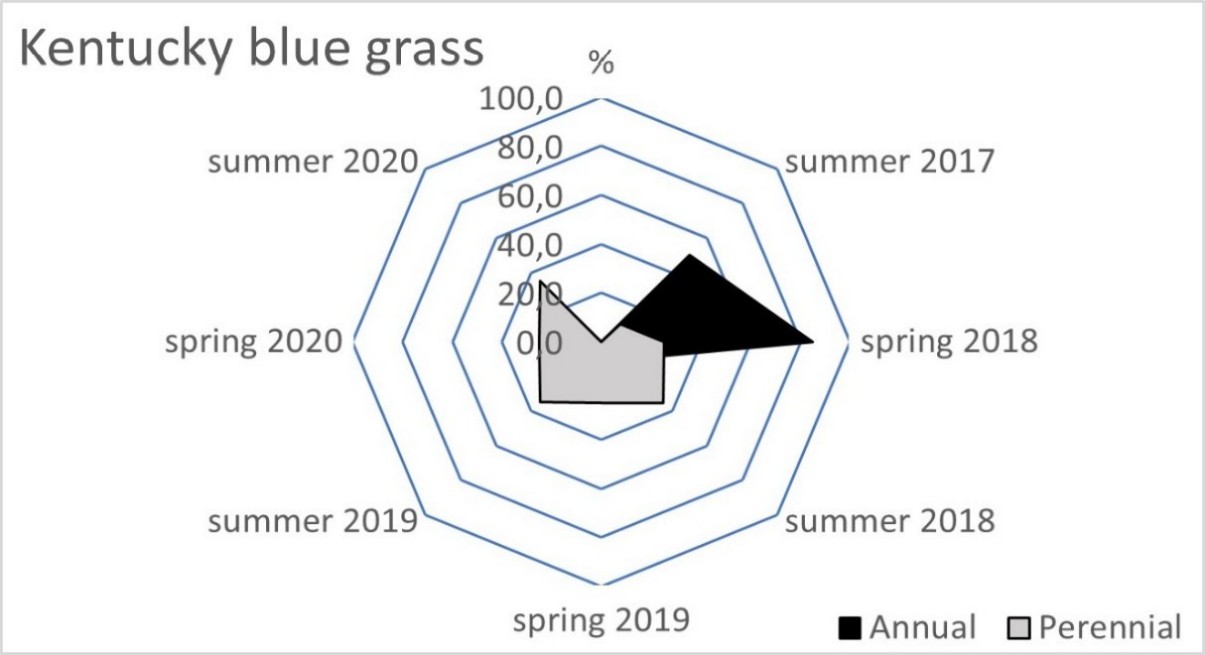
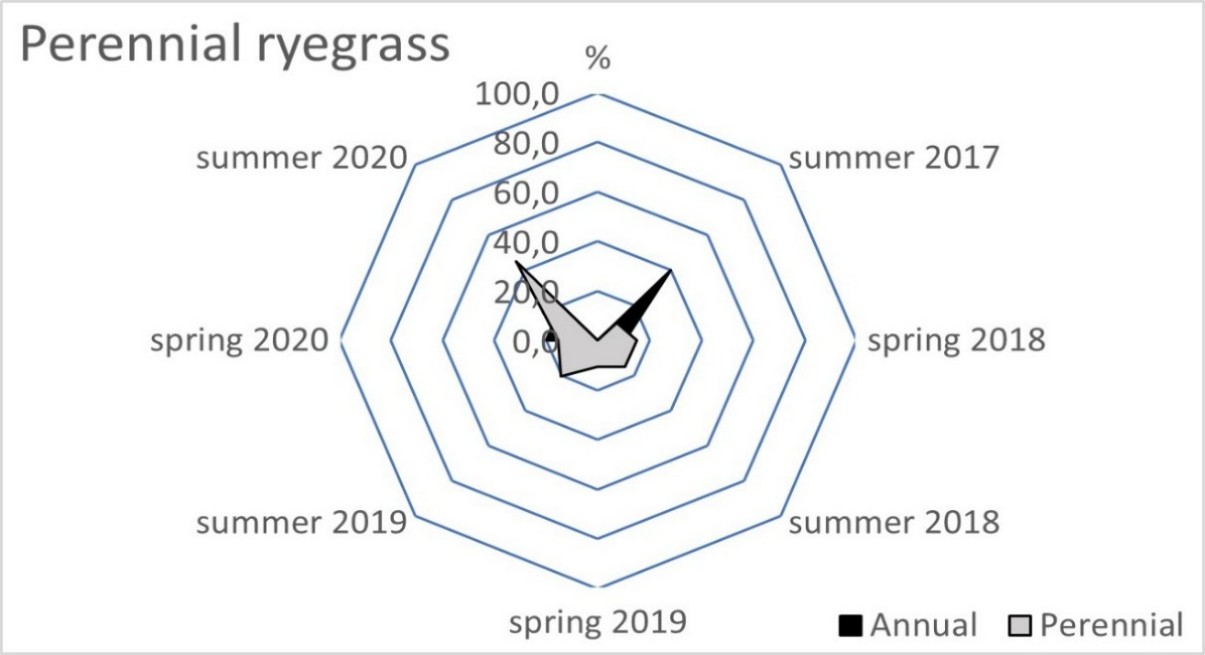
Figure 2
Mean percentage of the soil surface under the total annual and total perennial weed cover within the living mulch in the tractor alleys in the years 2017–2020.
The four evaluated grasses were dominated by the population of Trifolium repens L. (Table 4). Other perennial Poaceae species appeared in the tree rows of blue fescue and Kentucky blue grass. In the tractor alleys, a large coverage was developed by Taraxacum officinale Web. Ex F.H. Wigg. They were accompanied by Plantago major L., Malva sylvestris L., or other perennial species. The most common species composition and the percentage of the soil surface under the perennial weeds differentiated the sod of the four grasses. Despite these variations in the living mulch sods, the total tree yields were similar across the estimated treatments (Table 5). Similarly, the presence of each grass had no influence on the trunk cross-sectional area of apple trees and the crop efficiency coefficient. There were no significant differences between the blush surface area and mean apple weight as well as the diameter of fruits produced in the investigated treatments (Table 6).
Table 4
Mean percentage of the soil surface under the perennial weed species cover with a share within the living mulch exceeding 10% at least once in spring or in summer in the years 2017–2020.
Table 5
Yield, growth, and crop efficiency coefficient of apple trees under the living mulch treatments from 2017 to 2020.
Table 6
Fruit quality of apple trees under the living mulch treatments; mean from 2018 to 2020.
| Living mulch species | % of fruit with skin blush surface area* | Mean weight of fruit* (g) | % of fruit with diameter (cm)* | |||||
|---|---|---|---|---|---|---|---|---|
| >¾ | ¼–¾ | <¼ | >8.5 | 7.5–8.5 | 6.5–7.5 | <6.5 | ||
| Blue fescue | – | 26.9 | 73.1 | 117 | 1.2 | 15.5 | 57.0 | 26.3 |
| Red fescue | – | 20.3 | 79.7 | 114 | 1.4 | 17.4 | 55.7 | 25.5 |
| Kentucky blue grass | 0.1 | 23.1 | 76.7 | 100 | – | 15.7 | 48.7 | 35.6 |
| Perennial ryegrass | 0.2 | 33.6 | 66.2 | 111 | 2.4 | 12.4 | 59.1 | 26.1 |
. Discussion
Herbicide fallow has been a common floor management method applied in tree rows in commercial orchards for many years. Two- or three-time application of herbicides during the vegetative season decreases the length of the presence of undesirable plants under fruit trees (Granatstein & Sanchez, 2009). The consciously introduced living mulch will accompany the fruit tree not only throughout the vegetation season but also during the dormancy period. The cover crop biomass should prevent or significantly hinder the development of weeds, without becoming competitive with the trees (Hammermeister, 2016). In practice, however, it is difficult to avoid the presence of weeds in the living mulch sod; therefore, an originally planned cover crop under the tree canopy will gradually diversify into a multi-species population (Licznar-Małańczuk, 2020; Licznar-Malanczuk & Slobodianyk, 2021; Tworkoski & Glenn, 2012). In the present research, after sowing the mulches in the summer of 2017, simultaneous emergence of the cover crops and weeds, mainly annual ones, was recorded in the tree rows and in the tractor alleys. The soil tillage before planting of the trees probably raised the seeds from deeper soil layers (Hammermeister, 2016). The abundance of weeds depended on the rate of tillering of the living mulch, which was well shown with the use of two contrastingly developing grasses: perennial ryegrass and blue fescue. A free space is a necessary condition for the germination of weed seeds and the development of an annual plant (Wallinga et al., 2002). For this reason, the deficit of the free space in the young perennial ryegrass sod, i.e. a species whose some varieties develop rapidly (Domański & Golińska, 2003), reduced the presence of weeds. The ratio of the soil surface area under the perennial ryegrass living mulch sod to the total weed population cover was over 1.0 from the beginning to the end of the research. Its value for the tree rows was increasing until spring 2019, when it reached a peak of 7.5. In this case, every 7.5 cm−2 of soil surface covered with the living mulch was overgrown with weeds covering only 1 cm−2. Similarly to Linares et al. (2008), who assessed the ratio of weed biomass to cover crop mass, this indicates very good protection of the soil against weeds. In contrast, the very low ratio of the soil surface area under the blue fescue to the total weed population cover indicates insufficient sod coverage and persistent dominance of weeds. In 2017–2018, this value for the blue fescue was 0.1–0.8 in the tree rows and remained below 1.0 in the tractor alleys in the next research year.
From the summer of 2018, a clear increase in the perennial species cover in the total weed population was observed in each of the living mulches. Among them, the greatest coverage was achieved by T. repens, especially in the last year of the research in the perennial ryegrass. The easy spread of this species is due to its prostrate habit and its shoots creeping across the living mulch sod (Harrington et al., 2002). The development of this weed may have resulted from the weakening of the grass sod induced by high air temperatures and insufficient precipitation in the summer of 2019. The dynamic development of T. repens in the sod of this species in the following year can be explained by the very heavy rainfall in May and June. As a species belonging to fodder plants of the Fabaceae family, Trifolium is characterized by high water requirements (Karczmarczyk & Nowak, 2007). The favorable water conditions in the orchard in 2020 facilitated a dynamic increase in the population of this weed. As in the investigation conducted by Lipińska et al. (2018), it can be concluded that the tested grasses limited the presence of other dicotyledonous weeds successfully. The ability of the living mulches to restrict the cover of Taraxacum officinale (L.) Web., i.e. a weed present in grass living mulches (Tworkoski & Glenn, 2012), was also demonstrated by the estimated living mulch, and the red fescue and Kentucky blue grass in the tree rows turned out to be the most efficient sods. Among the two grasses, the red fescue increased its dominance against weeds from year to year. This species has been studied as living mulch in various soil and climatic conditions (Hartley et al., 2000; Tworkoski & Glenn, 2012). In the present experiment, the ratio of the soil surface area under the red fescue living mulch sod to the total weed population cover still increased in the tree rows. Finally, 100% of pure sod was noted in spring 2020. In the summer of the same year, the ratio under the tree canopy was still high: 7.5 due to the re-growth of T. repens. The weed suppression between the rows by the red fescue was slightly less efficient, similar to the Kentucky blue grass.
The necessity to regulate weed infestation in orchards is crucial for the good condition of fruit trees, because high competition from weeds can have a negative impact on the growth and the yield of trees or the quality of fruit. In the cultivation of fruit trees with the use of cover plants, the presence of living mulch additionally contributes to the deterioration of the conditions for the tree growth and development (Hartley et al., 2000; Meyer et al., 1992; TerAvest et al., 2010), especially in the case of the use of dwarf rootstocks (Licznar-Małańczuk, 2012). In the present experiment, however, apple trees grafted on one of the strongest rootstocks from the semi-dwarf rootstock group MM 106 were planted. Such trees in the orchard with herbicide fallow were characterized by strong growth, but their yield and crop efficiency coefficient were lower compared to trees grafted on dwarf rootstocks (Kosina, 2010). The five-year cultivation of the ‘Chopin’ cv. on the MM 106 rootstock with the use of all the tested living mulches resulted in a low total yield of the trees. There were no significant differences in fruit quality. On the one hand, trees grafted on the semi-dwarf rootstock MM106 showed a similar degree of adaptation to the changing cultivation conditions in the different grass living mulches. On the other hand, they did not avoid competition from cover crops, which was reflected in their low yield and low crop efficiency coefficient.
. Conclusion
The rapid seed germination of perennial ryegrass and, above all, the gradual increase in the coverage of the soil surface by the spread of the red fescue contributed to effective reduction of the presence of weeds and maintenance of high purity of the grass sod. These features determine the suitability of grasses to be used as living mulches in fruit tree cultivation. It can be recommended to use a mix of red fescue with a lower amount of perennial ryegrass in order to ensure quick coverage of the soil and further durability of the fescue sod.
Trifolium repens was found to be the most competitive perennial weed in the grass living mulch. The dynamic development of this species stimulated a rapid increase in precipitation in the orchard, preceded by vegetation periods with conditions of limited water availability. The prostrate habit additionally promotes the easy spread of T. repens shoots in the grass sod.
The use of the MM 106 semi-dwarf rootstock did not reduce the negative impact of grass living mulches on the yield and the crop efficiency coefficient. The level of adaptation of trees in the conditions of competition from all the cover crops was similar, regardless of the varied share of the area covered by weeds in the sod of the four grasses.
