. Introduction
Poor nutrition, i.e., lack of food resources or unbalanced diet derivative to landscape changes (e.g., fragmentation of habitats, crop structure, lack of weeds), are indicated as key factors responsible for pollinator decline (e.g., Bożek et al., 2023). In addition to energy, whose main source is nectar, pollinators need diverse nutrients, mainly provided by plant pollen, to conduct numerous metabolic processes (Bożek, 2021; Filipiak et al., 2017). In particular, the role of pollen proteins, lipids, macro- and microminerals, vitamins, and hormones in the pollinator diet is highlighted (Lau et al., 2022). Pollen is also used by the industry (e.g., food and beverage, pharmaceutical and nutraceutical, cosmetic and personal care); therefore, the demand for this product is increasing due to the increase in social awareness of the health-related properties of bee pollen and the tendency to use healthy diets (Oliveira & Ribeiro, 2020).
In temperate climate zone, an adequate quantity and quality of early spring pollen is required to enhance honey bee colony health (Brodschneider & Crailsheim, 2010). In the agricultural landscape, Prunus spinosa L. linear or grouped shrubs are considered as non-forest woody plants with diverse ecological functions, e.g., wind barriers or food for animals (Bożek et al., 2023).
In this study, analyses of pollen production and the pollen chemical composition (total protein content, lipid content and composition, mineral element content) in Prunus spinosa L. were performed. These data can give preliminary information on the value of P. spinosa pollen for insects and for possible human use.
. Material and methods
The research was conducted in 2021–2022 on Prunus spinosa L. grown in Dąbrowica (SE Poland). The mass of produced pollen was established with the ether-ethanol method, and the total protein content was determined based on the Kjeldahl method (Denisow, 2011).
The elemental analyses were performed with the Flame Atomic Absorption Spectrometry Methodology (FAAS). Samples were mineralized in a Mars Xpress CEM (USA), and the elemental analyses were performed using a Varian SpectrAA 20FS spectrophotometer.
The determination of the composition of fatty acids was carried out using a Varian 450-GC gas chromatograph (Varian Inc., Temecula, CA, USA) equipped with an 1177 Split/Splitless injector and a SelectTM Biodiesel CP9080 for FAME capillary column (30 m; 0.32 mm; 0.25 µm) (Agilent Technologies Inc., Santa Clara, CA, USA).
The botanical composition of pollen grains in pollen loads obtained from honey bees was determined in microscopic slides (Nikon Eclipse E 600 light microscope; 40 × 15).
All statistical analyses were performed using Statistica ver. 13 (Statsoft, Poland). Analysis of variance (ANOVA) was employed to test the year effect on pollen production data. Differences were tested with Tukey’s test (p = 0.05).
. Results and discussion
In P. spinosa, the average mass of pollen produced per flower was 0.23 mg (Table 1). The value is within the range (0.11–0.37 mg per flower) established for P. spinosa by Denisow (2011). The pollen mass in the flowers differed between the years of the study. It is agreed that pollen productivity is very sensitive to environmental conditions. For example, in shrub and tree species, a drought during bud setting or spring frost can restrict flower and anther formation and pollen development (Dmitruk et al., 2022; Łotocka et al., 2023). The amount of pollen available per 1 m2 of the shrub surface differed considerably between the seasons. High differences in total pollen resource availability derivative to the alternate flowering rhythm are a known tendency in trees and shrubs (e.g. Denisow, 2011).
Table 1
Pollen production in two Prunus spp. in 2021–2022, SE Poland.
| Year | Pollen production per | |||||
|---|---|---|---|---|---|---|
| Flower (mg) | m2(g) | |||||
| min–max | Mean | ±SD | min–max | Mean | ±SD | |
| 2021 | 0.13–0.38 | 0.26b | 0.09 | 1.87–3.29 | 2.68b | 0.87 |
| 2022 | 0.15–0.24 | 0.19a | 0.04 | 0.78–3.04 | 1.29a | 0.42 |
| mean | 0.23A | 1.99A | ||||
The protein content in the P. spinosa pollen ranged between 22.1 and 34.2% (Table 2). As reported by Brodschneider & Crailsheim (2010), pollen that contains >20% of protein can be regarded as high quality pollen. Such pollen is known to be attractive for many insect pollinators (Di Pasquale et al., 2013) and is of great importance for the resistance of honey bees to diseases (Amdam & Omholt, 2002). De Sá-Otero et al. (2009) determined lower values (ca. 11–20% of proteins) in P. spinosa pollen and pointed out that the protein content in plant pollen depends on the season. This is in line with our observations, which showed that the protein content differed significantly between the years of the study. This may be related e.g., to changeable environmental conditions (weather factors, abiotic stresses) that have an impact on biochemical processes and can stimulate protein degradation (Borghi et al., 2019).
Table 2
Protein content in P. spinosa pollen and honey bee pollen loads collected in 2021–2022 in SE Poland.
| Year | Protein (%) | ||
|---|---|---|---|
| Plant pollen | |||
| min–max | Mean | ±SD | |
| 2021 | 22.1–26.8 | 24.6a | 4.1 |
| 2022 | 27.6–34.2 | 31.2b | 3.7 |
| mean | 27.9A | ||
The total lipid content in the P. spinosa pollen ranged between 2.7 and 3.6% (Table 3) and was similar to that determined by Spulber et al. (2018) in monofloral pollen of Prunus L. sp. (3.26%) collected in diverse regions of Romania. The lipids in the P. spinosa pollen were dominated by saturated fatty acids (SFAs). Our values are different from the proportion of fatty acids detected in Portuguese bee pollen in which Prunus pollen grains were detected (Feás et al., 2012). In their study, the levels of SFAs, MUFAs, and PUFAs were in the range of 13.8–30.5%, 4.6–20.6%, and 50–70%, respectively. Such disparity between crude P. spinosa pollen and bee pollen with participation of Prunus pollen may be derivative to many factors, i.e., the chemical composition of the pollen of other species present in pollen loads, the weather conditions, and the geographical region (Radev, 2018).
Table 3
Content and composition of saturated fatty acids, monounsaturated fatty acids, polyunsaturated fatty acids in P. spinosa pollen.
The presence of omega-3, omega-6, and omega-9 fatty acids was found in the analyzed pollen. Omega-3 fatty acids (e.g., α-linolenic acid, arachidonic acid) can prevent inflammation by reducing the inflammation mediators and are necessary in the honey bee diet (e.g., Yu et al., 2022).
In total, 3.333 g/100 g of fatty acids were detected in the P. spinosa pollen. Among the fatty acids, the highest amounts of oleic and elaidic (1.889 g/100 g), palmitic (1.444 g/100 g), stearic (0.684 g/100 g), and myristic (0.483 g/100 g) acids were recorded. Oleic acid is important during oxidative stress, acting as an antioxidant (Hu et al., 2022). Pollen with high levels of oleic and palmitic acids is regarded to play a significant role in honey bee nutrition (Manning, 2001).
The predominant mineral was potassium, followed by calcium and magnesium. Spulber et al. (2018) reported that samples with a high proportion of Prunus pollen originating from Romania exhibited a higher amount of magnesium (666.7 ± 1.05) than potassium (4073 ± 3.21). In our analyses, a high amount of Fe was documented, followed by Zn, Mn, and Cu. Iron-rich Prunus sp. pollen was also reported by Spulber et al. (2018), however, the Fe content in their analyses was almost 3-times higher (150.9 ± 1.11 mg/kg). As shown by Filipiak et al. (2017), the proportion of elements in the insect pollinator nutrition is of great importance for stoichiometrically balanced diets.
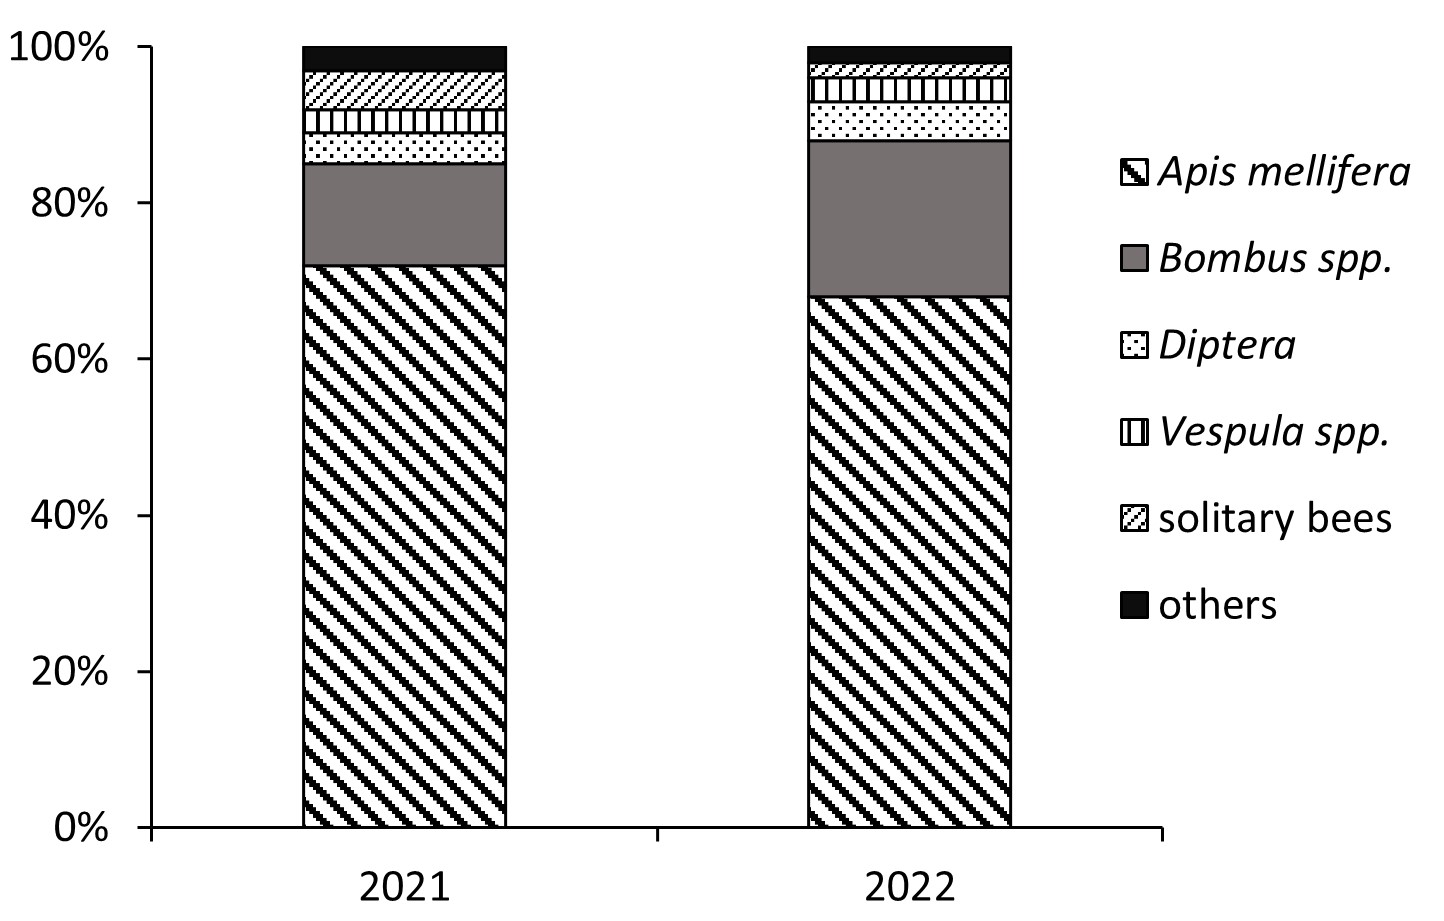
We observed honey bees willingly collecting pollen from P. spinosa flowers. In both study years, the honey bees predominated and accounted for 68–72% of all insect visitors (Figure 1). Our observations of the high attractiveness of P. spinosa pollen were confirmed in analyses of botanical pollen loads. Pollen loads may contain 89.1–98.2% of Prunus pollen. Prunus pollen constitutes an important ingredient of bee pollen (Bobis et al., 2010; Ceksteryte et al., 2013). It was also found as the primary pollen source for honey bees and wild bumblebees in Michigan (Graham et al., 2023), which indicates its dietary importance irrespective of the geographical region of the temperate zone.
In conclusion, P. spinosa should be recommended for planting in the agricultural landscape in order to support the early spring diet for pollinators.
