. Introduction
Rye (Secale cereale L.) is an invaluable species in crop rotation, increasing the species diversity of crop plants, mainly in European agroecosystems (Dörthe et al., 2013; Schittenhelm et al., 2014). This cereal is a multipurpose crop traditionally used to produce bread or livestock feed. It is also considered an excellent raw material for bioenergy production (Brzozowski et al., 2023; Moitzi et al., 2021; Rusche et al., 2020). It is considered more tolerant of unfavourable phytosanitary soil conditions than winter wheat. For this reason, rye is grown mainly on the infertile and sandy soils of Central and Eastern Europe, which have low water-holding capacity. Rye is relatively resistant to drought compared to other cereals (Haffke et al., 2015). As a basic cereal for bread, it is grown in temperate and cool regions of the northern hemisphere, where it competes with wheat, which has greater soil and climate requirements (Brzozowski et al., 2023). The global area of rye cultivation is currently only 5 mln ha, which is only 0.7% of the area sown with cereals (FAOSTAT, 2022). Rye cultivation can be considered extensive, as the average grain yield per ha is 3 Mg ha−1. Global harvests amount to only 14 million tonnes (Schittenhelm et al., 2019).
In Europe, hybrid rye breeding has been growing since the 1980s. It has the higher yield potential typical of hybrids, and its grain has a modified chemical composition. The grain of hybrid rye cultivars has reduced content of anti-nutrients compared to open-pollinated cultivars, which has led to an increase in its use in the diet of monogastric animals (Kucerova, 2009; Schwarz et al., 2015). Since the 1990s, the proportion of hybrid cultivars in the crop structure of cereals has systematically increased. In Western Europe (Germany), the ratio of hybrid rye to open-pollinated rye in 1994 was 40:60 (Seibel & Weipert, 1994), but since 2014 the proportions have changed, and hybrid rye currently accounts for 81%. However, the share of open-pollinated cultivars differs significantly between regions; for example, in the federal state of Brandenburg, with very sandy soils of low fertility, open-pollinated cultivars account for 32% of the area of rye crops, in contrast to only 9% in Lower Saxony (Muenzing et al., 2014).
The main object of breeding work on rye is to increase yield potential and stability, to increase resistance to drought, lodging, and fungal diseases, such as ergot and Fusarium ear blight, and to improve grain quality, i.e. protein and starch content, thousand grain weight, and the technological value of the flour (Linina et al., 2019; Podolska & Aleksandrowicz, 2019). Breeding work is conducted to increase the yield potential and stability of rye due to changes in consumer preferences, who have taken note of the flavour attributes of rye, and to changes in the yield of other dominant cereal species (Podolska & Aleksandrowicz, 2019). Contemporary rye varieties, especially hybrid cultivars, have high production potential and fodder value, confirmed by a growing body of research, which means that it can compete with other traditional concentrate feedstuffs (Hansen et al., 2004; Miedaner & Huebner, 2011; Schwarz et al., 2015). New hybrid rye cultivars are beginning to dominate over traditional ones. This trend is observed in Germany and in Denmark. In Poland, the cultivation area of hybrid cultivars is increasing from year to year as well (OECD-FAO, 2023 Agricultural Outlook Report 2021–2030).
Cereals are major food crops worldwide (e.g., Korotkova et al., 2021). According to OECD-FAO (2023) prognoses, the global consumption of cereals will increase by 14% relative to the current level by 2027, mainly due to an increase in the demand for food and feed in developing countries. At the same time, the use of wheat for fodder is expected to increase mainly in China, Russia, and the UE-28 (Nowak, 2020). Given the prognostic models of stagnation or a decline in wheat yield due to climate warming expected in the coming years (Kristensen et al., 2011), the production of fodder containing wheat should be limited. An alternative is cultivation of winter cereal mixtures based on rye or triticale, which have a similar chemical composition to that of wheat but are more resistant to unfavourable growing conditions (Laidig et al., 2017). Cultivation of mixtures of winter cereals in agricultural practice as an innovative solution in field crop production will help to improve cereal crop technologies (Klimek-Kopyra et al., 2017). In current agroclimatic conditions, implementation of this solution (mixtures of winter cereals) is expected to lead to significant progress in increasing yield per unit area. Implementation of the principle of biodiversity, which itself drives production progress, will make it possible to obtain better yield without increasing outlays, which should lead to stable, high yields from year to year. However, the productivity and yield of these mixtures must be verified experimentally in comparison to sole cropping, which remains the leading solution in agriculture. The agricultural literature does not contain information on mixed cropping of winter cereals – hybrid rye with open-pollinated triticale. The main goal of such mixed crops may be to produce fodder grain or material for the production of bioethanol as an alternative to cultivation of four cereals in single-species crops or maize for grain. The need to implement effective new agroecological technologies for cereal crop production adapted for specific habitat conditions requires time and ideas. Good innovative ideas arise from analysis of the techniques applied thus far in relation to the production results obtained. Quantitative and qualitative verification of achievements currently applied in crop production in central Europe indicates that winter cereals can be grown in the form of simple two-species mixtures, with varied proportions of the components (Klimek-Kopyra et al., 2017; Zając et al., 2014). These mixtures can be expected to have yield potential at the level of maize, but with greater yield stability and lower cultivation costs.
The use of mixtures of winter cereal crops in which one component is a hybrid cultivar has not yet been investigated. Therefore, the aim of the study was to verify the hypothesis that hybrid rye as a component of a crop mixture will increase the productivity and yield stability of winter cereal mixtures.
. Materials and methods
Experimental location
The field experiment was carried out in three consecutive growing seasons 2014/15–2016/17 at the Experimental Station in Prusy (47°24′N, 7°19′E, 300 m a.s.l.), south-eastern Poland. The experiment was set up on black loess soil with varied content of available forms of elements (phosphorus – moderate, potassium – low, magnesium – high). The humus layer of the soil (0–30 cm) had a slightly acidic reaction (pH in KCl – 6.0–6.2) and medium content of humus.
Experimental design
A two-factor field experiment was set up with a random block design in triplicate. The area of the experimental plots was 15 m2. The experimental factors were the species (winter triticale, winter rye) and the cropping system (pure, mixed). Table 1 lists the eight experimental treatments, of which four involved sole cropping of winter cereals (P - hybrid rye cv. Palazzo; A - open-pollinated rye cv. Amber; B1 - triticale cv. Borwo, with high yield potential; and B2 - triticale cv. Borowik, with very high yield potential). The other four treatments were two-species mixtures of rye and triticale selected to have different height (short straw and long straw) and breeding type (hybrid vs. open-population). The winter wheat mixtures were composed of species with similar development, and thus P and A were sown in mixtures with B1 and B2. The mixtures included cereal species (P and B2) with grain of high fodder value as quality promoters, while A and B1 were species with less strict soil requirements and high tolerance for growth in suboptimal conditions, meant to improve the quantitative yield of the mixtures.
Table 1
Comparison of experimental treatments taking into account the growing season (2014/15, 2015/16, 2016/17), species and cultivars of winter cereals, sowing density and date, fertilization (pre-sowing, top dressing, and foliar), and harvest dates.
Table 1 shows the sowing and harvest dates, selection of cultivars, and levels of fertilizer application, i.e., pre-sowing and top dressing (nitrogen), as well as foliar application of microelements and insecticides. The multi-component fertilizer Blend Max was applied before sowing as a source of NPK. No fungicides or growth retardants were used in order to avoid masking the interactions of the species growing together, depending on the cropping system – sole cropping (intraspecific competition) or mixed cropping (interspecies competition). After harvest of the previous crop, i.e., afila pea grown for dry seeds, skimming was carried out at a depth of 10 cm, followed by harrowing. Medium ploughing took place at the beginning of September, and was immediately followed by harrowing to prevent the formation of large clods (diameter > 3 cm). The pre-sowing portion of fertilizer was mixed with soil to a depth of 7 cm with a heavy harrow. The field experiment was conducted in triplicate. The size of each plot was 15 m2 (10 m × 1.5 m). Each plot had 10 rows with 12.5 cm spacing. Treated grain (Oxafun T 75 DS/WS 200 g 100 kg) was sown with an Oyjard plot drill to a depth of 4 cm. After sowing, the plot was harrowed with a light harrow. The multi-component fertilizer Blend Max was applied as a pre-sowing mineral fertilizer. In spring, nitrogen in the form of ammonium nitrate was applied as top dressing in two portions – the first immediately after the resumption of vegetative growth and the second at the stem elongation stage. Immediately after harvest, the proportions of rye, triticale, and other plants were determined in samples of seeds from the plots. Next, the moisture level was determined in separated seed samples (rye and triticale) using an Asonik moisture meter. The yield of rye and triticale grain was given at 15% moisture content.
At the waxy stage (BBCH 85), spike density was determined in the canopy in order to calculate the plant density before harvest. From each plot, 30 stems were randomly collected for each taxon. Stems of the cereals were collected at the soil level. Samples of the plants were dried in a dry, shaded place, and biometric measurements were made. The length and weight of the culm and spike, the number of spikelets per spike, and the weight of grain per spike were determined. In each spike, the number of grains and their weight were determined, and the harvest index (HI) was calculated using the formula presented by Donald and Hamblin (1976), defining the proportion of grain in the biomass of the shoot (g g−1).
Statistical analysis
Analysis of variance was performed separately for each year of the experiment. Significantly different values were tested using Tukey’s test at p = 0.05.
Four methods of calculating yield stability
Standard (CV) and adjusted coefficient of variation (aCV)
The standard coefficient of variation (CV) is defined as:
where σ is the standard deviation and µ is the mean of the yield (Döring & Reckling, 2018).
For a subset of data, a list of means (
A power-law relationship between the sample variance σ2 and the sample mean µ, known as Taylor’s Power Law (TPL), was revealed in 1961 by Roy Taylor. It was first tested for insect groups, earthworms, plant viruses, and fish, and subsequently its validity was also tested for crop yield (Döring et al., 2015).
TPL may be written as follows:
Its logarithmic transformation gives us the following linear relationship:
where a = log(A).
Another method to quantify yield stability, i.e., adjusting the standard CV such that the dependence on the mean yield is removed, was presented by Döring and Reckling (2018). The adjusted coefficient of variation was defined:
where:
The linear regression parameters were taken from the following equation:
Expected and observed variabilities
The expected yield variability was measured as the variability of the mixture components growing separately as sole crops, as a sum of their total yields divided by two (Weih et al., 2021):
where YC1 is the yield of the first cereal component grown as a sole crop, and YC2 is the yield of the second cereal component grown as a sole crop.
The observed yield variability for crops with a 50:50 mixture (intercrop) of two components was measured as the sum of the crop components:
where Y1mix is the yield of the first cereal component and Y2mix is the yield of the second cereal component.
Stability Index aCV (SIaCV)
The adjusted coefficients of variance (aCV) were calculated for three growing seasons, 2014/15, 2015/16, and 2016/17, and for each sole crop or species combination according to Equation (3) (Döring & Reckling, 2018). The slope b of Taylor’s Power Law (TPL) was determined based on the data set for all treatments for each growing season. Expected and observed aCV values were computed using corresponding values of Yexp and Yobs from each growing season and each cereal mixture to obtain the stability index (SI) equation:
when SIaCV > 1 the stability of the intercrops is greater (or the variability is smaller), and when SIaCV < 1 the stability of the crops grown separately is greater. The SIaCV index gives us a comparison of yield variability between the case of the same crop plants as sole crops or intercrops (in otherwise identical conditions).
Stability IndexDelta (SIDelta)
For each cereal mixture, expected and observed absolute yield differences (Delta) for 2014/15, 2015/16, and 2016/17 were calculated. Means of the expected and observed yield differences were computed for all crop types to obtain an index expressing temporal stability:
When SIDelta > 1 the temporal (year-to-year) stability of the intercrops is greater, whereas for SIDelta < 1 the temporal stability of the crops grown separately is greater. The absolute value of the year-to-year yield differences depends on year-to-year differences in weather conditions. SIDelta provides information about year-to-year yield variability for the same mixtures grown in similar local weather conditions. The SIDelta values are presented in Table S2.
. Results
Environmental conditions
According to data from the weather station located at the Experimental Station in Prusy, the weather conditions during the experiment were variable (Figure 1). The average annual precipitation total from 2015 to 2017 was 658.3 mm, which 18.2 mm higher than the 30-year normal (640.1 mm). Precipitation in the months of vegetative growth of the crops (March–August) was most similar to the long-term average (369.3 mm) in 2016, when it amounted to 349.4 mm. According to Dzieżyc et al. (1987), the water requirements of rye and triticale (in the months from the start of vegetative growth to harvest) are on average 340 mm and 300 mm, respectively.
Figure 1
Weather conditions (A - precipitation, B - air temperature) in the years 2015–2017 (according to the Meteorological Station belonging to the Experimental Station of the Department of Plant Production and Agroecology in Prusy, SE Poland).
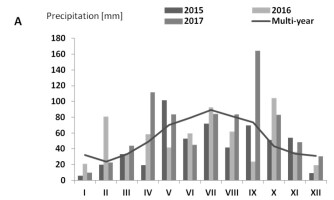
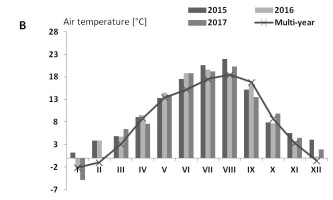
The comparison of the average precipitation totals from each year of the experiment with the water requirements of rye and triticale revealed that the conditions in 2016 were the closest to the optimal conditions for their growth. The air temperatures in March–June were about 2–3° higher than the long-term average. The first year of vegetative growth (2015) was the warmest and was relatively dry compared to the long-term average, which resulted in low yield of the cereal crops. Optimal temperature conditions were recorded in 2017, which was the most similar to the long-term average.
Biometric analysis
The effect of the selection of cultivars on biometric traits is presented in Tables 2 and 3. The culm weight and length were influenced by the selection of cultivars and by the cropping system. On average for the three years of the study, sowing of the hybrid rye cultivar Palazzo (P) with short straw in a mixture with the long-straw Borowik cultivar of triticale (B2) reduced the average culm length and spike length by 4–6% and spike weight by 13.7% in the rye. In contrast, in the mixture of the hybrid rye Palazzo (P) with the short-straw Borwo triticale (B1), there was an increase in the culm length, culm weight, and spike weight of rye. Sowing the open-pollinated rye cv. Amber (A) with long straw in a mixture with the long-straw Borowik triticale (B2) or the short-straw Borwo triticale (B1) increased stem elongation and the culm weight of the Amber rye relative to sole cropping. The drought in 2015 negatively influenced the development of rye shoots of the two cultivars and thus limited the development of the plants.
Table 2
Culm weight and length of winter cereals in pure and mixed stands in different growing seasons.
Table 3
Spike weight and length of winter cereals grown in pure and mixed stands in different growing seasons.
The parameters used to characterize the yield were spikelet number per spike, grain number per spike, and weight of grain per spike (Table 4, Table 5). These parameters were strongly influenced by the cropping system and the weather in each year. There was a non-significant increase in spike parameters (spikelet number per spike and grain number per spike) in the mixture of the hybrid rye cultivar with the short-straw triticale cultivar (P-B1) relative to the pure Palazzo crop. The mixture composed of an open-pollinated cultivar with a long-straw cultivar (A-B2) significantly increased the spikelet number and grain number per spike relative to rye grown separately. In the dry year 2015, the cultivation of the hybrid Palazzo cultivar in a mixture with the short-straw Borwo significantly increased the spikelet number per spike, while the productivity of the spike was at the same level as in the Palazzo crop grown separately. In the wet year 2016, the cultivation of the Palazzo rye cultivar in a mixture with Borwo significantly reduced grain weight per spike, compared to growing this cultivar separately without a companion crop (Table 5). In such weather conditions, only the Amber cultivar benefited from the mixture with a triticale cultivar (Borowik or Borwo), with a significant increase in grain weight per spike.
Table 4
Comparison of selected yield parameters of winter cereals grown in pure and mixed stands in different growing seasons.
Table 5
Comparison of selected yield parameters of winter cereals grown in pure and mixed stands in different growing seasons.
The harvest index (HI) value depended on the choice of cultivars and on the weather conditions in a given growing season (Table 5). In the first year, the favourable weather conditions were a factor increasing the harvest index of rye in mixed crops, while the second year was more favourable to crops grown separately. The choice of the cultivar in the mixture significantly influenced the HI value. The open-pollinated rye cultivar Amber significantly improved in the mixture with triticale, while there was a non-significant decrease in the harvest index of the Palazzo hybrid cultivar.
Seed yield
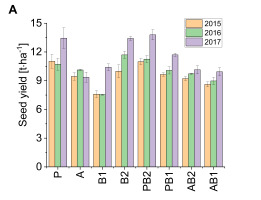
The seed yield for the sole crops of Palazzo, Amber, and Borwo rye as well as for each of their mixtures was analyzed for three years of harvest: 2015, 2016, and 2017 (Figure 2). The highest yield of the both sole crops and the mixtures was observed in 2017. The only exception was the Amber variety of rye, where the yield was slightly higher in 2016. The hybrid Palazzo rye (short straw) grown in a mixture with the long-straw triticale (B2) was more productive in 2015 and 2016 than the mixture of Palazzo with the short-straw triticale (B1). The reverse was noted for the open-pollinated rye. The cultivation of the open-pollinated (long-straw) Amber with long-straw triticale B2 resulted in higher production than the cultivation with short-straw triticale B1.
Figure 2
Means for three years: 2015, 2016, and 2017 (A) and three-year average (B) of seed yields for sole crops and mixtures. Cereal varieties: P = Palazzo; A = Amber; B1 = Borwo; B2 = Borowik; PB2 = Palazzo & Borowik mixture; PB1 = Palazzo & Borwo; AB2 = Amber & Borowik; AB1 = Amber & Borwo.
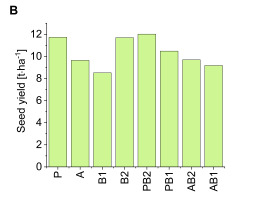
The three-year average of the seed yields for the sole crops and for each of the mixtures is presented in Figure 2B. The highest yields were recorded here for the Palazzo & Borowik (PB2) mixture (Y = 12.01 [t ha−1]), followed by the same species grown separately: the Palazzo crop (Y = 11.73 [t ha−1]) and the Borowik crop (Y = 11.70 [t ha−1]). The lowest yield was recorded for the Borwo variety of triticale (Y = 8.513 [t ha−1]).
Standard (CV) and adjusted coefficient of variation (aCV)
As the crop yield had a wide range of values, the parameters of Taylor’s Power Law (TPL) were calculated and presented in Table S1 (Supplementary material) for the sole crops and mixtures.
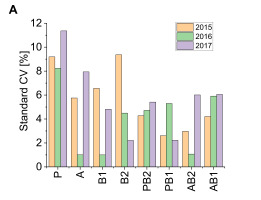
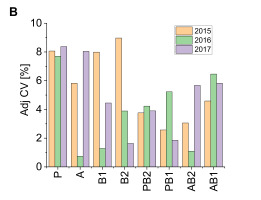
The standard and adjusted coefficient of variation (% CV) for the sole crops and mixtures determined for 2015, 2016, and 2017 are presented in Figure 3. Lower CV values indicate higher yield stability. The analysis showed that the intercropping (CV = 1–6%) significantly increased yield stability compared with the sole crops of the same cultivars. Yield stability also depended on weather conditions. Lower stability was noted for mixtures with open-pollinated rye cultivars compared with hybrid cultivars. The adjusted coefficients of variation (aCV) indicated that the yield was more stable in the mixtures with the hybrid variety (Figure 3B).
Figure 3
Standard (A) and adjusted (B) coefficient of variation (CV) for sole crops and mixtures and for the three years of harvest: 2015, 2016, and 2017. Cereal varieties: P = Palazzo; A = Amber; B1 = Borwo; B2 = Borowik; PB2 = Palazzo & Borowik mixture; PB1 = Palazzo & Borwo; AB2 = Amber & Borowik; AB1 = Amber & Borwo.
Stability Index aCV (SIaCV) and Stability IndexDelta (SIDelta)
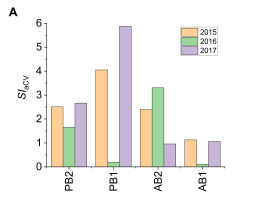
The yield Stability Index aCV, which provides information about yield stability across the years, was higher than one for the PB2 PB1 and AB2 mixtures (Table S2, Supplementary material, Figure 4A), indicating greater stability of the intercrops compared to the sole crops (Figure 4A). The exception was the AB1 mixture, for which SIaCV was much lower than 1: SIaCV = 0.143.
Figure 4
(A) Stability index aCV (SIaCV) calculated separately for each year (2015, 2016, and 2017); (B) Stability Index (SIDelta) between the three years 2015, 2016, and 2017. Cereal mixtures: PB2 = Palazzo & Borowik; PB1 = Palazzo & Borwo; AB2 = Amber & Borowik; AB1 = Amber & Borwo.
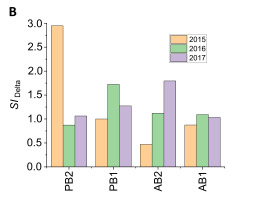
The yield Stability Index Delta (SIDelta), which provides information about yield stability across the years, depended on the mixture components and the year (Figure 4B). According to Weih et al. (2021), for SIDelta > 1 the temporal (year-to-year) stability of intercrops is greater, whereas for SIDelta < 1 the temporal stability of crops grown separately is greater. The SIDelta was higher than 1 for all mixtures (Figure 4B; Table S2, Supplementary material), indicating greater stability of the intercrops compared to the sole crops. An exception was the Amber & Borwo mixture, for which the value was much lower than 1: SIDelta = 0.47. The highest value was obtained for the Palazzo & Borowik mixture: SIDelta = 2.95.
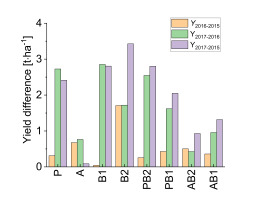
The yield differences between the three years 2015, 2016, and 2017 for the sole crops and each of the mixtures are presented in Figure 5. The greatest differences were generally observed between the years 2017 and 2015, with substantial differences in rainfall. The exceptions were the Amber variety, where the difference was the smallest, and the Palazzo and Borwo varieties, where greater differences were observed between 2017 and 2016. The smallest differences were generally observed between 2016 and 2015.
Slope of expected vs. observed yields
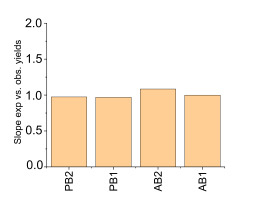
The stability of grain yield was analyed using linear regression Yexp against Yobs for each crop mixture (Figure 6), with a comparison of the slopes of the regression coefficients (for intercept value = 0) in a similar approach to that reported by other authors (Weih et al., 2021). Slope values less than 1 were obtained for the Palazzo & Borowik, Palazzo & Borwo, and Amber & Borwo mixtures, suggesting higher mean grain yields in the intercrops (observed yield) compared to the corresponding two sole crops (expected yield) across the three years 2015, 2016, and 2017 (Table 6).
Figure 6
Slopes for linear regressions of expected vs. observed yields. Cereal mixtures: PB2 = Palazzo & Borowik; PB1 = Palazzo & Borwo; AB2 = Amber & Borowik; AB1 = Amber & Borwo.
. Discussion
Different approaches for measuring yield stability have been taken in research on intercropping (Reckling et al., 2021; Weih et al., 2021; Yildirim et al., 2020). Most research has concerned mixtures of spring crops – cereal–legume or cereal mixtures (Karbivska et al., 2020). The main challenge in growing multi-species crops is to select species that will ensure high yield stability in weather conditions that vary from year to year (Stomph et al., 2020). As shown by Czarnocki et al. (2013), inappropriate proportions of winter cereal species are still found in mixed crops due to the lack of clear answers provided by research. In this study, we used four different indices to confirm our hypothesis that a hybrid cultivar of rye enhances the productivity and yield stability of a cereal mixture. Rye productivity depended on the cultivar used in the mixture and on weather conditions. The hybrid rye cultivar produced higher yield than the open-pollinated cultivar in both sole and mixed cropping. The analysis of the unit productivity of rye shoots revealed the high plasticity of the hybrid rye, resulting in much better spike development in the mixture with triticale than in sole cropping in the wet years. In the dry year, the morphotype of the two species in the mixture was a significant factor. The mixture composed of two short-straw cultivars, the hybrid rye and the open-pollinated triticale, was more productive in the year with unfavourable weather conditions (soil drought) than the mixture of open-pollinated cultivars with different straw length. A similar phenomenon was observed in the mixture with the open-pollinated rye cultivar. In the year with unfavourable weather (lack of water), better production effects were obtained in the mixture composed of two long-straw cultivars. A change in the mixture components to a long-straw open-pollinated cultivar of rye with short-straw triticale resulted in high yield of the mixture only in the wet years. A decisive factor was probably the intraspecific competition, which was stronger in the canopy with different plant heights in the dry year. A similar study on selection of cultivars for cereal mixtures was conducted by Zając et al. (2014). The authors demonstrated that winter mixtures are more productive than sole cropping in suboptimal environments such as drought or excessive rainfall. In addition, successful production may be determined by the correct choice of cultivars. The convergence effect of short-straw cultivars (PB1 mixture) was confirmed in our study, as a significant increase in stem elongation (including the spike) and in spike weight was observed in both cultivars relative to these cultivars grown separately.
The overall productivity of the plants expressed as grain yield confirmed that the inclusion of hybrid cultivars of rye in cereal mixtures is justified. As expected, the hybrid rye cultivar produced higher yield in sole cropping than the open-pollinated cultivar, which was maintained and even increased in the mixture with triticale. The mixture of hybrid rye and Borowik triticale produced a yield of 12 t ha−1. Replacing hybrid rye in this mixture with open-pollinated rye reduced the yield by 3 tonnes.
The yield stability of the mixtures was a combined result of the selection of cultivars and the weather. In mixtures of two species with similar stem length, it was easier to achieve yield stability even in the dry years. This is in conflict with other research results indicating that the species biodiversity of plants in a mixed canopy determines the productivity of the mixture. In our study, we not only tested mixtures that differed in their habit (stem length), but also compared cultivars of different genetic types (open-pollinated vs. hybrid).
. Conclusions
The mean crop yields (computed for three years) were higher in the intercrops (observed yield) than the mean yield of the corresponding two sole crops (expected yield). The highest yield was observed for the hybrid rye in a mixture with the triticale cultivars Borowik (12.01 t ha−1) and Borwo (11.69 t ha−1). The smallest yield was observed for the open-pollinated Amber rye in the mixture with Borowik (9.18 Mg ha−1).
The yield SIaCV, which provides information about yield stability across years, was higher than 1. The Palazzo hybrid rye grown in a mixture with triticale (cv. Borowik or cv. Borwo) showed higher yield stability than the open-pollinated Amber cultivar. In contrast, for the open-pollinated rye cv. Amber in combination with the triticale cv. Borowik, the yield stability was low (SIaCV < 1), mainly due to the value of this index calculated for 2016. SIDelta was also higher than 1 for these mixtures. An exception was the mixture of the open-pollinated rye cv. Amber with the triticale cv. Borowik, in which SIDelta = 1.
When analyzed separately for three years (2015, 2016, and 2017), SIaCV values of >1 were found in most mixtures, indicating higher yield stability in the intercrops. Exceptions were Palazzo & Borwo (2016), Amber & Borwo (2016), and Amber & Borowik (2017).
SI delta analyed separately for each year was >1, indicating greater temporal (year-to-year) stability of the intercrops compared to the sole crops.
The use of hybrid cultivars of rye in winter cereal mixtures mixture is justified by the increased yield stability compared to that of open-pollinated cultivars. The use of hybrid rye as a component of mixtures should be recommended in agricultural practice, as it shows higher productivity and greater yield stability than open-pollinated cultivars.

