Introduction
In addition to good nutritional composition and taste, foods that consumers demand should have ingredients that have certain key physiological functions in the body. One of the most valuable cultivated species is the sweet potato. Indonesia is one of the centers of origin of sweet potatoes, whose cultivation has spread to nearly all regions of the world.
According to Waluyo et al. (2013), sweet potato is one of the potential valuable food products to be developed more intensely, given that the sweet potato has high nutritional value and is easy to process. The main benefit of functional foodstuffs is the health benefits for the body.
The development of sweet potato in Indonesia requires serious attention because both the area of cultivation and the yield are fluctuating, with average productivity currently at 15–20 tons/ha of tubers. In contrast, research has shown that the potential yield of sweet potato tubers is as much as 30 tons/ha or more (Balitkabi, 2010). As an improvement effort, the Indonesian Legumes and Tuber Crops Research Institute (Balai Penelitian Tanaman Kacang-Kacangan dan Umbi-Umbian – Balitkabi), has released 23 superior varieties of sweet potato.
Some of the purple varieties that have been released by Balitkabi are Antin-1, Antin-2, and Antin-3 (Balitkabi, 2015). These three varieties contain anthocyanins and different dry ingredients. Anthocyanins are one of the secondary metabolites present in the purple sweet potato, which is beneficial to human health. The anthocyanin content of Antin-1 is 7.96 mg/100 g fresh weight and the potential yield is 33.2 tons/ha. Antin-2 has a high yield potential, 37.1 tons/ha, and an anthocyanin content of 130.19 mg/100 g and the dry ingredients of the tubers is 32.6% by weight. The potential yield of Antin-3 is 30.6 tons/ha and it has very high anthocyanin content, 150.67 mg/100 g, and dry matter content of 29.7% (Ginting et al., 2015).
Sweet potatoes are a good source of naturally healthy food and high-quality food coloring (Mervat & Hanan, 2009; Truong et al., 2010). In Japan, a number of sweet potato products have been developed, such as natural dye foods, juice, bread, noodles, jam, fermented soft drinks, and sweets. In Indonesia, chips, pudding, wet cakes, and pastries made from sweet potatoes have been widely produced (Montilla et al., 2010).
In sweet potatoes, the tuber development phase starts from tuber initiation at 4–8 weeks after planting (WAP), tuber filling at 8–12 WAP, and tuber ripening at 12–17 WAP (Goswami et al., 1995). It has been shown that an increase in shoot weight is to some extent positively correlated with tuber weight increase (Ravi & Saravanan, 2012). Moreover, the anthocyanin accumulation may decrease or increase at a certain age according to the pattern of starch formation and changes in dry matter content (Yoshinaga et al., 2000).
Given that the sweet potato is adapted to grow between 0 and 3,000 m above sea level (m a.s.l.), it is necessary to determine the best crop locations in which tuber production can be maximized. Altitude affects the temperature of the air: Every increase of 100 m a.s.l. in altitude decreases the temperature by 0.5 °C. According to the Food and Agriculture Organization (FAO, 2008), maximal tuber formation occurs at 25 °C at night, along with anthocyanin formation. Based on the research of Kathabwalika et al. (2013), there are significant differences in node length, growth rate, leaf area, and tuber yield among the genotypes grown at three different altitudes.
The cultivation of sweet potatoes at temperatures of approximately 15–33 °C is required for vegetative growth, with the optimum temperatures being between 20 and 25 °C. Low temperatures during the night support tuber formation, and high temperatures during the day support vegetative development. The development of tubers only occurs at approximately 20–30 °C, with the optimum temperature being 25 °C, and generally stops when the temperature is below 10 °C (FAO, 2008). In the most ideal areas for sweet potato cultivation, the temperature should range from 21 to 27 °C, with an 11–12-hr photoperiod. Optimal growth and production of sweet potatoes are achieved in the dry season.
Because the soils of the North Sumatra region generally have low to medium K+ content, potassium application is needed to meet the requirement of crops for this macronutrient (Sofyan et al., 2005). The research of Wang et al. (2013) confirmed that potassium is an important element that affects most of the biochemical and physiological processes in plants, especially under stress. This macronutrient plays a number of important roles, including the improvement of the photosynthesis process. He et al. (1992) reported a significant increase in the amount of K > 4% leaf dry matter, and they demonstrated that the presence of K+ increases the rate of translocation of assimilates from the leaves, thus accelerating the activity of photosynthesis. Deficiency of this element will cause a significant disturbance in the effective crop production.
The capability of tuber production is closely related to the availability of N, P, and especially K to assist in tuber formation and glucose accumulation, in which the starch synthase enzyme is activated by K+, making the tuber flesh sweeter. According to Hell and Mendel (2010), potassium is an essential element that has functions related to enzyme activation, osmotic adjustment and turgor generation, electric membrane potential regulation, and cytoplasmic pH homeostasis. K+ is absorbed by the roots, redistributed among plant tissues and organs, and then stored in large quantities in vacuoles. It is the most abundant inorganic cation in plants, accounting for up to 10% (approximately) of its dry weight. Therefore, intensive research is needed on the morphological, physiological, and biochemical changes induced by potassium treatment at different temperatures induced by altitude above sea level.
Material and Methods
Conditions and Material
The research was conducted from January to June 2017, at two locations selected based on average temperature average: lowland 40 m a.s.l. (26.8 °C) and highland 1,440 m a.s.l. (19.2 °C). The design of the research was nested factorial design. The first factor was temperature: T1 (lowland) and T2 (highland). The nested factor was fertilization with potassium (K2O) of the following doses of K: K0 (0 kg/ha), K1 (50 kg/ha), K2 (100 kg/ha), and K3 (150 kg/ha).
Material for the study were sweet potatoes (Ipomoea batatas L. var. Antin-1) with white-purple (scatter) tuber. The reagents used were: ethanol p.a., glacial acetic acid, sodium acetate p.a., potassium chloride p.a., methanol p.a., distilled water. We utilized a Perkin Elmer UV/VIS Lambda 25 spectrophotometer and a Brix refractometer model A.
Procedures
Sweet potato seedlings were planted in 6-m-long mounds with a spacing of 30 cm. The number of plants per mounds was 22. The seedlings in the lowland location were planted in soil of the inceptisol type on January 18, 2017 and harvested on June 14, 2017. At the highland location, seedlings were planted in soil of the andosol type on January 19, 2017 and harvested on June 30, 2017. The plantings were fertilized with potassium at doses of 0, 50, 100, and 150 kg/ha of K2O. There were two destructive samples to verify at 4, 7, 10, 13 WAP.
Plant height was measured from the base of the stem to the end of the main stem, and the diameter was measured using a digital caliper approximately 5 cm from the base of the main stem. Leaf area (A) was calculated from the measurements of the length (L) and width (W) of a leaf and leaf constants (b). The equation is:
The relative growth rate (RGR) is influenced by the dry weight of the plant in the previous week (W1) and thereafter (W2), which was collected by destructive sampling every 3 weeks (T1, T2):
The net assimilation rate (NAR) is influenced by the dry weight of the plant in the previous week (W1) and after (W2), and the leaf area in the previous week (A1) and after (A2) which was collected by destructive sampling every 3 weeks (T1, T2):
The harvest index is calculated by:
Anthocyanin and Glucose Assays
We analyzed anthocyanin content by using the pH differential method (Giusti & Wrolstad, 2001). Sweet potato tuber meat (5 g) was shredded until smooth and then extracted by adding up to 25 mL methanol solvent containing 1% HCl for 24 hr. The extract was then filtered with filter paper. The filtrate was evaporated to form a thick extract of sweet potato tuber (as much as 5 mL). The extract was identified by a comparison method of pH 1 and pH 4.5. The sample extract was added to a pH solution at a ratio of 1:9. All samples were analyzed by UV-VIS spectrophotometer (Perkin Elmer Lambda 25) with a measure of absorption at 520 nm and 700 nm.
The total anthocyanin content in sweet potato tuber meat was calculated based on the absorbance of the solution (A) affected by a molar extension coefficient (ε) of 26,900 (based on the molar extension coefficient of cyanidin-3-glucoside), molecular weight (MW) of 449.2, dilution factor (DF), and thick of cuvette 1 cm (l).
The monomeric anthocyanin concentration is expressed as CyE (cyanidin-3-glucose equivalent) per gram of dry matter of the sample. Furthermore, monomeric anthocyanin was calculated by the following equation (Li et al., 2013):
The total soluble solids (TSS) or sugar content was measured by a 0%–32% Brix refractometer model A (SKU: WH947HLAAKEGI0ANID-44419386). Shredded tuber meat (2.25 g) was added to 3 mL distilled water, and the liquid sample was then dropped on the refractometer. By pointing the refractometer at a source of direct light one can see the refraction number through the eyepiece.
Results
Diversity in Plant Morphology
Plant growth is influenced not only by genetics but also the environment. The morphological and anatomical diversity of plants is strictly influenced by temperature. Based on the research of Nedelkovski et al. (2018) on grapevine, we assumed that sweet potato also sustains morphological, biochemical, and tuber yield changes due to differences in environmental factors, especially temperature, irradiation, and altitude. The differences in annual weather conditions between lowlands and highlands, average temperatures, and rainfall (Climate-Data.org, 2017) are presented in Table 1.
Table 1
Selected annual weather conditions in Medan-Johor and Berastagi locations.
The differences in the plant morphology between the two areas studied are presented in Table 2. The vegetative growth of the plants at the lowland location, with a daily average temperature of 26.8 °C, tended to be more dense, and these plants exhibited several different morphological properties, namely, the main stem was longer (160.69 cm) and larger in diameter, and the petioles were statistically longer, but there was no significant difference in the leaf area of the highland plants compared with that of the lowland plants.
The growth of plants at the highland location, where the average daily temperature is 19.2 °C, tended to be smaller, with the average length of the vine was only 65.75 cm (these plants can be considered dwarf types). The diameter of the vine was significantly smaller and the petiole also was shorter. The difference in temperature at the two locations significantly affected vegetative growth in terms of morphology. However, the potassium application and combination temperature and potassium treatment did not significantly influence the growth parameters of sweet potato at our study locations.
Different Physiological Response
The analysis of the results of RGR and NAR are presented in Table 3. The temperature in the lowlands caused significant differences in RGR and NAR, where RGR-1 and NAR-1 in the lowlands were significantly higher than those in the highlands.
In the period from week 7 to week 13, RGR-2–3 and NAR-2–3 did not manifest any significant changes due to temperature differences, either in the lowlands and in the highlands.
Differences in Biochemical Response to Experimental Treatments
The crop response to different temperatures (Table 4) showed differences in anthocyanin content (mg/100 g of fresh weight), anthocyanin production (kg/ha), and total glucose (ton/ha). Differences in biochemical parameters caused by the interaction of the temperature and potassium fertilizer are presented in Table 5. The results of the statistical analysis indicate that the temperature significantly affected the biochemical indicators (Table 4). The anthocyanin content and the production of anthocyanins and glucose were significantly higher at the highland site than at the lowland site, presumably because the temperature was lower.
Table 4
Differences in selected biochemical parameters and yield caused by temperature at harvest.
As shown in Table 5, the interaction of temperature and the potassium treatments caused significant differences in anthocyanin content (mg/100 g fresh weight), anthocyanin production (kg/ha), and glucose production (kg/ha) at the different locations. Both in low and high altitudes, the highest content of anthocyanin and anthocyanin production per hectare were obtained at potassium treatment of 100 kg/ha (K2), comparing to the other treatments. The addition of potassium at 150 kg/ha (K3), decreased anthocyanin content at those two locations. Glucose production per hectare did not show a significant difference due to the treatment with potassium fertilizer, either in the lowland or the highland locations.
Table 5
Differences in biochemical component caused by the interaction of temperature and potassium treatment at harvest.
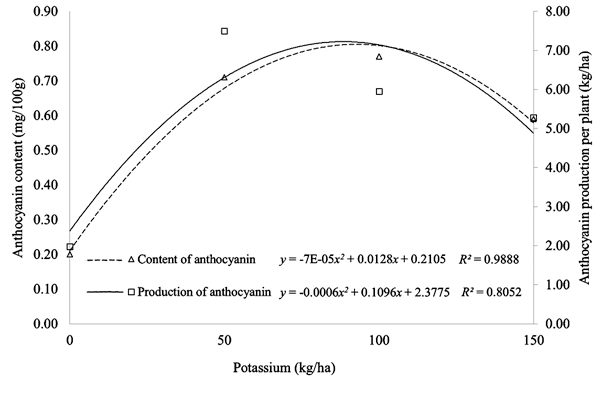
The plot of the quadratic equation for anthocyanin content and anthocyanin production is shown in Figure 1. The application of potassium to Antin-1 in the highlands, with an average daily high of 19.2 °C, caused significant differences to these two parameters. In contrast, at a daily average high of 26.8 °C (in the lowland location) potassium treatment was less efficient.
The increase in anthocyanin levels follows a positive quadratic pattern, with a determination value of 0.98, which indicates the effect of potassium on anthocyanin accumulation to 98% (Figure 1). Application of potassium at a rate up to 92,143 kg/ha K2O determines the accumulation of anthocyanin, which reached the highest level at 0.8023 mg/100 g fresh material at low temperatures (highlands). The production of anthocyanin per hectare also follows a positive quadratic pattern, with a determination value of 0.81. This indicates that the effect of potassium is as much as 81% in determining anthocyanin production per hectare.
Application of potassium at 91.42 kg/ha K2O promotes the per-hectare production of anthocyanin up to a maximum of 7.301 kg/ha in the highlands. The formation of anthocyanins of Antin-1 in the highlands follows a quadratic pattern, where the addition of potassium at levels greater than 100 kg/ha will reduce the content and production of anthocyanins.
Differences in Yield Response
Sweet potato responses to differences of temperature resulted in different yields in the two research areas; tuber weight and harvest indexes were significantly higher at the highland site than at the lowland site – which had higher temperatures (see Table 4).
Crop yield measures, consisting of tuber weight per plot, tuber weight per hectare, and harvest index, were higher at the highland site (19.2 °C) than at the lowland site (26.8 °C). This suggests that the effect of temperature is very important in the formation of tubers and vegetative components. However, the addition of potassium fertilizer and the interaction of temperature with potassium do not have a significant effect on yields, either in the highlands or in the lowlands.
Discussion
Temperature significantly affects morphological characteristics of sweet potato, namely, the length of the main stem and the length of the petiole – both of which were longer in plants grown at the lowland site compared with highland plants. Similarly, the diameter of the stem was larger in the lowland plants, although temperature differences between the lowland and highland sites did not result in significantly different values for leaf area at the two locations. This shows that temperature has a big role to shape plant morphology. With the exception of leaf area, plant morphology traits in sweet potato differed significantly depending on altitude (temperature). We conclude that temperature plays a very significant role in shaping plant morphology. According to Ravi et al. (2012), sweet potatoes can change morphological traits in the growth period depending on the cultivars, i.e., erect, bush, intermediate, or spreading. As the temperature increases, total production and leaf area will increase, but after the temperature exceeds the optimum of 26.7 °C, these parameters will decline (Gajanayake et al., 2015). Furthermore, Strong and Redburn (2009) also interpreted changes in environmental conditions that caused some plants to become dwarf bushes in response to colder climates. The relative growth rate of plants is largely influenced by current temperature conditions, attaining high values when photosynthesis occurs. Madhu and Hartfield (2016) explained that the leaf area index increases along with an increase in crop growth rate from the beginning of growth to the end of the vegetative period.
Fertilizing with potassium increases the number of tubers. Moreover, the application of potassium increases the rate of photosynthesis and translocates photosynthates into plant tissues. The increasing number of leaves and leaf areas will increase the absorption of solar radiation and will increase the amount of dry matter and the net assimilation rate (Wang et al., 2013). Strong and Redburn (2009) showed that NAR was not affected by the leaf area but was determined by environmental conditions – high humidity will stimulate the growth of leaves, and changes in environmental conditions from cold climates and less dry conditions can decrease photosynthetically active radiation (400–700 nm), which is available up to 20%. Studies by Hamouz et al. (2010) and Ieri et al. (2011), in which the effect of temperature on the vegetative period was investigated, demonstrated that temperature will affect the phenolic content in potato. This indicates that abiotic stress can lead to an increase in the concentration of phenolic compounds in the tubers, and the highest concentration of anthocyanin in the colored tuber flesh occurred in a cultivation site at 1,000 m above sea level.
The formation of storage roots and starch synthesis increased in the temperature range of 14–22 °C, and accordingly, the glucose content also increased along with adequate soil moisture (Ravi & Indira, 2010). Ravi et al. (2014) found that if the number of storage roots was low, then this had the effect of reducing the amount of glucose translocation and starch synthesis under high-temperature conditions. High tuber production, according to Kareem (2013), occurs when the sweet potato tends to be short-stem and the growth rate of the stem is low. Yeng et al. (2012) reported that the increase in the growth and accumulation of dry matter occurred in the early weeks and decreased in the final weeks until harvest. According to Ravi et al. (2014), the ratio of the dry-bulb ingredients to the total dry matter (IH) shows the efficiency of the distribution of the material in the tuber. When an increase in total dry matter production occurs, this matter is allocated to the tubers and is generally used for canopy formation. Increasing the supply of N and K fertilizers will increase the total dry matter (Satapathy et al., 2005).
In the present study, the effect of potassium fertilization did not affect the growth, yield, or biochemical parameters of sweet potato. This may be due to K+ possibly having a prior role in physiological development and regulation; for example, the regulation of the opening and closing of stomata as well as enzyme activity and increasing the rate of photosynthesis (Wang et al., 2013). However, the effect of temperature and potassium interactions exert a significant influence on anthocyanin levels, because the formation of anthocyanins is much influenced by environmental conditions, including altitude (Ieri et al., 2011) and the amount of potassium applied to the sweet potato crop. Furthermore, Kivuva et al. (2012) argue that genotype and environmental interactions significantly influence the growth and production of sweet potatoes, where temperature influences gene expression during the formation of anthocyanins (Basuki et al., 2005).
Conclusion
Temperature significantly affects the growth of sweet potato var. Antin-1 morphologically, physiologically, and biochemically. We found that in the lowland crop, the vegetative growth of the shoot was more rapid than in the highland plants, while values for the harvest index, tuber weight, anthocyanin production, and glucose were higher in the highland plants compared with those in the lowland plants. The interaction of temperature and potassium also resulted in differences in the anthocyanin and glucose contents, which were significantly higher in the highlands than in the lowlands.
Handling Editor
Barbara Hawrylak-Nowak; University of Life Sciences in Lublin, Poland; https://orcid.org/0000-0002-2935-1491
Authors’ Contributions
RS designed the research, performed data analysis, and wrote the manuscript; R designed the research, analysed the results, and contributed to discussion; LAMS designed and supervised the research, interpreted the results, and wrote conclusion; FH developed the theory and contributed to discussion
