. Introduction
Dendrobium is one of the orchid genera that is abundant in species occurring in Asia, Australasia, and Australia (Xiang et al., 2013). In total, it comprises about 1,100 species (Burke et al., 2008; Moudi et al., 2013; Takamiya et al., 2014).
Although it was described more than 200 years ago (Swartz, 1799), there is still a great desire to investigate it. Identification of Dendrobium species is very difficult. This is probably due to the high level of polymorphism, the large number of species, the wide range of occurrence, and their geographical distribution also contributes to identification problems within this taxon (Takamiya et al., 2014). Attempts to classify this genus have been made since the 19th century, first on the basis of morphological characters and later on phylogenetic analyses. To date, there has been no consistent classification of Dendrobium, and no unambiguous taxonomic treatment, either between species within the genus or within particular sections (Clements, 2006; Pridgeon et al., 2014; Takamiya et al., 2011; Wang et al., 2009; Xiang et al., 2013). Establishing a consistent classification of Dendrobium is one of the greatest challenges among orchidologists (Adams, 2011; Adams et al., 2006; Feng et al., 2015a, 2015b; Morris et al., 1996; Xiang et al., 2013; Yukawa et al., 1996; Yukawa & Uehara, 1996). A proposal for intraspecific classification based on morphology alone is almost impossible. For this purpose, it is also necessary to use information stored in DNA.
To reconstruct the phylogeny, the plastid DNA data was often used: i.e., markers such as matK, rbcL, ycf1, the trnL-trnF fragment, rpl16, and rpl32 (Neubig et al., 2009; Niu et al., 2020; Shaw et al., 2014). Unfortunately, the phylogenetic trees obtained from these are often inconsistent. These markers are easy to align but are sometimes too conservative and lack sufficient variability. Consequently, the mentioned genes provide too little phylogenetic information and do not resolve intra- and interspecies relationships (Neubig et al., 2009; Zhao et al., 2019). Studies of their heredity indicate only maternal transmission, with no evidence of paternal or two-parental inheritance (Cafasso et al., 2005). Consequently, cpDNA provides only half of the ancestry in hybrid and polyploid plants and thus does not identify phylogenetic conflicts arising from hybrid ancestry (Small et al., 2004). The selection of suitable markers is, therefore, one of the most important steps in phylogenetic research. This task has been made easier by the use of next-generation sequencing methods. In the last decade, we have come to know the sequences of complete chloroplast genomes, including many representatives of orchids (Zheng et al., 2018; Zhitao et al., 2017). However, information on the nuclear genome is still quite limited. There is a lack of data that unequivocally indicates the efficacy of a specific nuclear marker, so we decided to focus our analyses primarily on this area.
So far, among nuclear sequences, the most commonly used markers are ITS. These fragments are considered universal due to the presence of many genetic variations and a high copy number. A single copy is usually a combination of two ITS fragments and genes encoding a large and small ribosomal subunit, i.e. 18S-ITS1-5.8S-ITS2-26S. The main advantage of nuclear genes is the higher rate of sequence evolution compared to organelle genes. This is particularly important at low taxonomic levels (Soltis & Soltis, 1998). Furthermore, numerous molecular studies have been carried out using the above-mentioned markers due to the ease and relatively low cost of obtaining sequences, as well as their wide availability.
However, in recent decades, the use of nuclear low-copy genes seemed to be a breakthrough in reconstructing the course of phylogeny. Many of them contain large amounts of genetic information, i.e., informative sites. Moreover, like multicopy nuclear genes, they are also biparentally inherited and often show rapid rates of evolution (Small et al., 2004). Furthermore, they are potentially ideal markers for resolving polyploidy and hybridization (Górniak et al., 2010; Hazra et al., 2020; Peng & Wang, 2008; Russell et al., 2010; Small et al., 2004; Yin et al., 2020). In addition, low-copy-number markers can be used to reconstruct phylogeny at all taxonomic levels, especially where universal markers are unable to generate strong phylogenetic hypotheses (Bratzel et al., 2020; Sang, 2002). However, it should be remembered that they also have their disadvantages. They occur in low copy numbers and sometimes require additional laboratory work, such as cloning or designing their PCR primers (Li et al., 2019). The Xdh gene has been identified as one of the low-copy markers for use in phylogenetic analyses in the framework of Górniak et al. (2010), demonstrating the possibility of using the low-copy Xdh gene in representatives of the Orchidaceae (Górniak et al., 2010). The use of Xdh in determining phylogenetic relationships has occurred and continues to do so among different genera belonging to this family (Bulbophyllum Thouars, Campylocentrum Benth., Paphiopedilum Pfitz.) and at various phylogenetic levels, as well as among other plant groups (Chen et al., 2019; Górniak et al., 2021; Jin et al., 2017; Kikuchi et al., 2020; Nowak et al., 2023; Pessoa et al., 2018; Viruel et al., 2018). However, it is worth noting that often, due to the need to put more effort into laboratory analyses, the authors of the papers are less likely to decide to choose them.
This marker encodes a protein, xanthine dehydrogenase, which belongs to the molybdenum cofactor-dependent class of hydroxylase enzymes. Xdh plays an important role in the degradation of nucleic acids in bacteria, plants, and animals (Górniak et al., 2010; Rodríguez-Trelles et al., 2001). It takes part in the regulation of normal plant growth and aging processes (Han et al., 2020). It also participates in other important physiological processes, such as plant response to pathogen attack, acclimatization, and cell death associated with the hypersensitivity response (Taylor & Cowan, 2004; Watanabe et al., 2010). However, what is most important for taxonomists and this work is that the Xdh marker participates in phylogenetic studies of plants. In previous studies on the genus Dendrobium, the aforementioned gene has only been used once by Moudi and Go (2015), who managed to obtain sequences for 20 Dendrobium species from the Malaysian area. Therefore, we expected that it would also prove useful in studies on the phylogeny of the nominal section.
The aim of our work was to test the suitability of the low-copy Xdh gene for reconstructing section-level phylogeny based on the nominal section of Dendrobium. We performed phylogenetic trees using both the Xdh gene and ITS, as well as trnL-trnF and matK. We collected quantitative data for the aforementioned markers and determined sequence length, number of fixed and variable sites, and number of parsimony-informative sites. In addition, our results also enriched the GenBank database with new sequences for the Xdh marker, which has so far been rarely represented in this database.
. Material and methods
. Material
. Research object
In our studies, we used samples representing various species of Dendrobium. The members of this genus are mainly epiphytes with a sympodial type of growth. They are characterized by a lateral inflorescence emerging from the upper part of the stem, a mentum formed by lateral sepals and a prominent column foot, four naked pollinia, and swollen rostellum (Pridgeon et al., 2014). It should be noted that Dendrobium is one of the larger genera within the Orchidaceae. Therefore, focus primarily on the nominal section. It contains over 50 species, including the generitype Dendrobium moniliforme (L.) Sw. (Wood, 2006). The range of its representatives is almost as wide as that of the genus, except for the area of Micronesia and Melanesia (Takamiya et al., 2014). The main morphological characters that distinguish this section are a tall, leafy stem and multiple racemes carrying a few flowers with an expanded, tomentose, and velvety lip (entire in most species, without sidelobes). The color of the flowers is usually pink to purple or white. They bloom for about four weeks in the spring (Wood, 2006).
. Plant material
The plant material used in these studies came from the gathering at the Department of Plant Taxonomy and Nature Conservation at the University of Gdansk, Poland. We have selected for testing all species that have ever been classified into the section Dendrobium (Clements, 2006; Feng et al., 2014; Schuiteman, 2011; Takamiya et al., 2014; Wood, 2006; Xiang et al., 2013). For each marker, we tried to use sequences from the same species. In the case of the Xdh gene dataset, we also extended our analyses to species outside the nominal section. All DNA sequences obtained have been deposited in GenBank. The ID numbers for these samples and GenBank accession numbers are presented in Table S1. In addition, part of the sequences representing outgroup taxa and species of Dendrobium outside the nominal section for the Xdh marker were downloaded from GenBank (Table S1). Sequences were also taken for other utilized markers, and the list of these taxa is included in Table S2.
. Molecular methodologies
For the phylogenetic reconstruction and to test the utility of the low-copy nuclear gene Xdh, we obtained 29 sequences representing species of the nominal section.
. DNA isolation
Total genomic DNA was extracted from 20–100 mg of dried leaves stored in silica gel (Chase & Hills, 1991). The extraction was performed using a Sherlock AX kit (A&A Biotechnology, Poland), and the procedure was carried out with the attached protocol. The pellets of DNA were suspended in 50 µL of TE buffer.
. Amplification and sequencing
Polymerase chain reaction (PCR) and sequencing reaction were performed using the same primers. The X551F and X1591R for the Xdh marker (Górniak et al., 2010), 101 F and 102 R for nrITS fragments (Douzery et al., 1999), and trnL-c and trnL-f for trnL-trnF markers (Taberlet et al., 1991). PCRs were carried out in a total volume of 25 µL containing 1 µL template DNA (∼10–100 ng), 1 µL of 10 µM of each primer, 12.5 µL Hot-Start PCR Mix-Start Warm (A&A Biotechnology, Poland), and water. The amplification of the Xdh marker used a touchdown method, which involves lowering the attachment temperature of the primer by one degree for the first seven cycles. It was done to increase the efficiency of the reaction and is extremely important when amplifying low-copy genes. The parameters were the following: the initial denaturation 95°, 5 min and then by seven cycles denaturing in 94°, 45 s; primer annealing 59°, 45 s (reducing 1° per cycle) and extending in 72°, 90 s. The next 30 cycles proceeded in 94°, 45 s; 52°, 45 s; 72°, 90 s, and final elongate 72°, 10 min. All products of the PCR reaction were tested using electrophoresis in 1% agarose gel at 110 V for 40 minutes and then were purified using the PCR Clean-Up System (Promega, US) and DNA Clean-Up Concentrator Kit (A&A Biotechnology, Poland) following the manufacturer’s protocol. The prepared samples were sequenced at Macrogen (Seoul, South Korea, http://dna.macrogen.com/eng/). The obtained sequence chromatograms were examined/edited using FinchTV (https://finchtv.software.informer.com/1.4/). The analyzed DNA regions (nrITS, Xdh, matK, and trnL–trnF) were aligned separately using the ‘align’ option according to the MUSCLE algorithm (Edgar, 2004) with SeaView v.5.0 (Gouy et al., 2021).
. Phylogenetic analyses
To test for possible incongruence in topologies, we performed phylogenetic analyses based on three methods: maximum parsimony (MP), maximum likelihood (ML), and Bayesian inference (BI). For the latter two, a nucleotide substitution model is required to be determined. It was calculated using the jModelTest 2 (Darriba et al., 2012), and based on the AIC criterion, we selected GTR+G+I for all datasets analyzed.
The MP analyses with PAUP v. 4.0 (Swofford, 2000) used a heuristic search strategy with tree-bisection-reconnection (TBR) branch swapping and the MULTREES option in effect, simple addition, and ACCTRAN optimization. The number of retained trees was 10,000. All characters were equally weighted (Fitch, 1971), while gaps were treated as missing values. In addition, we performed a bootstrap analysis with 500 replicates (Felsenstein, 1985). Whereas the maximum likelihood analyses were performed with RAxML-GUI 2.0 (Edler et al., 2021) by searching for the best-scoring ML tree, the branch support was calculated with 1000 replicates. We also carried out the Bayesian inference with MrBayes (Ronquist et al., 2012) using four Markov-chain Monte Carlo chains in two independent runs. Additionally, every run was started from different random trees to ensure that individual runs converged to the same result. For each dataset, different numbers of generations with sampling every 100 generations are inflicted. It depended on the achievement of convergence of split frequencies below 0.01. The initial 25% of the sampled generations of each chain were discarded as burn-in, and then all saved trees were summarized in a majority rule consensus tree.
. Results
. Statistical data showing the marker’s usefulness
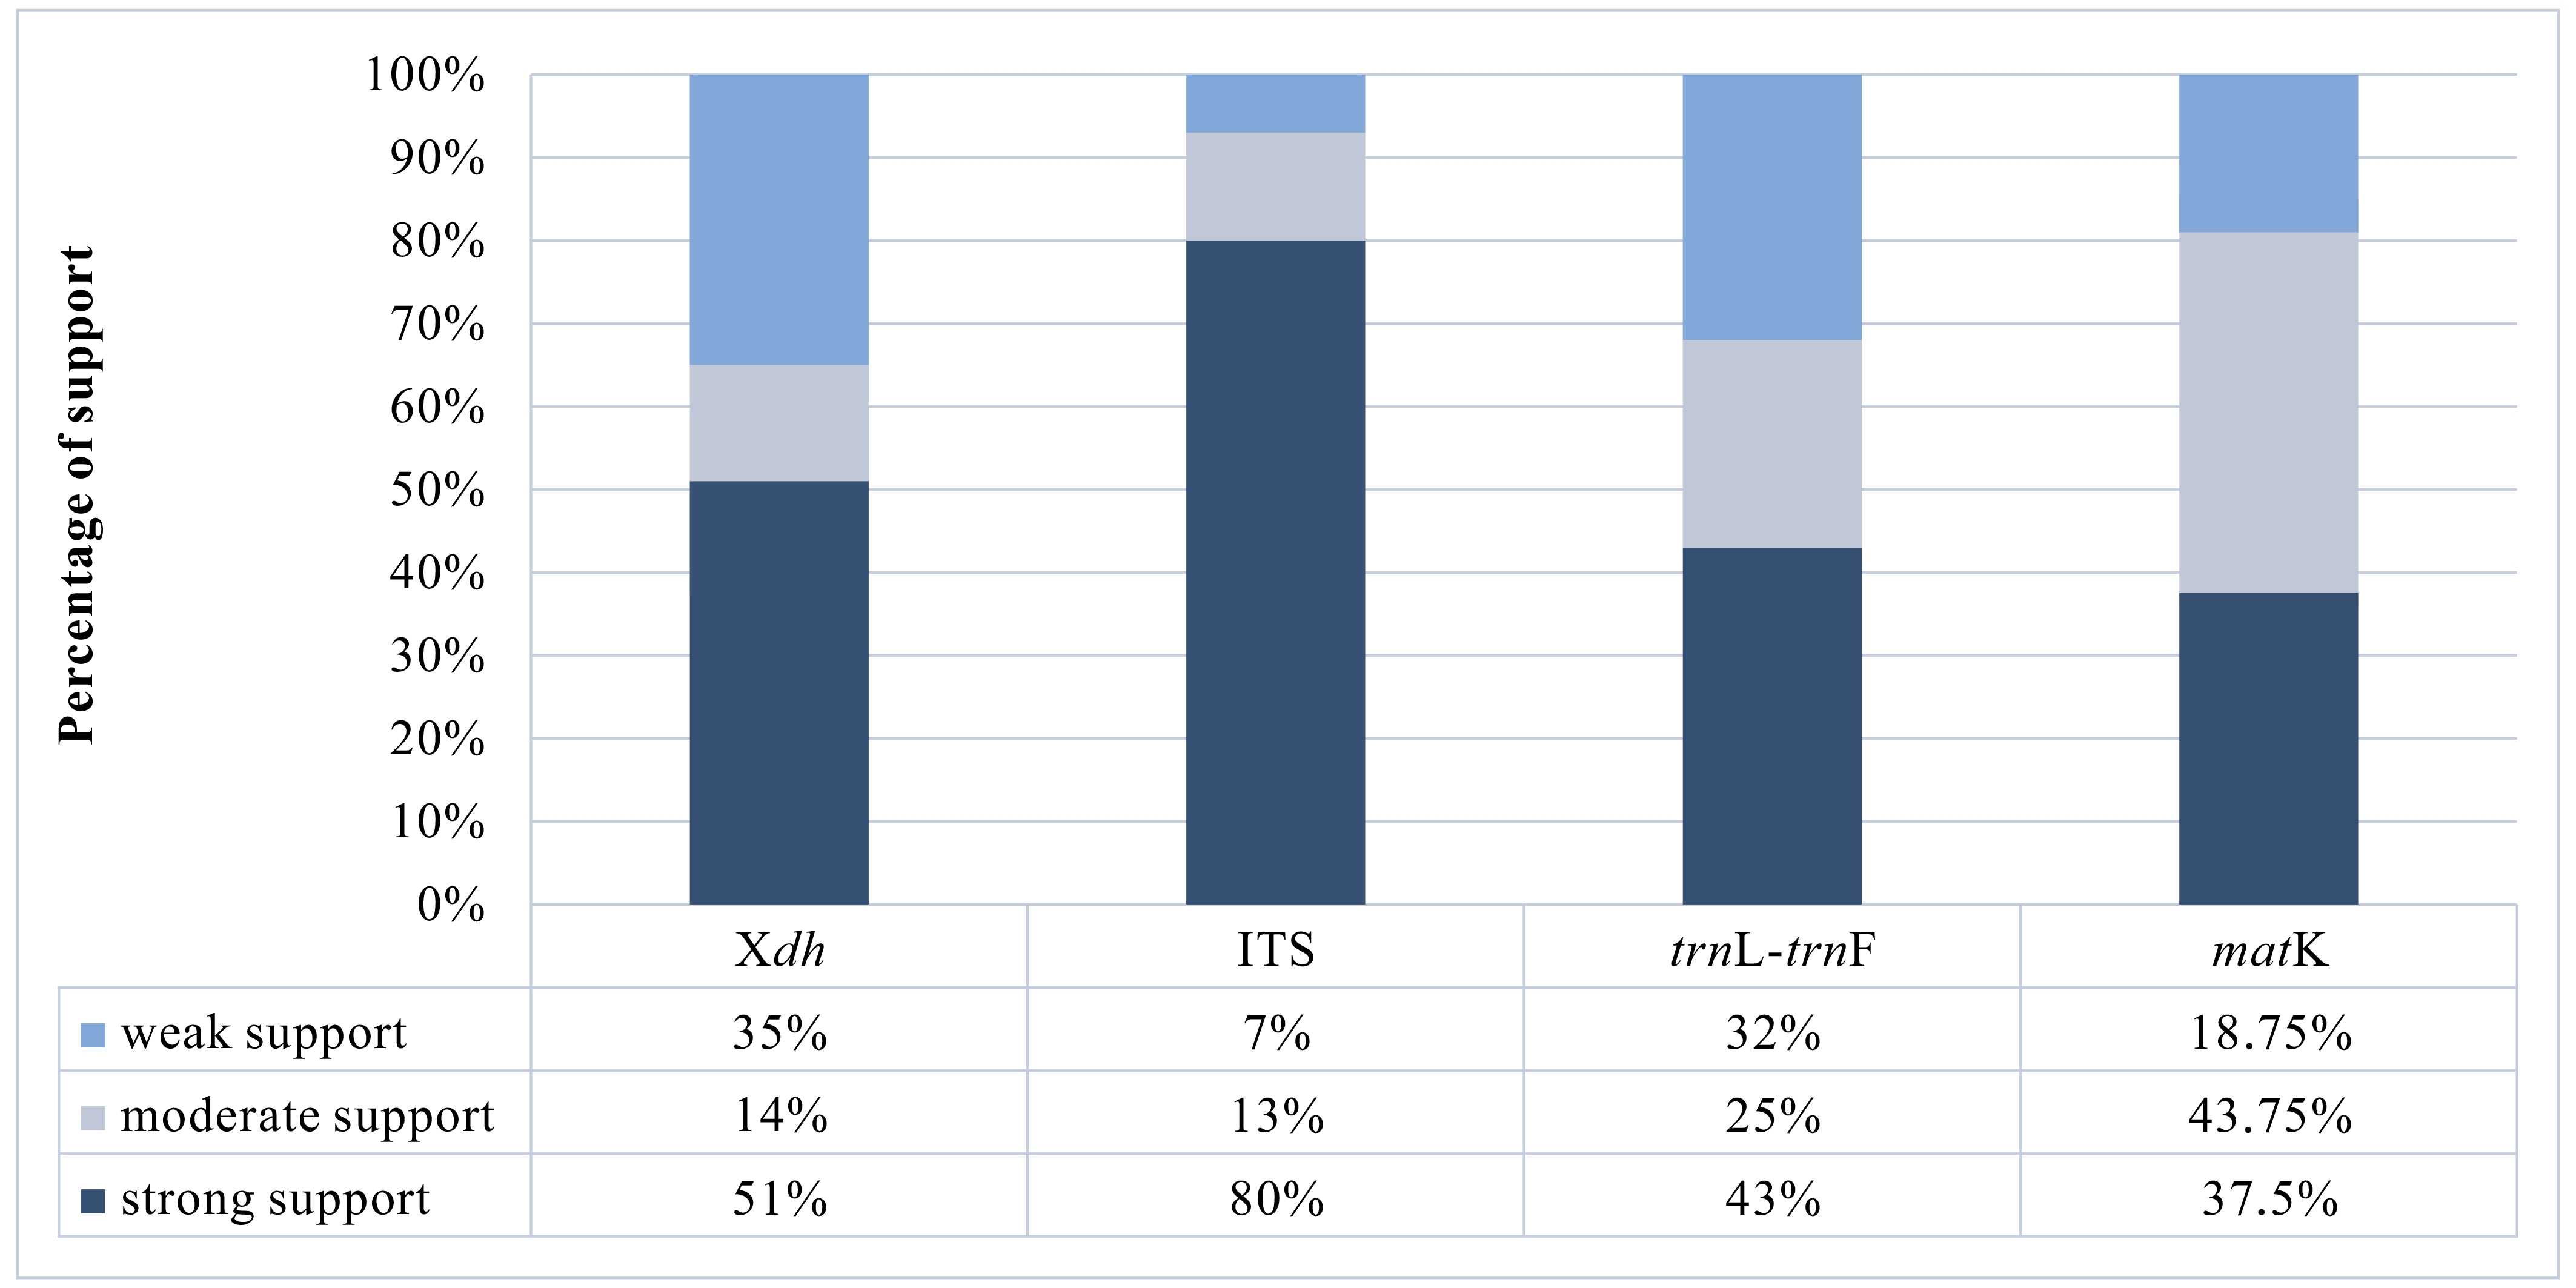
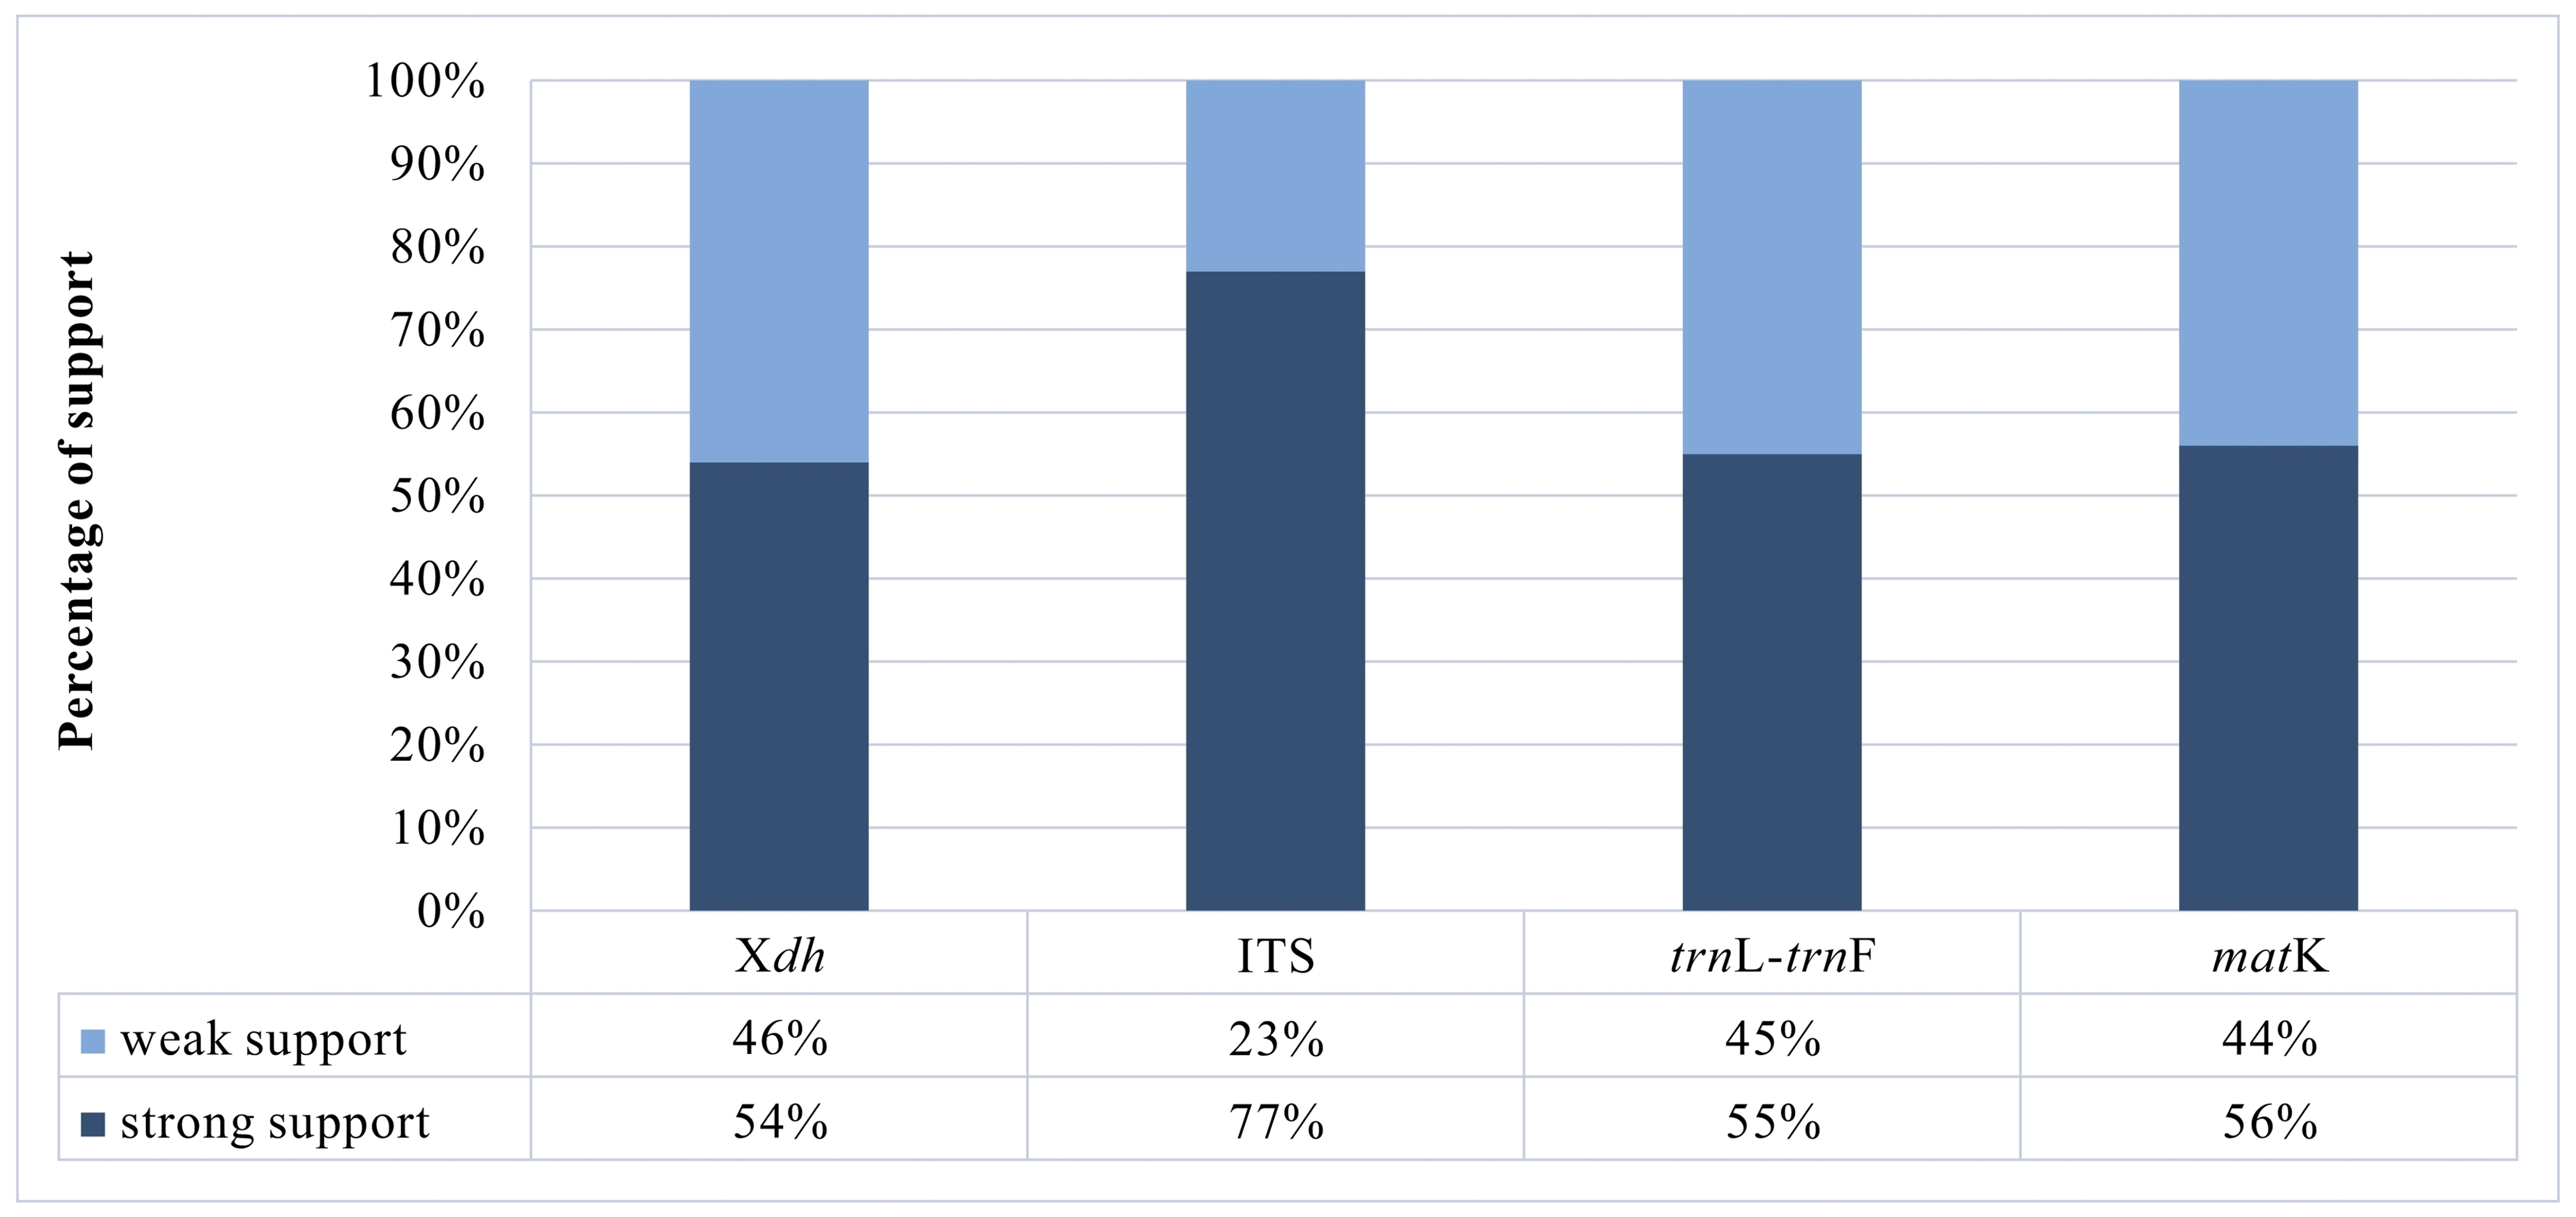
A matrix consisting of 53 sequences was obtained for the Xdh marker. Two species represented the outgroup, and the remaining taxa were representatives of Dendrobium. In the case of ITS, the dataset was obtained for 150 samples representing a nominal section of Dendrobium and two as an outgroup. At the same time, the matrices of the plastid regions (matK and trnL-trnF, respectively) included 38 and 83 taxa of the Dendrobium sect. Dendrobium and 2 outgroup samples. For all the analyzed DNA fragments, the number of constant and variable features, as well as parsimony-informative and non-informative sites, were determined (Figure 1, Figure 2, Table 1). Based on these data, the variability within a given matrix was calculated as the ratio of the number of parsimony-informative sites to the number of all characters for each analyzed marker. The obtained results were plotted in a column diagram (Figure 3). In addition, in Table 2, we present the tree length, number of samples, value of consistency (CI), retention (RI), and homoplasy index (HI) for all analyzed matrices. We evaluated the efficacy of individual markers based on all the data presented above and their interpretation of them as a whole rather than only based on the analysis of a single piece of information. However, it is worth mentioning that the number of variable sites and parsimoniously informative sites seem to be most important here. The reliability of the obtained trees was determined based on calculations regarding the support of node, using bootstrap values for clades generated by the ML method and posterior probability for BI analysis. As suggested by Kores et al. (2001), the level of bootstrap support above 85% is considered strong, between 85% and 71% as moderate, and below 70% as weak. In the case of a posterior probability, all values equal to or greater than 0.95 were considered strong, while the others were treated as weak (Cummings et al., 2003; Simmons et al., 2004). Our calculations for individual markers are summarized in two graphs – Figure 4 and Figure 5.
Figure 1
Chart showing the percentage of the number of constant and variable characters for Xdh and ITS markers.
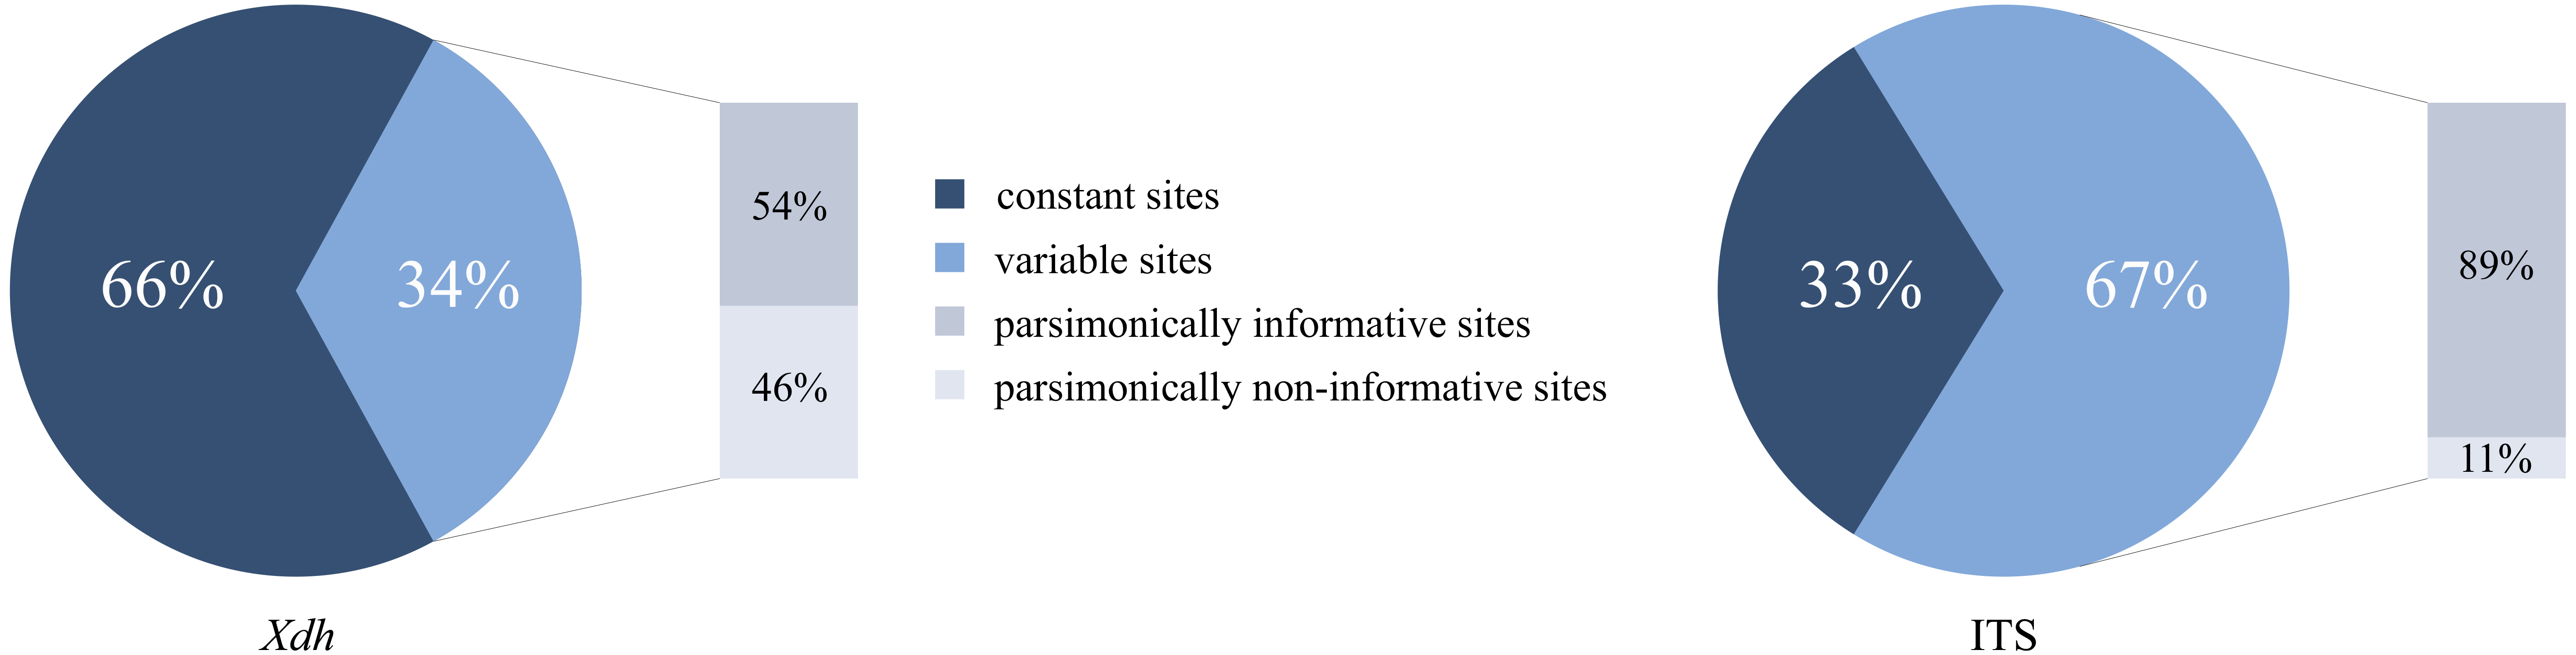
Figure 2
Chart showing the percentage of the number of constant and variable characters for trnL-trnF and matK markers.
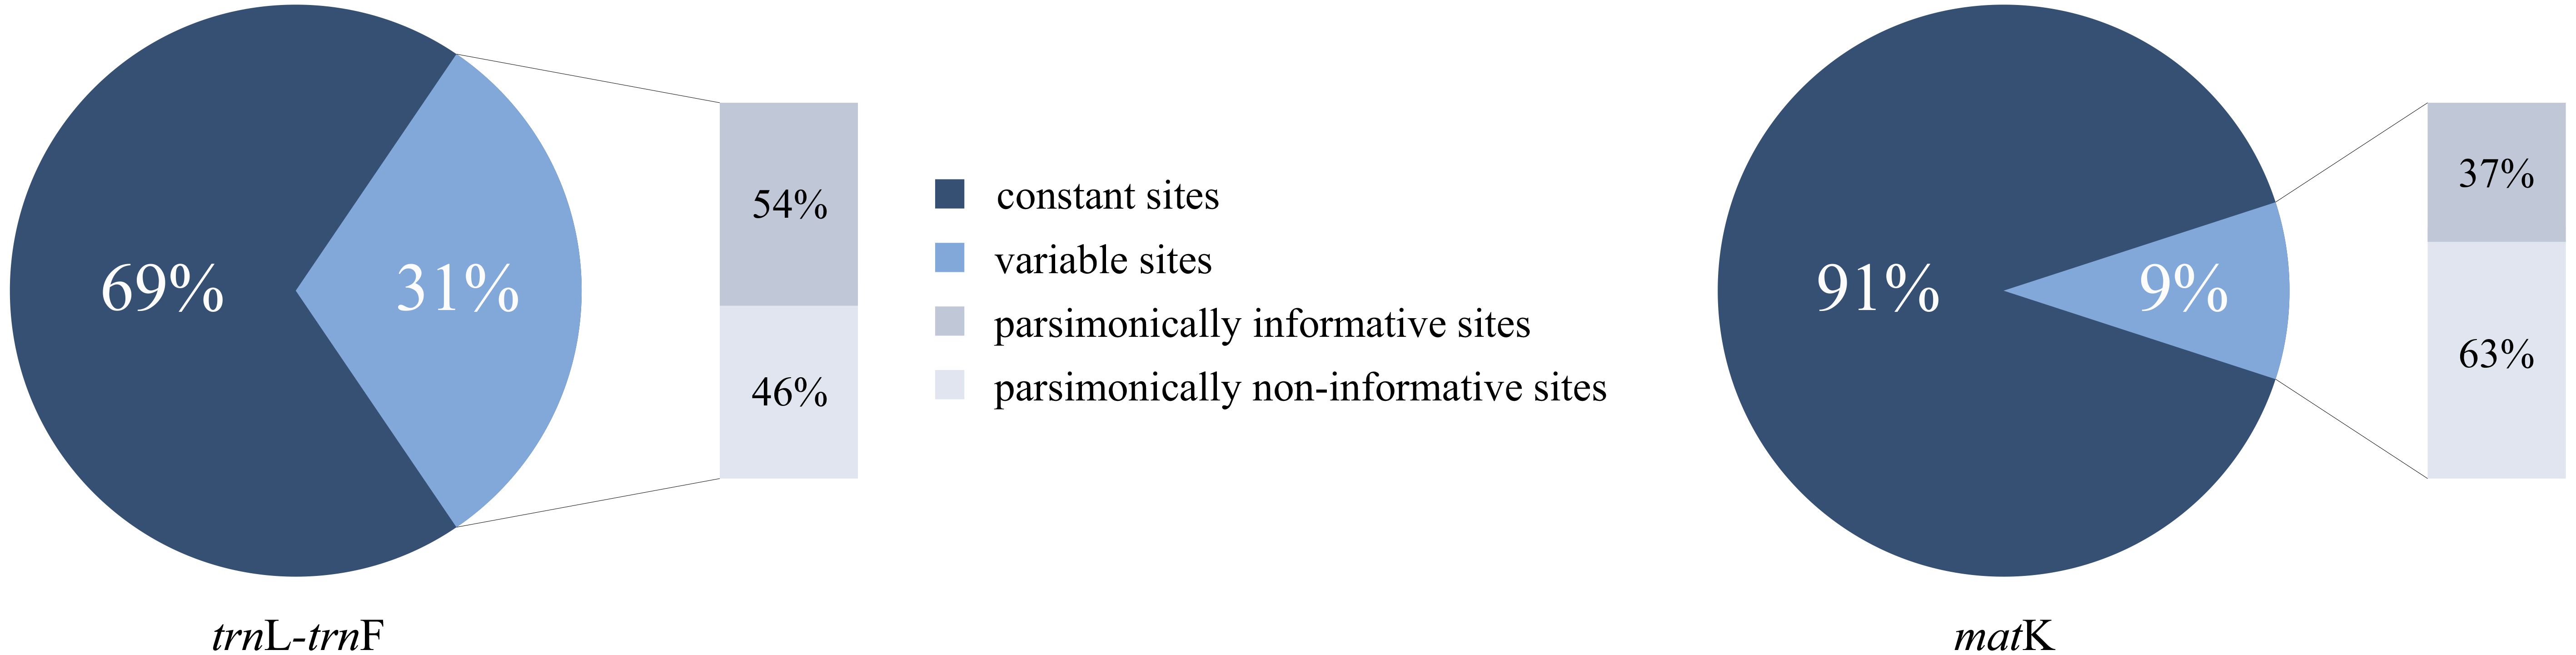
Table 1
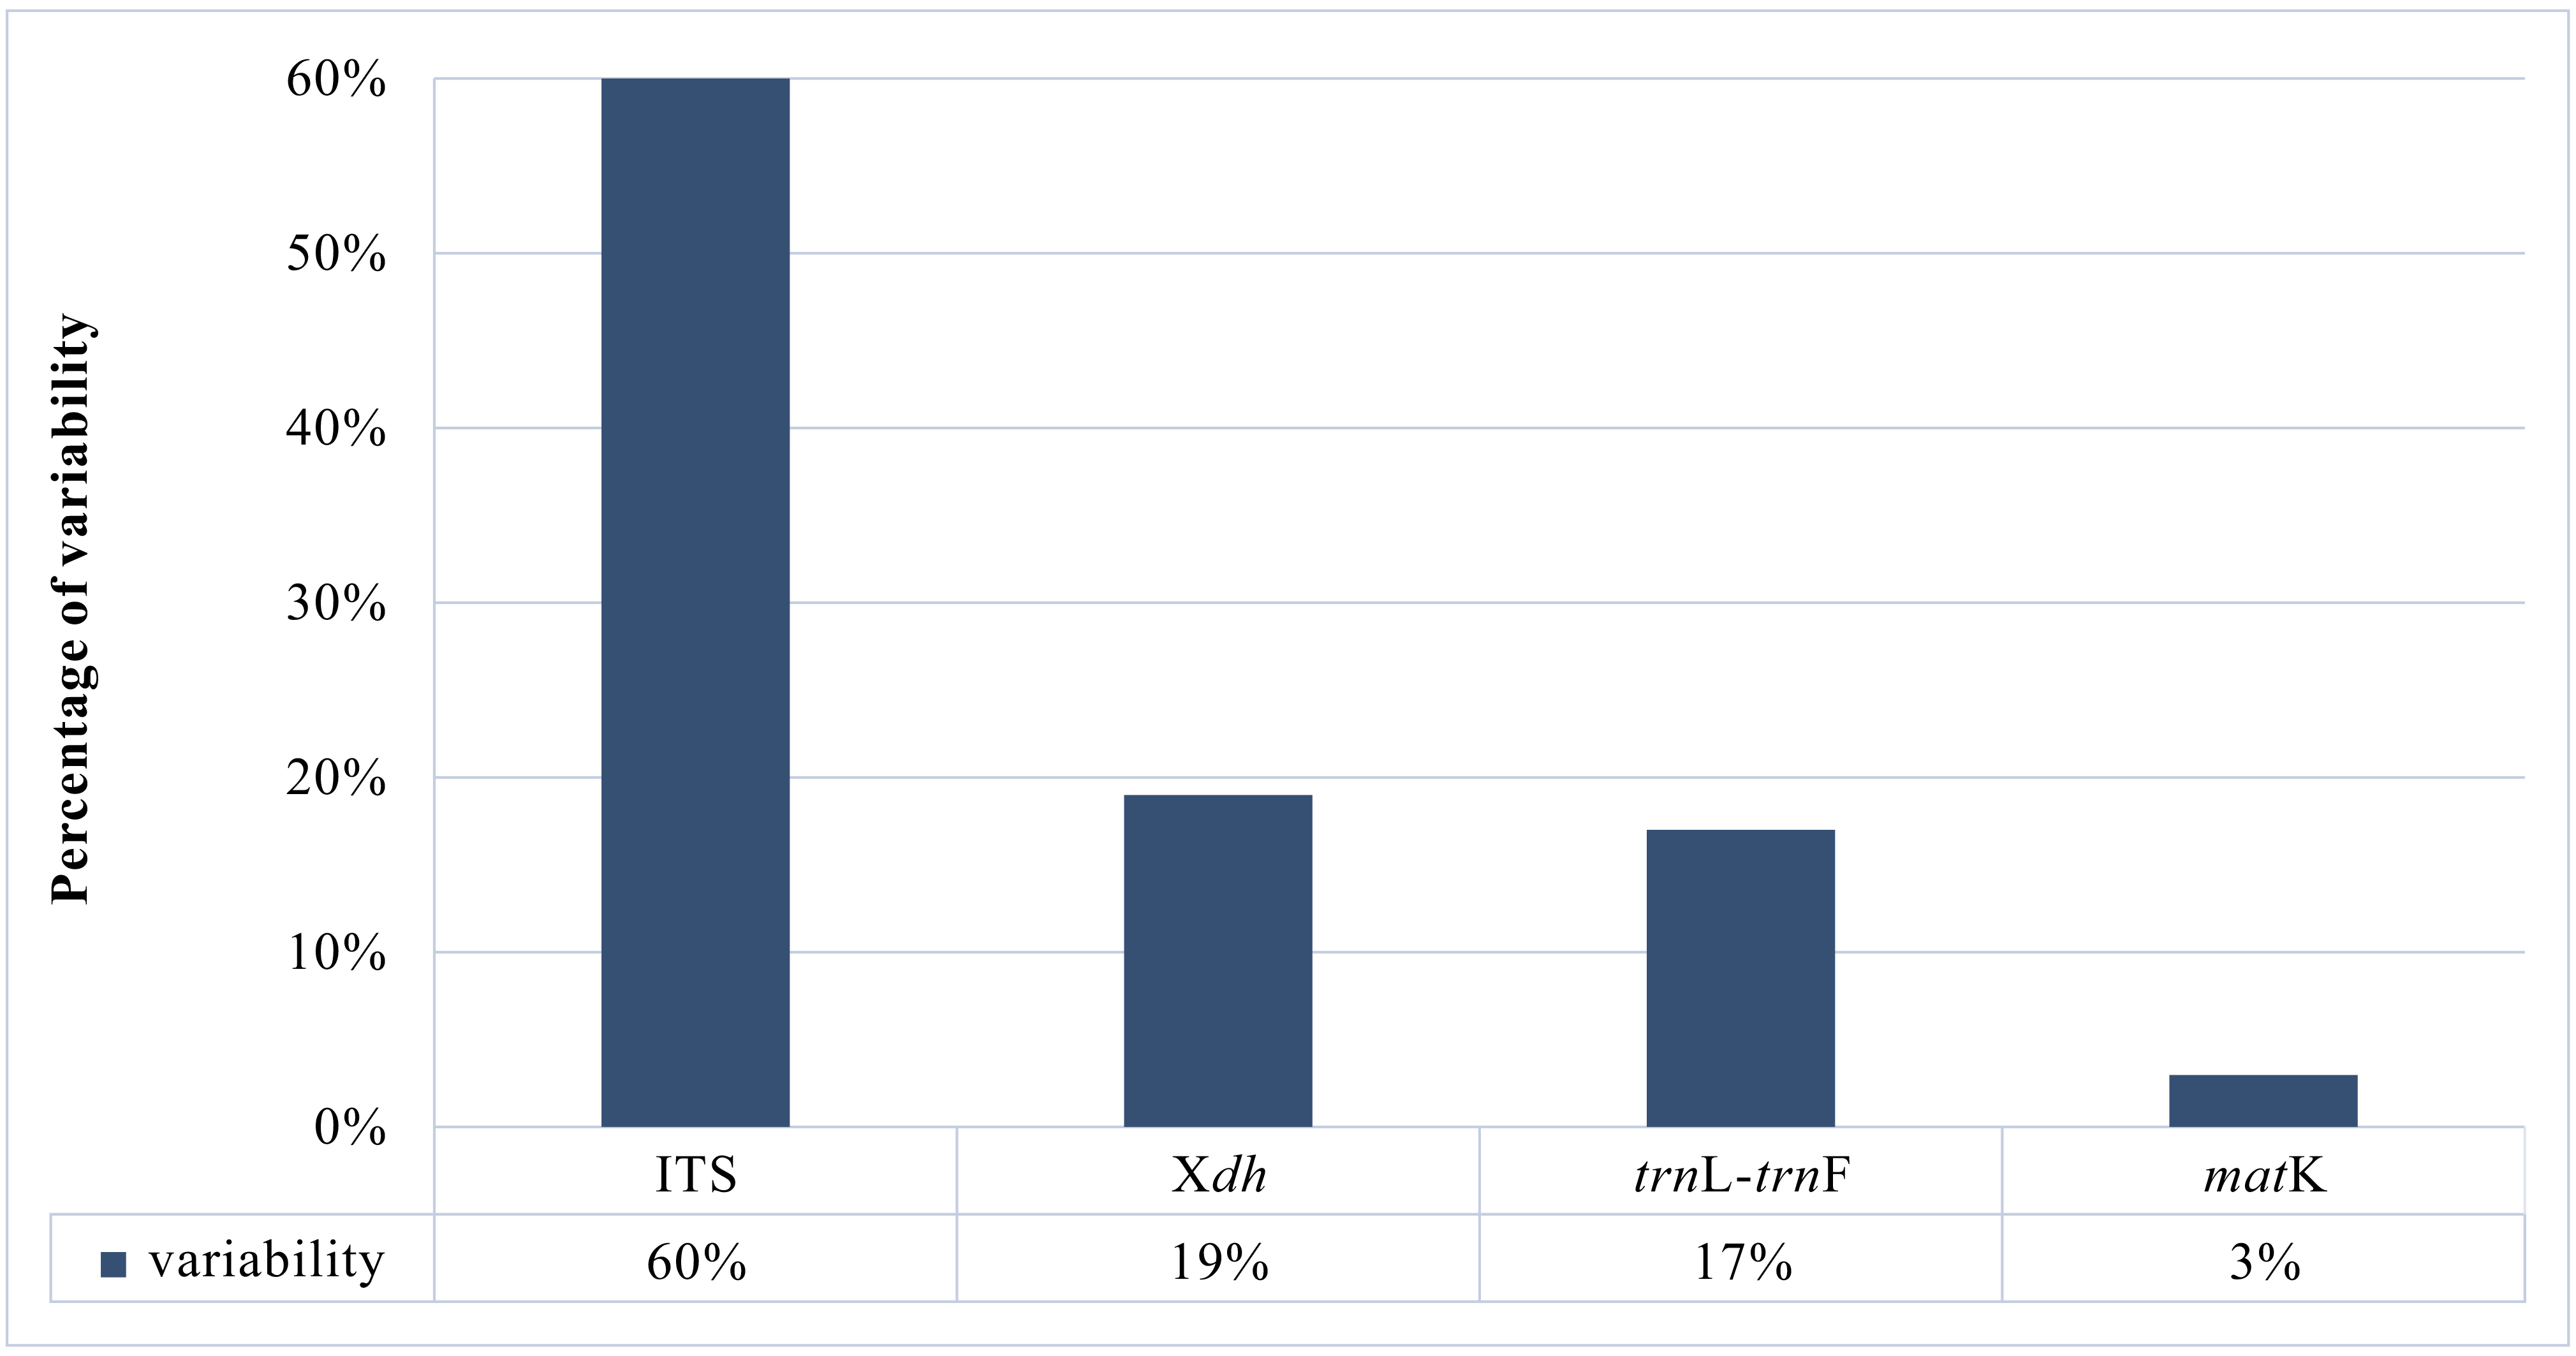
Table 2
Statistical data for all regions used in the phylogenetic analyses (CI – Consistency Index; RI – Retention Index; HI – Homoplasy Index).
| Region | Tree length | Number of Samples | CI | RI | HI |
|---|---|---|---|---|---|
| Xdh | 379 | 53 | 0.794 | 0.876 | 0.206 |
| ITS | 1841 | 152 | 0.441 | 0.853 | 0.559 |
| trnL-trnF | 577 | 85 | 0.730 | 0.790 | 0.270 |
| matK | 138 | 40 | 0.877 | 0.874 | 0.123 |
. Phylogenetic analyses
Regardless of the method used, for ITS, trnL-trnF, and matK markers, tree topology turned out to be similar. Therefore, in this paper, we present only those obtained using the BI method, but we also add the nodes’ values of bootstrap support (BS) obtained from both MP and ML analyses (Figure 6A–B, Figure 7, Figure 8). For the trees obtained based on the Xdh gene matrix, we decided to present the results from both ML and BI analysis (Figure 9). Admittedly, the differences between the two are not very glaring. However, we tested the usefulness of this marker and decided that two trees should be displayed in this case.
Figure 6
(A, B) The majority-rule consensus tree resulted in the Bayesian analysis for the nrITS marker of the Dendrobium sect. Dendrobium. The numbers above branches indicate posterior probability (PP) while the numbers below branches mean values of bootstrap support accordingly of maximum likelihood and maximum parsimony analyses. The BS values of less than 50% were marked as -.
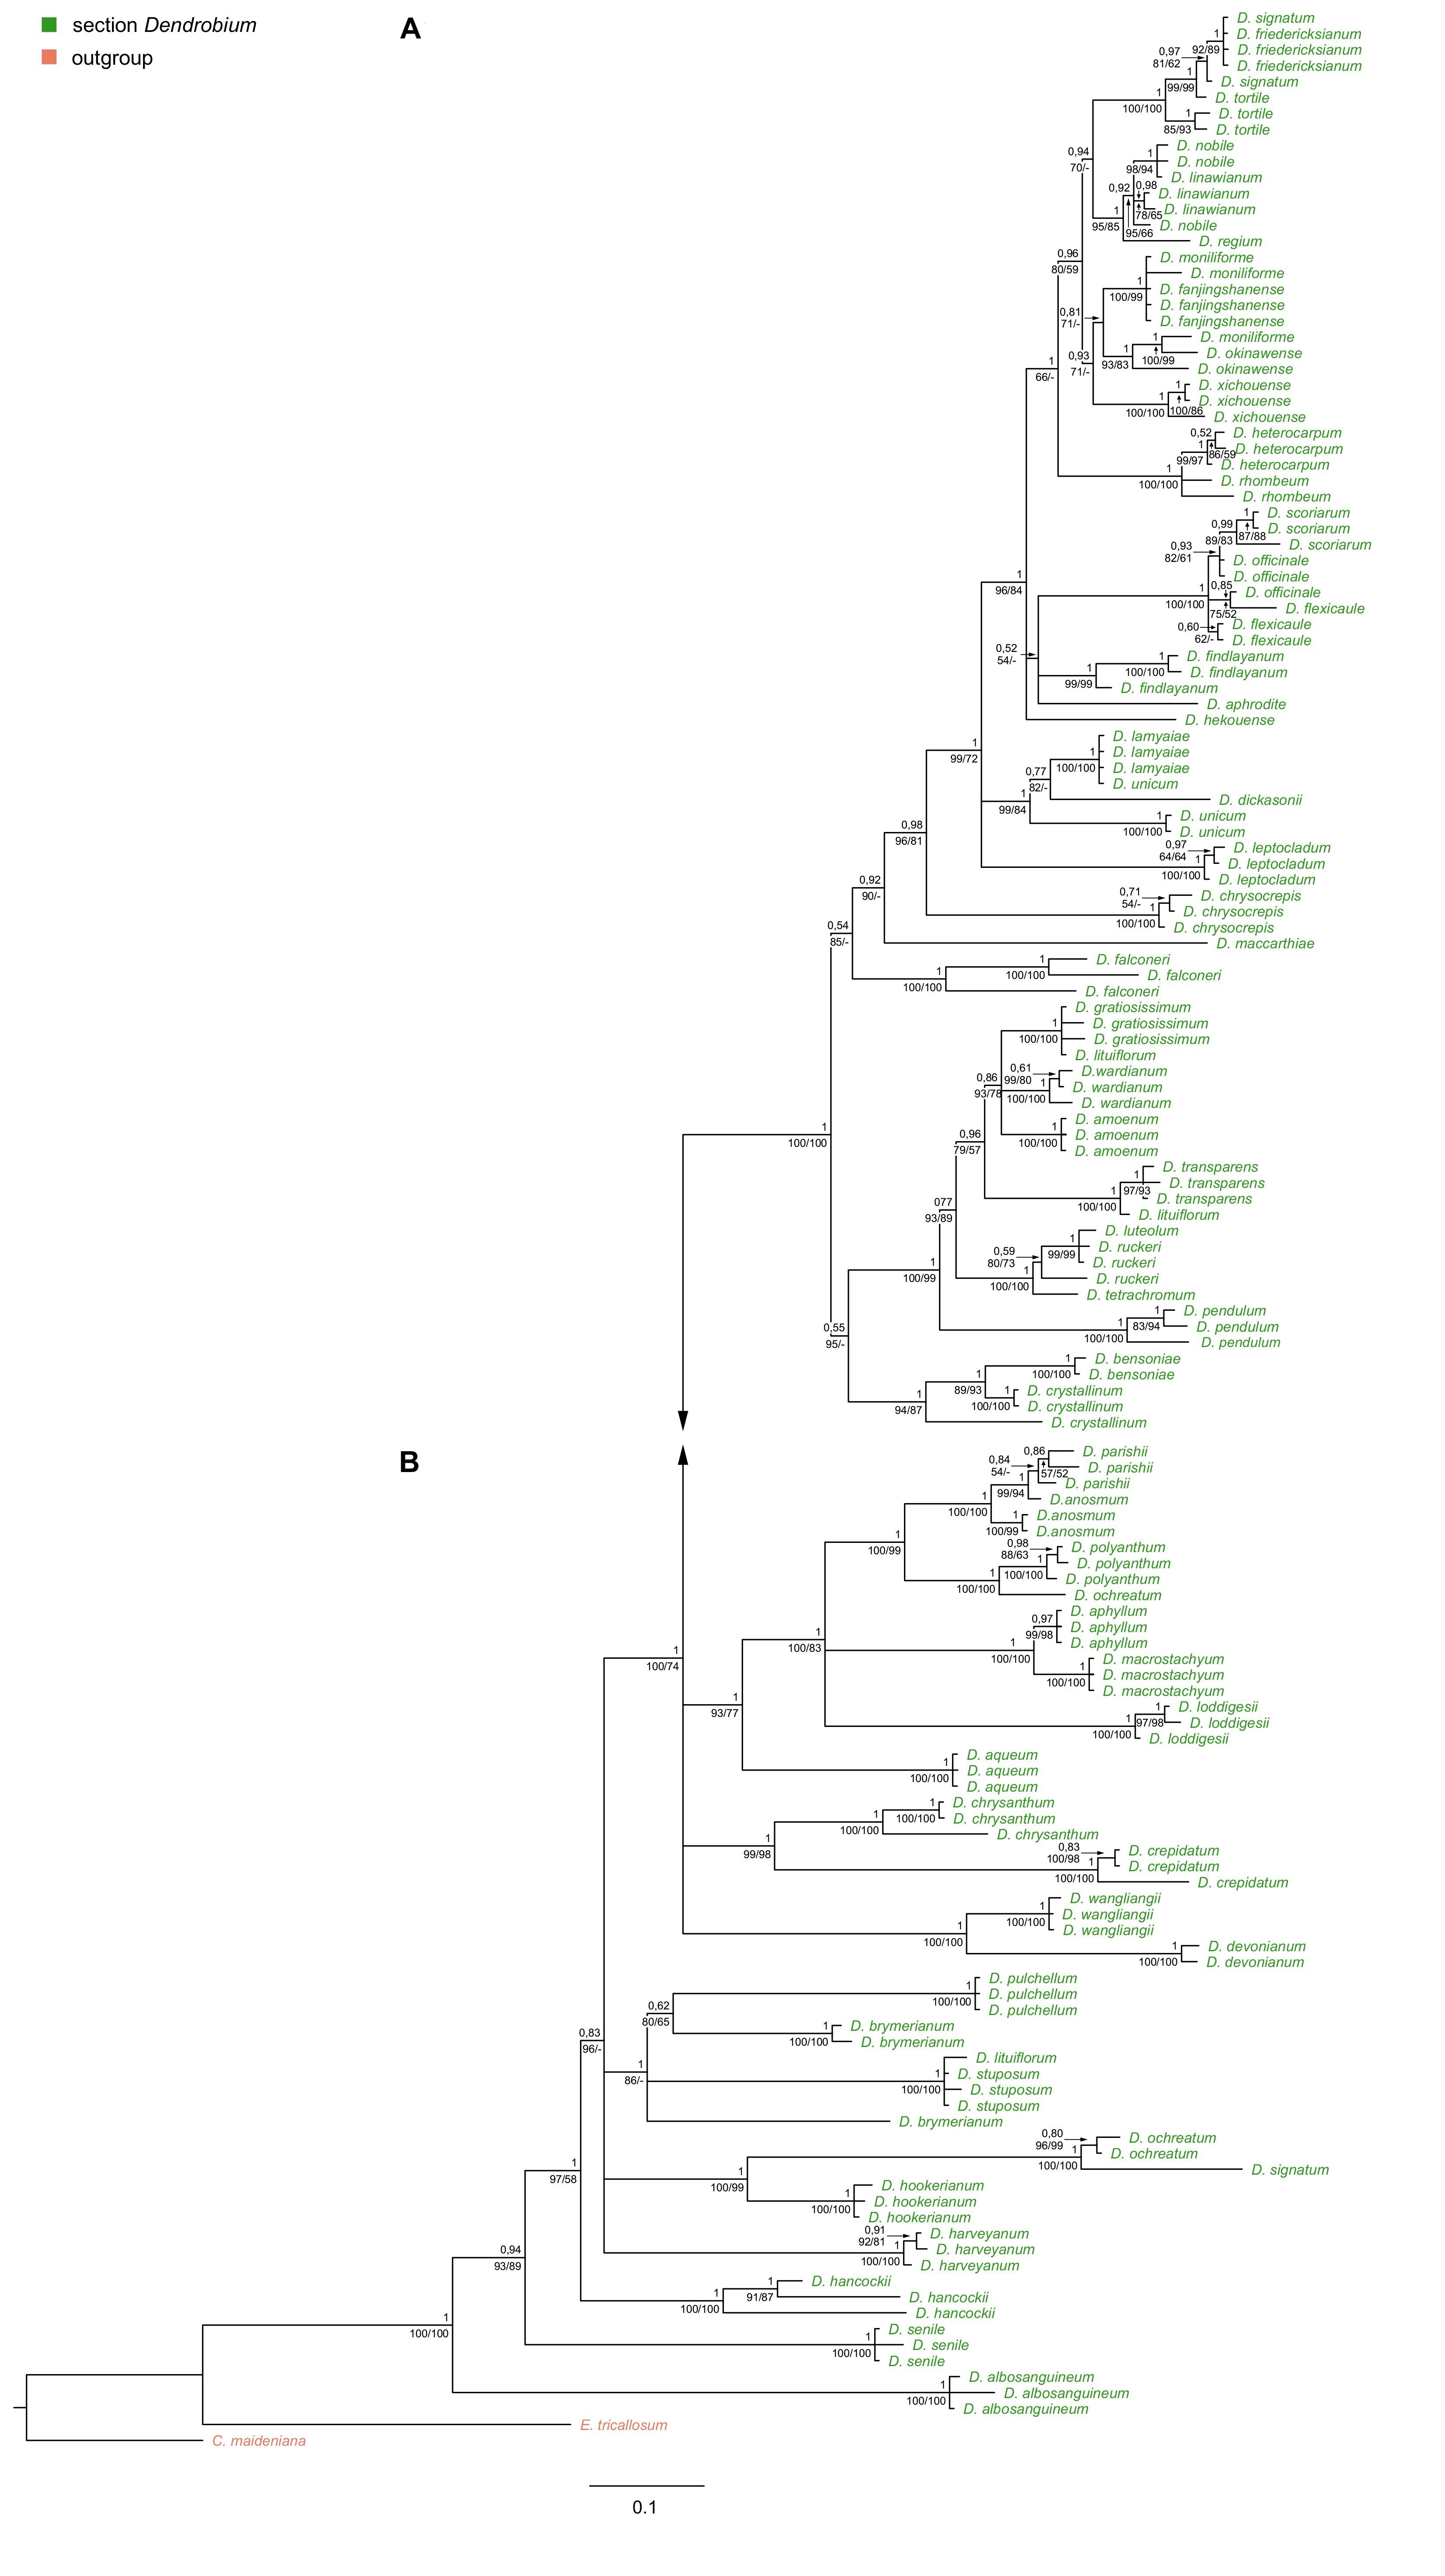
Figure 7
The majority-rule consensus tree resulted in the Bayesian analysis for the trnL-trnF marker of the Dendrobium sect. Dendrobium. The numbers above branches indicate posterior probability (PP) while the numbers below branches mean values of bootstrap support accordingly of maximum likelihood and maximum parsimony analyses. The BS values of less than 50% were marked as -.
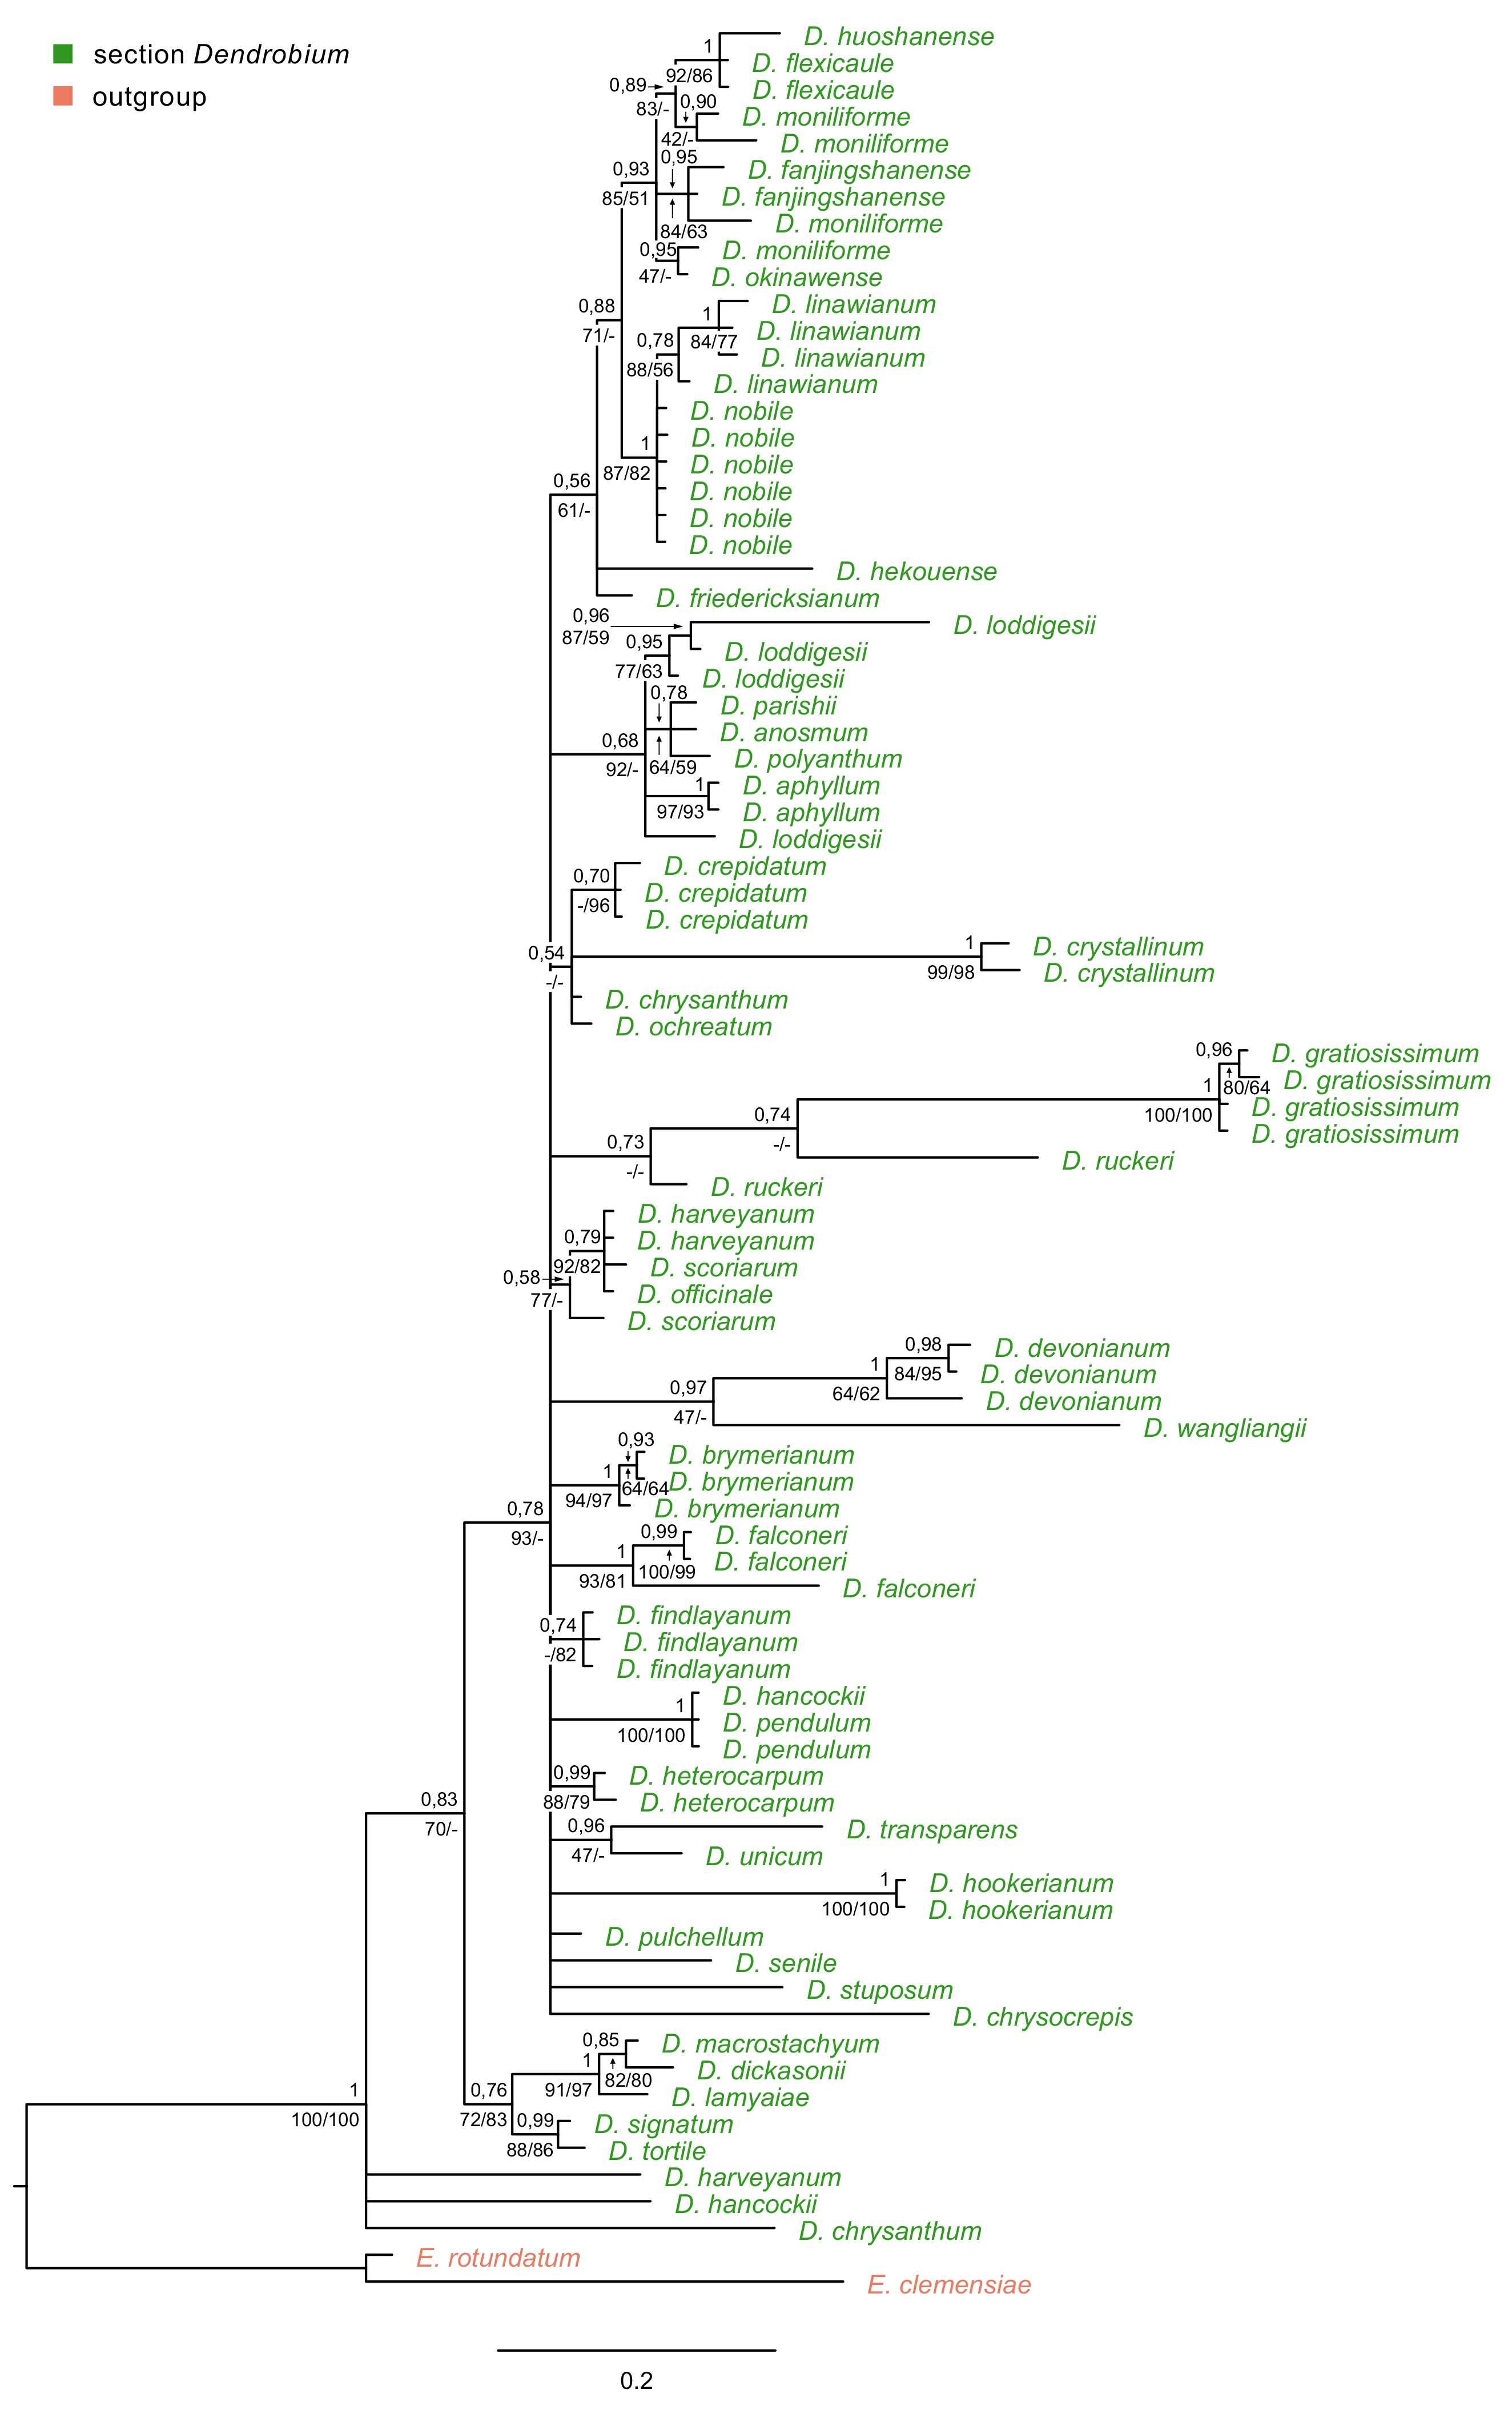
Figure 8
The majority-rule consensus tree resulted in the Bayesian analysis for the matK marker of the Dendrobium sect. Dendrobium. The numbers above branches indicate posterior probability (PP) while the numbers below branches mean values of bootstrap support accordingly of maximum likelihood and maximum parsimony analyses. The BS values of less than 50% were marked as -.
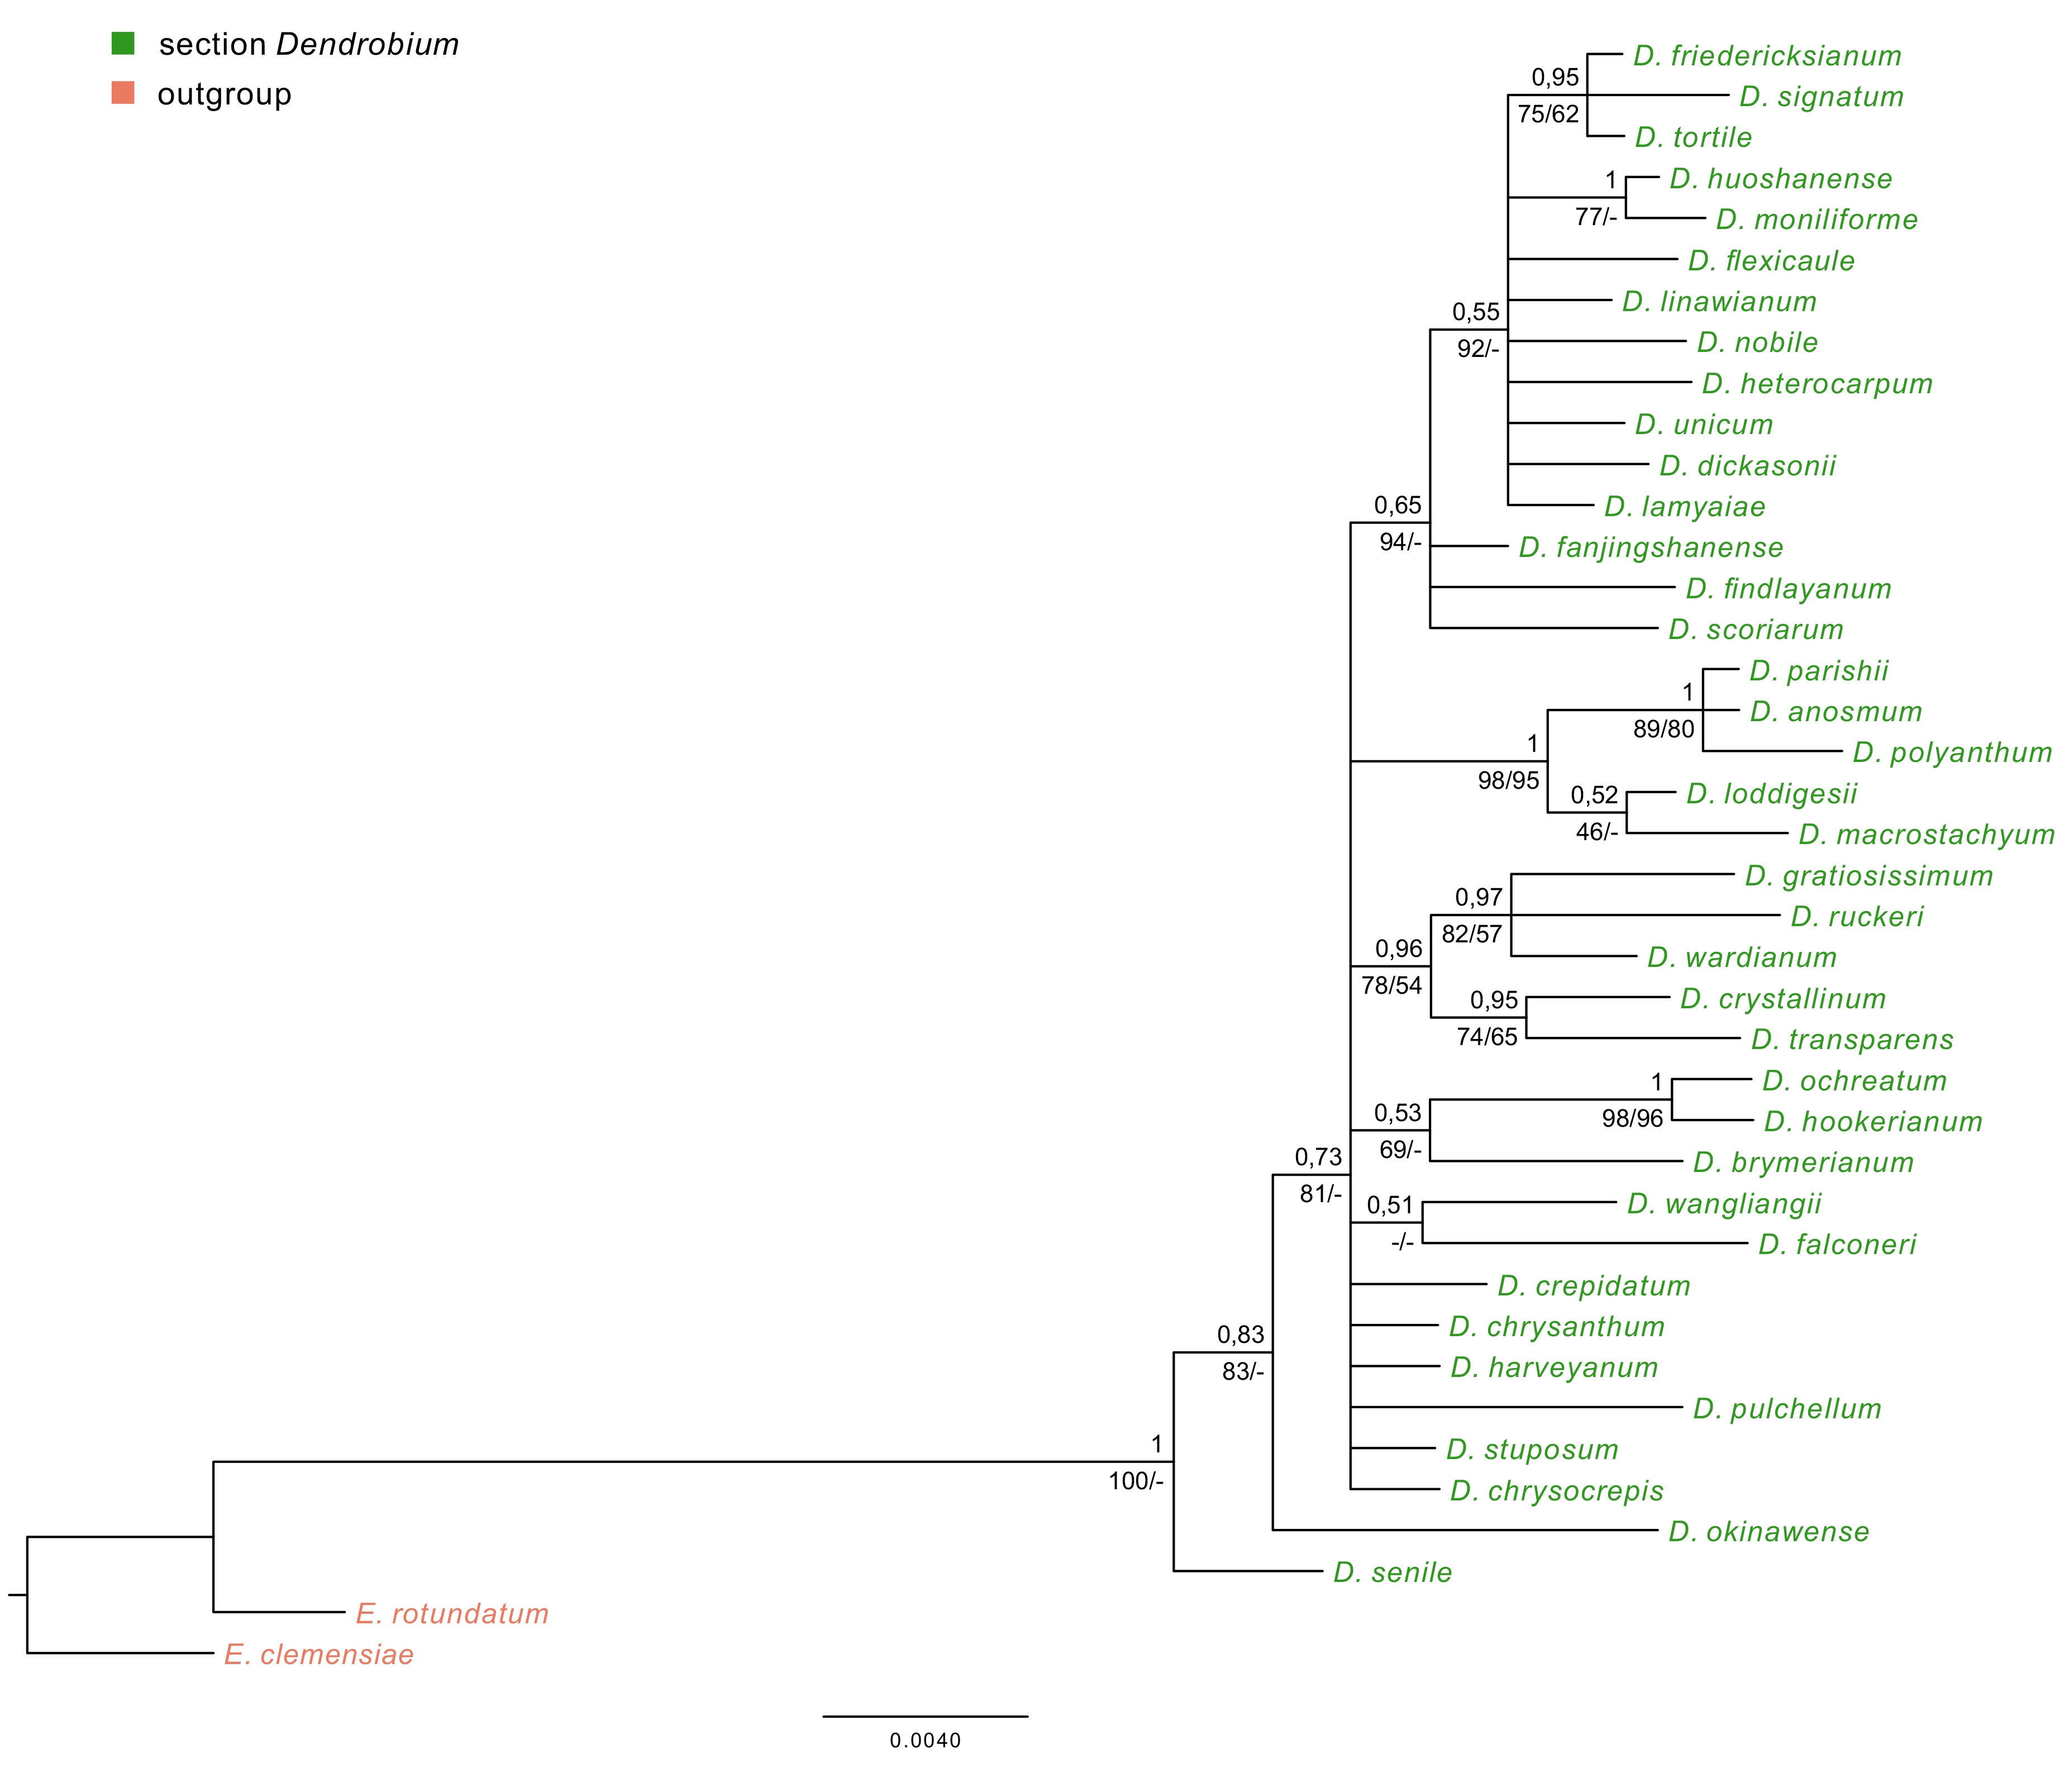
Figure 9
The results of phylogenetic analysis obtained for the Dendrobium species based on the Xdh marker. (A) The majority-consensus tree was obtained in the Bayesian analysis; the numbers above branches indicate posterior probability (PP). (B) The Maximum likelihood tree, the numbers above branches indicate bootstrap support (BS).
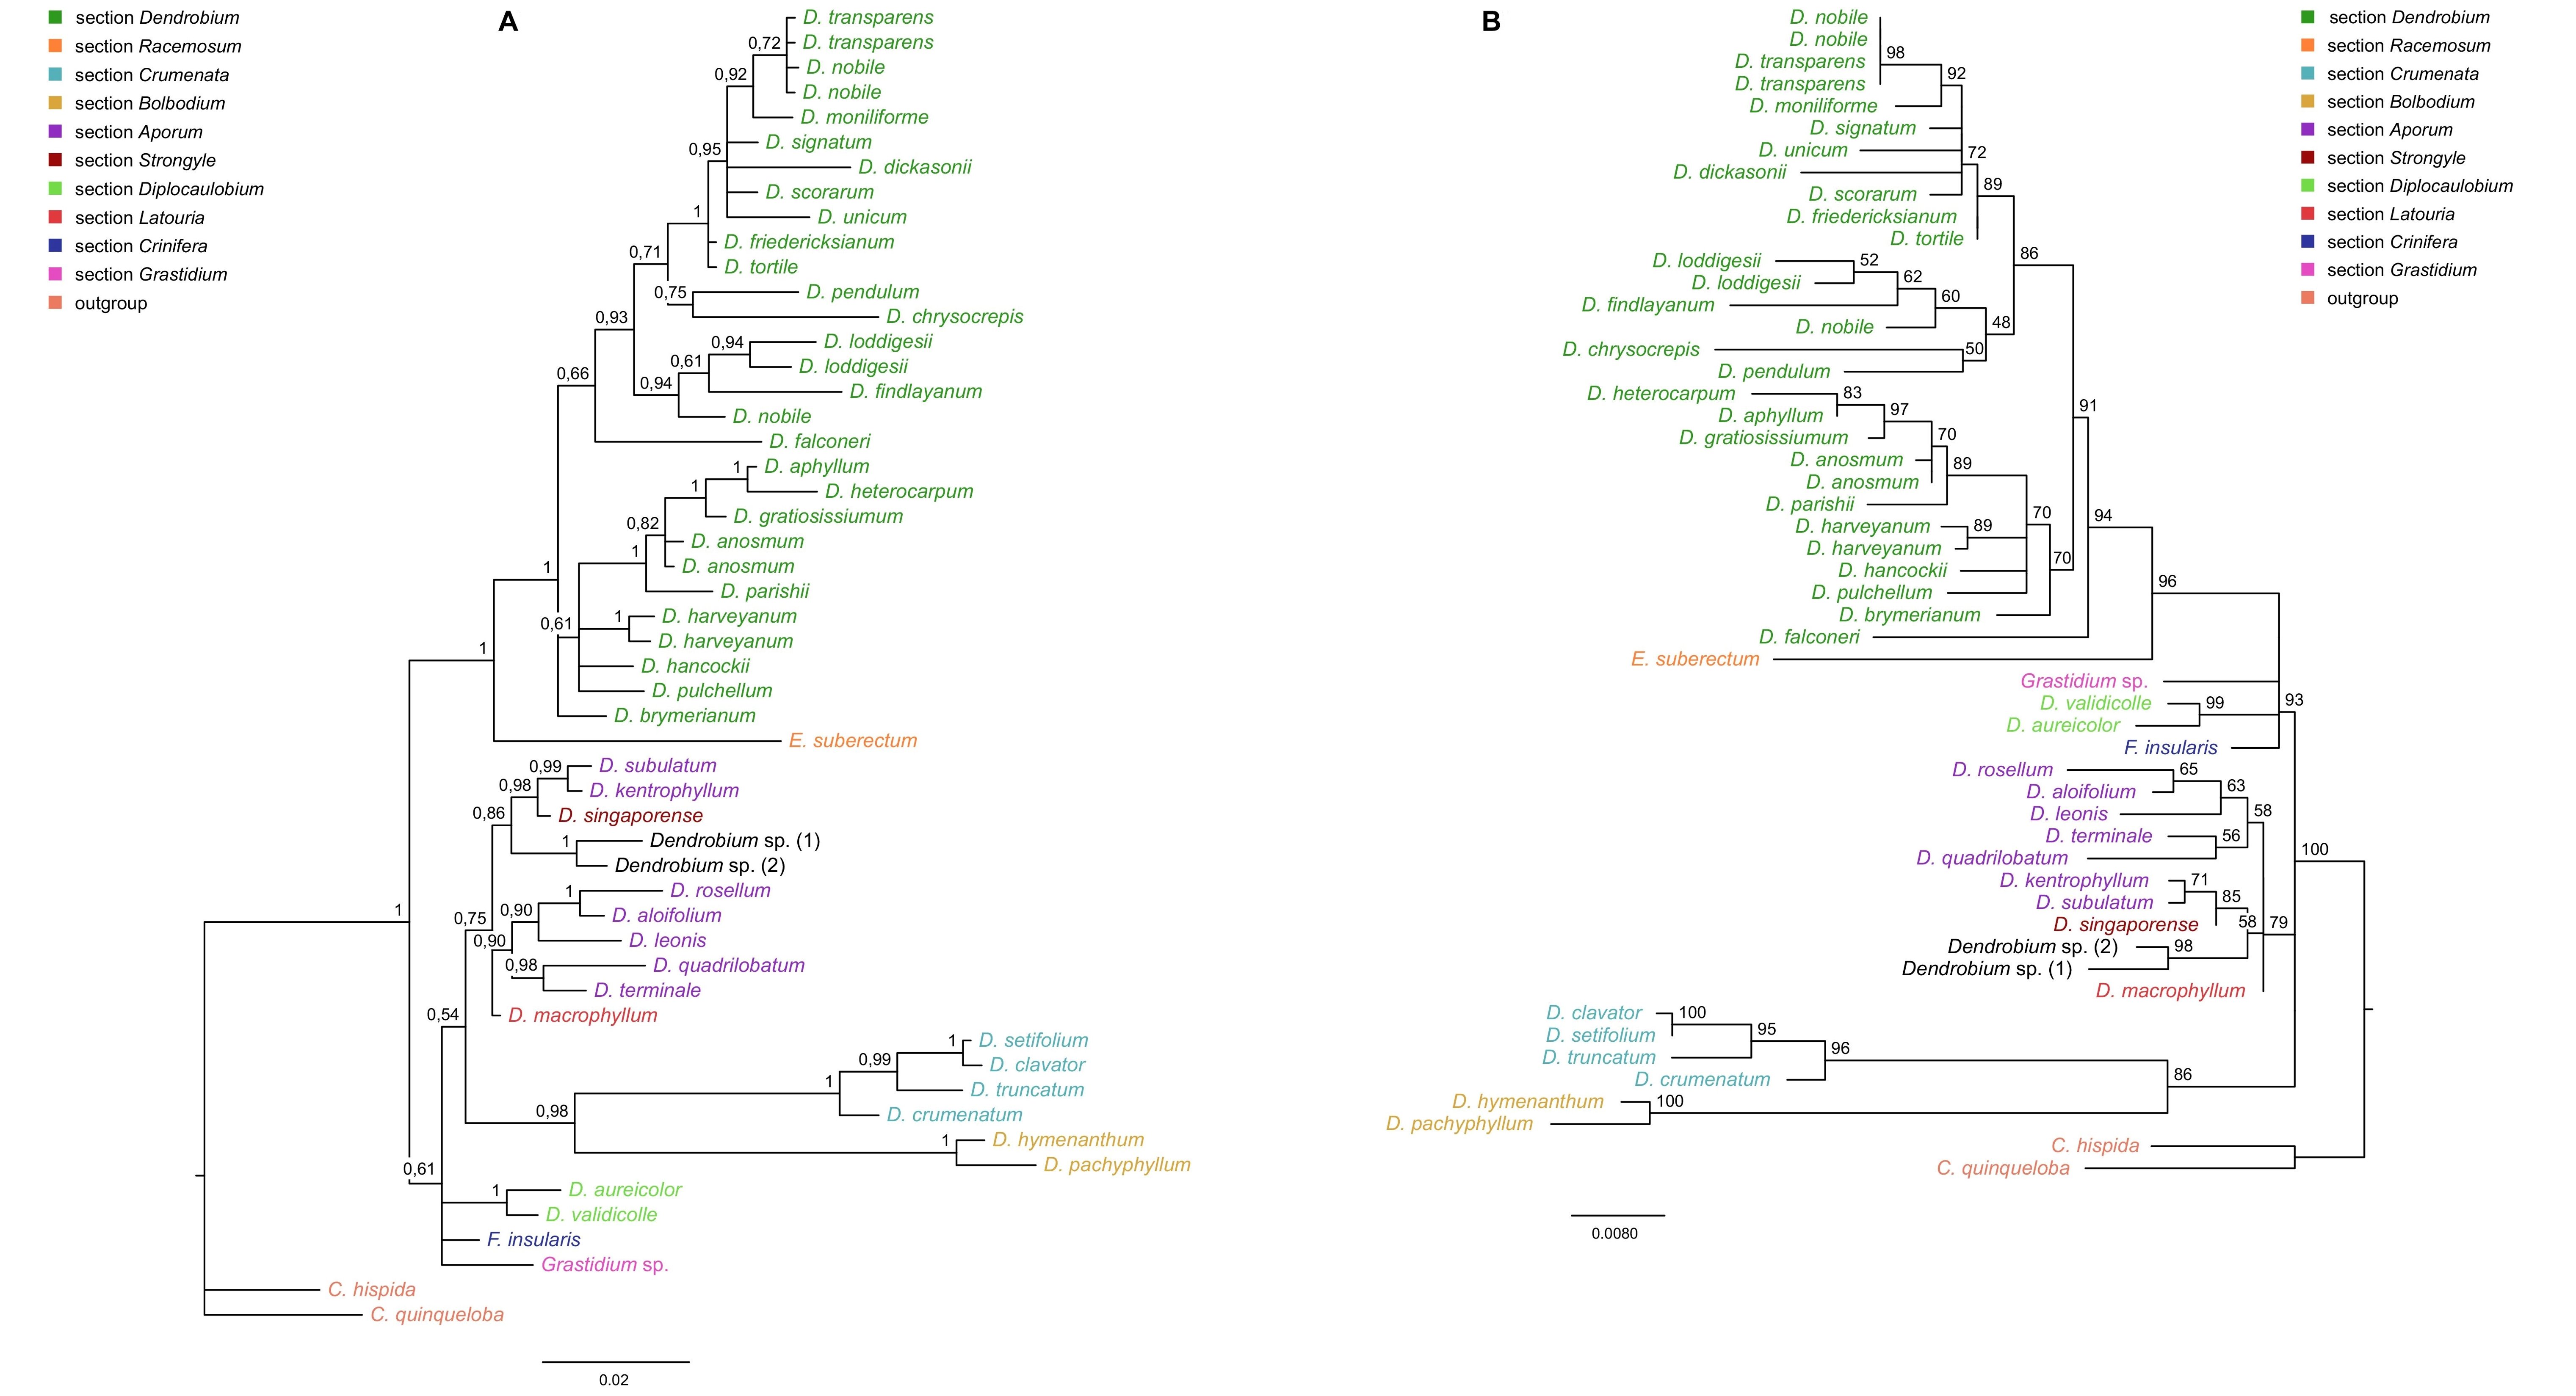
Phylogenetic relationships within the nominal section remain unresolved regardless of the method used (ML or BI). On both trees, species from this section form a strongly supported monophyletic clade (Figure 9A–B, PP=1, BS=96) with Epigeneium suberectum (Ridl.) Summerh. as a sister taxon. Clades, including representatives of each section, diverged as polytomic branches from a common ancestor. We obtained the maximum support of posterior probability (PP=1) and bootstrap (BS=100) at this node. Therefore, it can be inferred that they are closely related, but it is not possible to speculate on the relationship between them.
. Discussion
Although Dendrobium is a widely studied genus, phylogenetic relationships, especially at lower taxonomic levels (e.g., section level), are often unclear and difficult to define. This is partly due to the high degree of morphological variation and partly to the selection of unjustified markers for phylogenetic reconstruction. In our research, we performed statistical analyses to demonstrate the utility of the novel low-copy marker Xdh.
Based on our phylogenetic analyses using the maximum parsimony, maximum likelihood, and Bayesian inference, this marker is believed to not perform well at all levels, at least for the genus Dendrobium. We obtained low support for both the value bootstrap and posterior probability at most nodes for clades embracing species from the same section (Figure 4, Figure 5). Moreover, we observed many polytomic branches. Therefore, we infer that the Xdh gene is unsuitable for solving phylogenetic relationships within closely related species (i.e., within a single section). Consequently, it also does not differentiate relationships within a nominal section (Figure 9A–B). In fact, all samples representing species of this section are grouped into a single coherent clade, with strong support for both posterior probability and bootstrap (PP=1, BS=96; Figure 9A). However, it is impossible to establish relationships between different species within this clade. Nevertheless, we want to emphasize that this does not mean it cannot be used in phylogenetic studies. Some authors have successfully used this marker, which means that at higher taxonomic levels, such as genus or intrafamily, it can give more reliable results (Górniak et al., 2010, 2014; Moudi & Go, 2015; Sang, 2002).
According to our analyses, another, more widespread nuclear marker, i.e., the ITS, performs better in this case. ITS is the most variable marker among the four analyzed regions (Figure 3). In addition, it is quite short and is easier to amplify, due to the significant number of copies in the genome. It is worth mentioning the work of Nguyen et al. (2020) at this point, in which this marker was used. Admittedly, in his study, it was used for species identification, as in the case of Duong et al. (2018) work, but among other markers such as matK, or rbcL, it proved to be the most valuable. Likewise, Feng et al. (2015b) point to the ITS as a suitable barcode and indicate its potential for solving phylogenetic problems. As an effective tool for accurate identification and classification, the ITS regions were also recognized in the paper of Liu et al. (2019), which primarily analyzed species of two sections of Dendrobium: Formosae (Benth. & Hook. f.) Hook. f. and Chrysotoxae Kraenzl. A similar opinion was also expressed by Xiang et al. (2013), whose article additionally presents statistical analyses of the genes used. Not only has this marker enjoyed success recently, but earlier works, e.g., of Lau et al. (2001) or Tsai et al. (2004), have indicated that this marker is suitable and widely used in phylogenetic studies. The ITS region has been used not only to determine relations within Dendrobium but also for other taxa belonging to the Orchidaceae, e.g., Bifrenaria Lindl., Cymbidium Sw., Dactylorhiza Neck. (Burke et al., 2008). A direct comparison of the ITS and Xdh markers shows that the ITS is three times more variable than the other and contains more parsimony-informative sites (Figure 1, Figure 3). In this case, greater variability enables more reliable solutions to taxonomic problems also at lower levels, which is extremely important in the case of Dendrobium. Better-supported clades also occur on trees generated using the ITS rather than Xdh. This is clearly shown in the graph, where we present the percentage of well-supported tree clades for the analyzed markers (Figure 4, Figure 5).
. Conclusions
It should be emphasized that both nuclear markers turned out to be more valuable than plastid ones to solve phylogenetic relationships on various taxonomic levels. In our analyses, neither matK nor trnL-trnF showed a satisfactory effect. The information obtained proves that the nuclear multi-copy marker is more valuable for studying the genus Dendrobium than the low-copy gene and plastid regions.
. Supplementary material
The following supplementary material is available for this article:
Table S1. List of species of Dendrobium used in the molecular study for markers Xdh, ITS, trnL-trnF including Accession Number and GenBank Accession Number.
Table S2. List of species of Dendrobium used in the molecular study for markers ITS, trnL-trnF, matK including GenBank Accession Number.
