. Introduction
Climate change has altered various ecosystems around the world and it is considered to be a major threat to global biodiversity in the future (Lovejoy, 2008). According to some studies, 30% of the species will be extinct by 2070 (Román-Palacios & Wiens, 2020). While the general consequences of global warming, e.g. temperature increase, melting of ice sheets, rise in sea levels, etc. are recognized, the effect of the changes in environment on particular species is difficult to evaluate.
The development of machine-learning techniques (Booth et al., 2014; Phillips et al., 2006) enabled the modeling of the spatial distribution of species under various climate conditions. These predictive distribution models are usually based on WorldClim climate data obtained by interpolating the climate data obtained from meteorological stations around the globe (Fick & Hijmans, 2017). Species distribution models (SDMs) are widely used in research on animals (Colyn et al., 2020; Mudereri et al., 2020; Strubbe et al., 2013), plants (Kaky & Gilbert, 2019; Panda et al., 2018; Wang et al., 2016) and recently also fungi (Davison et al., 2015; Hao et al., 2020; Kivlin et al., 2017). However, global warming affects not only the habitats of particular species (Weiskopf et al., 2020) but also alters ecological interactions (Fontúrbel et al., 2021; Romero et al., 2018; Rosenblatt & Schmitz, 2014) so that a precise prediction of biodiversity loss resulting from climate change requires a more detailed insight into the relationships between species. Specialized ecological interactions (e.g. symbiotic relationships with mycorrhizal fungi) may constrain the distribution of a species as well as its abundance by limiting the availability of suitable habitats or reducing reproductive success (Phillips et al., 2014).
Orchidaceae is considered to be one of the most threatened family of flowering plants (Fay, 2018). They have complex symbiotic associations with various ecological and taxonomic groups of fungi, both mycorrhizal and non-mycorrhizal (Selosse et al., 2021). The former group is represented by rhizoctonias (basidiomycetes belonging to Ceratobasidiaceae, Tulasnellaceae and Serendipitaceae) (Selosse et al., 2021), ectomycorrhizal (basidiomycetes forming ectomycorrhiza with trees and shrubs; tripartite symbiosis) (Ogura-Tsujita et al., 2021; Taylor & Bruns, 1997) and saprotrophic taxa (free-living basidiomycetes, leaf-litter, and wood decomposers, mostly Agaricomycetes) (Ogura-Tsujita et al., 2021; Yagame et al., 2008a). The non-mycorrhizal fungi that asymptomatically inhabit the roots of orchids (and other organs) are called endophytes and are estimated to be more numerous in orchids than mycorrhizal fungi (Ma et al., 2015). Among non-mycorrhizal fungi in orchids, dark septate endophytes (mostly anamorphic ascomycetes (Jumpponen, 2001)) have important ecological functions in stressful environments (Liu et al., 2022) promoting plant growth and development and mitigating biotic and abiotic stresses (e.g. drought tolerance). The life cycles of the fungal partners have evolved (Li et al., 2022), and according to Selosse et al. (2021), the changes occurred at an evolutionary scale and resulted in the transition of some orchid lineages from mixotrophy to mycoheterotrophy.
Usually, each stage in an orchid’s life depends at various levels on more or less specific, complex relationships with fungi (Favre-Godal et al., 2020; McCormick et al., 2006; Sarsaiya et al., 2019). The so-called symbiotic germination is a critical stage in the life cycle of every Orchidaceae representative (Dearnaley, 2007; Rasmussen & Rasmussen, 2009), and it can be affected by differences in the ecology and niche preferences of particular species of fungi (Jersáková & Malinová, 2007). Also, seedling recruitment and population dynamics of orchids are influenced by the availability of suitable species of fungi (Jersáková & Malinová, 2007; McCormick et al., 2018). Besides fungal symbionts, non-associated fungi also have a substantial role in shaping the primary environment of the orchid-fungus association (Pecoraro et al., 2018). The adult phase of an orchid is affected by fungi at different levels depending on their trophic mode, e.g. mycoheterotrophy (non-photosynthetic orchids), mixotrophy (photosynthetic but using also fungal carbon) or autotrophy, with an addiction to fungal carbon in descending order (Selosse et al., 2021). Noteworthy, besides the availability of both groups of partners (fungi and plant) and the appropriate abiotic environmental conditions, the success of the orchid-fungus symbiosis depends on bacteria whose role was neglected for a long time and is still underestimated (Hao et al., 2020; Kaur & Sharma, 2021).
The long-term stability of any orchid population is very dependent on the availability of symbiotic organisms, and maintaining a mutualistic relationship with fungi is crucial for the conservation of Orchidaceae (Batty et al., 2002; Phillips et al., 2020). While Orchidaceae is one of the largest families of flowering plants, there are few studies on predicting the effect of climate change on orchids (Kolanowska & Jakubska-Busse, 2020; Kolanowska et al., 2017, 2020; Konowalik & Kolanowska, 2018). Moreover, very few studies include analyses of the future distribution of orchid pollen vectors (Kolanowska, 2021; Kolanowska et al., 2021), and just one includes the availability of mutualistic fungi (Kolanowska, 2023).
The aim of this study was to evaluate the importance of fungi for the orchid occurrence by estimating the effect of climate change on the distribution of two orchid species and their fungal symbionts using ecological niche modeling (ENM).
. Material and methods
. Species studied
Cymbidium kanran Makino is an endangered mixotrophic species of orchid that occurs in north Vietnam and southern China at altitudes of between 700 and 1,800 m. This species produces narrowly ovoid, often conspicuous, 3–5-leaved pseudobulbs. Its flowers are large (5–7.5 cm), strongly lemon peel scented, arranged in many-flowered inflorescences (Cribb & Puy, 2007). Two species of basidiomycetes: Russula brevipes Peck and R. cyanoxantha (Schaeff.) Fr. Are symbionts of C. kanran (Hong et al., 2015). These fungi belong to the species-rich genus forming ectomycorrhizal symbiosis with many species of trees and shrubs (Kirk et al., 2008). While the latter is widespread in Europe, North and Central America as well as Asia and Australia, the former was for a long time known exclusively from North America and only in 2006 found in Pakistan. Due to the incomplete data on its distribution, R. brevipes was not included in the modeling.
Epipogium roseum (D. Don) Lindl. Is a mycoheterotrophic, leafless species with an ovoid, horizontal tuber giving rise to an erect, fleshy stem. The flowers of this orchid are white with faint purple spots on the lip. E. roseum is characterized by an intercontinental disjunction in its geographical range. It occurs in Africa (Ghana, Nigeria, Central African Republic, Cameroon, Gulf of Guinea Island, Zaire, Kenya, Uganda, Angola, and Malawi). It is also present in the eastern and western Himalayas, Nepal, Bhutan, lower India, Pakistan, Sri Lanka, Myanmar, Thailand, Laos, Vietnam, Japan, Ryukyu Islands, Taiwan, Malaysia, Java, Lesser Sunda Islands, Moluccas, Philippines, Sumatra, Timor, Papua New Guinea, Solomon Islands, Queensland and New South Wales, Australia, Fiji, New Caledonia, and Vanuatu. The general altitudinal range of E. roseum extends up to 2,000 m. Coprinellus disseminatus (Pers.) J.E. Lange (Basidiomycota) is identified as one of its symbionts (Yagame et al., 2008a). It is a cosmopolitan, free-living saprotrophic fungus found in Europe, North America and most parts of Asia, and in South America and Australia.
. List of localities
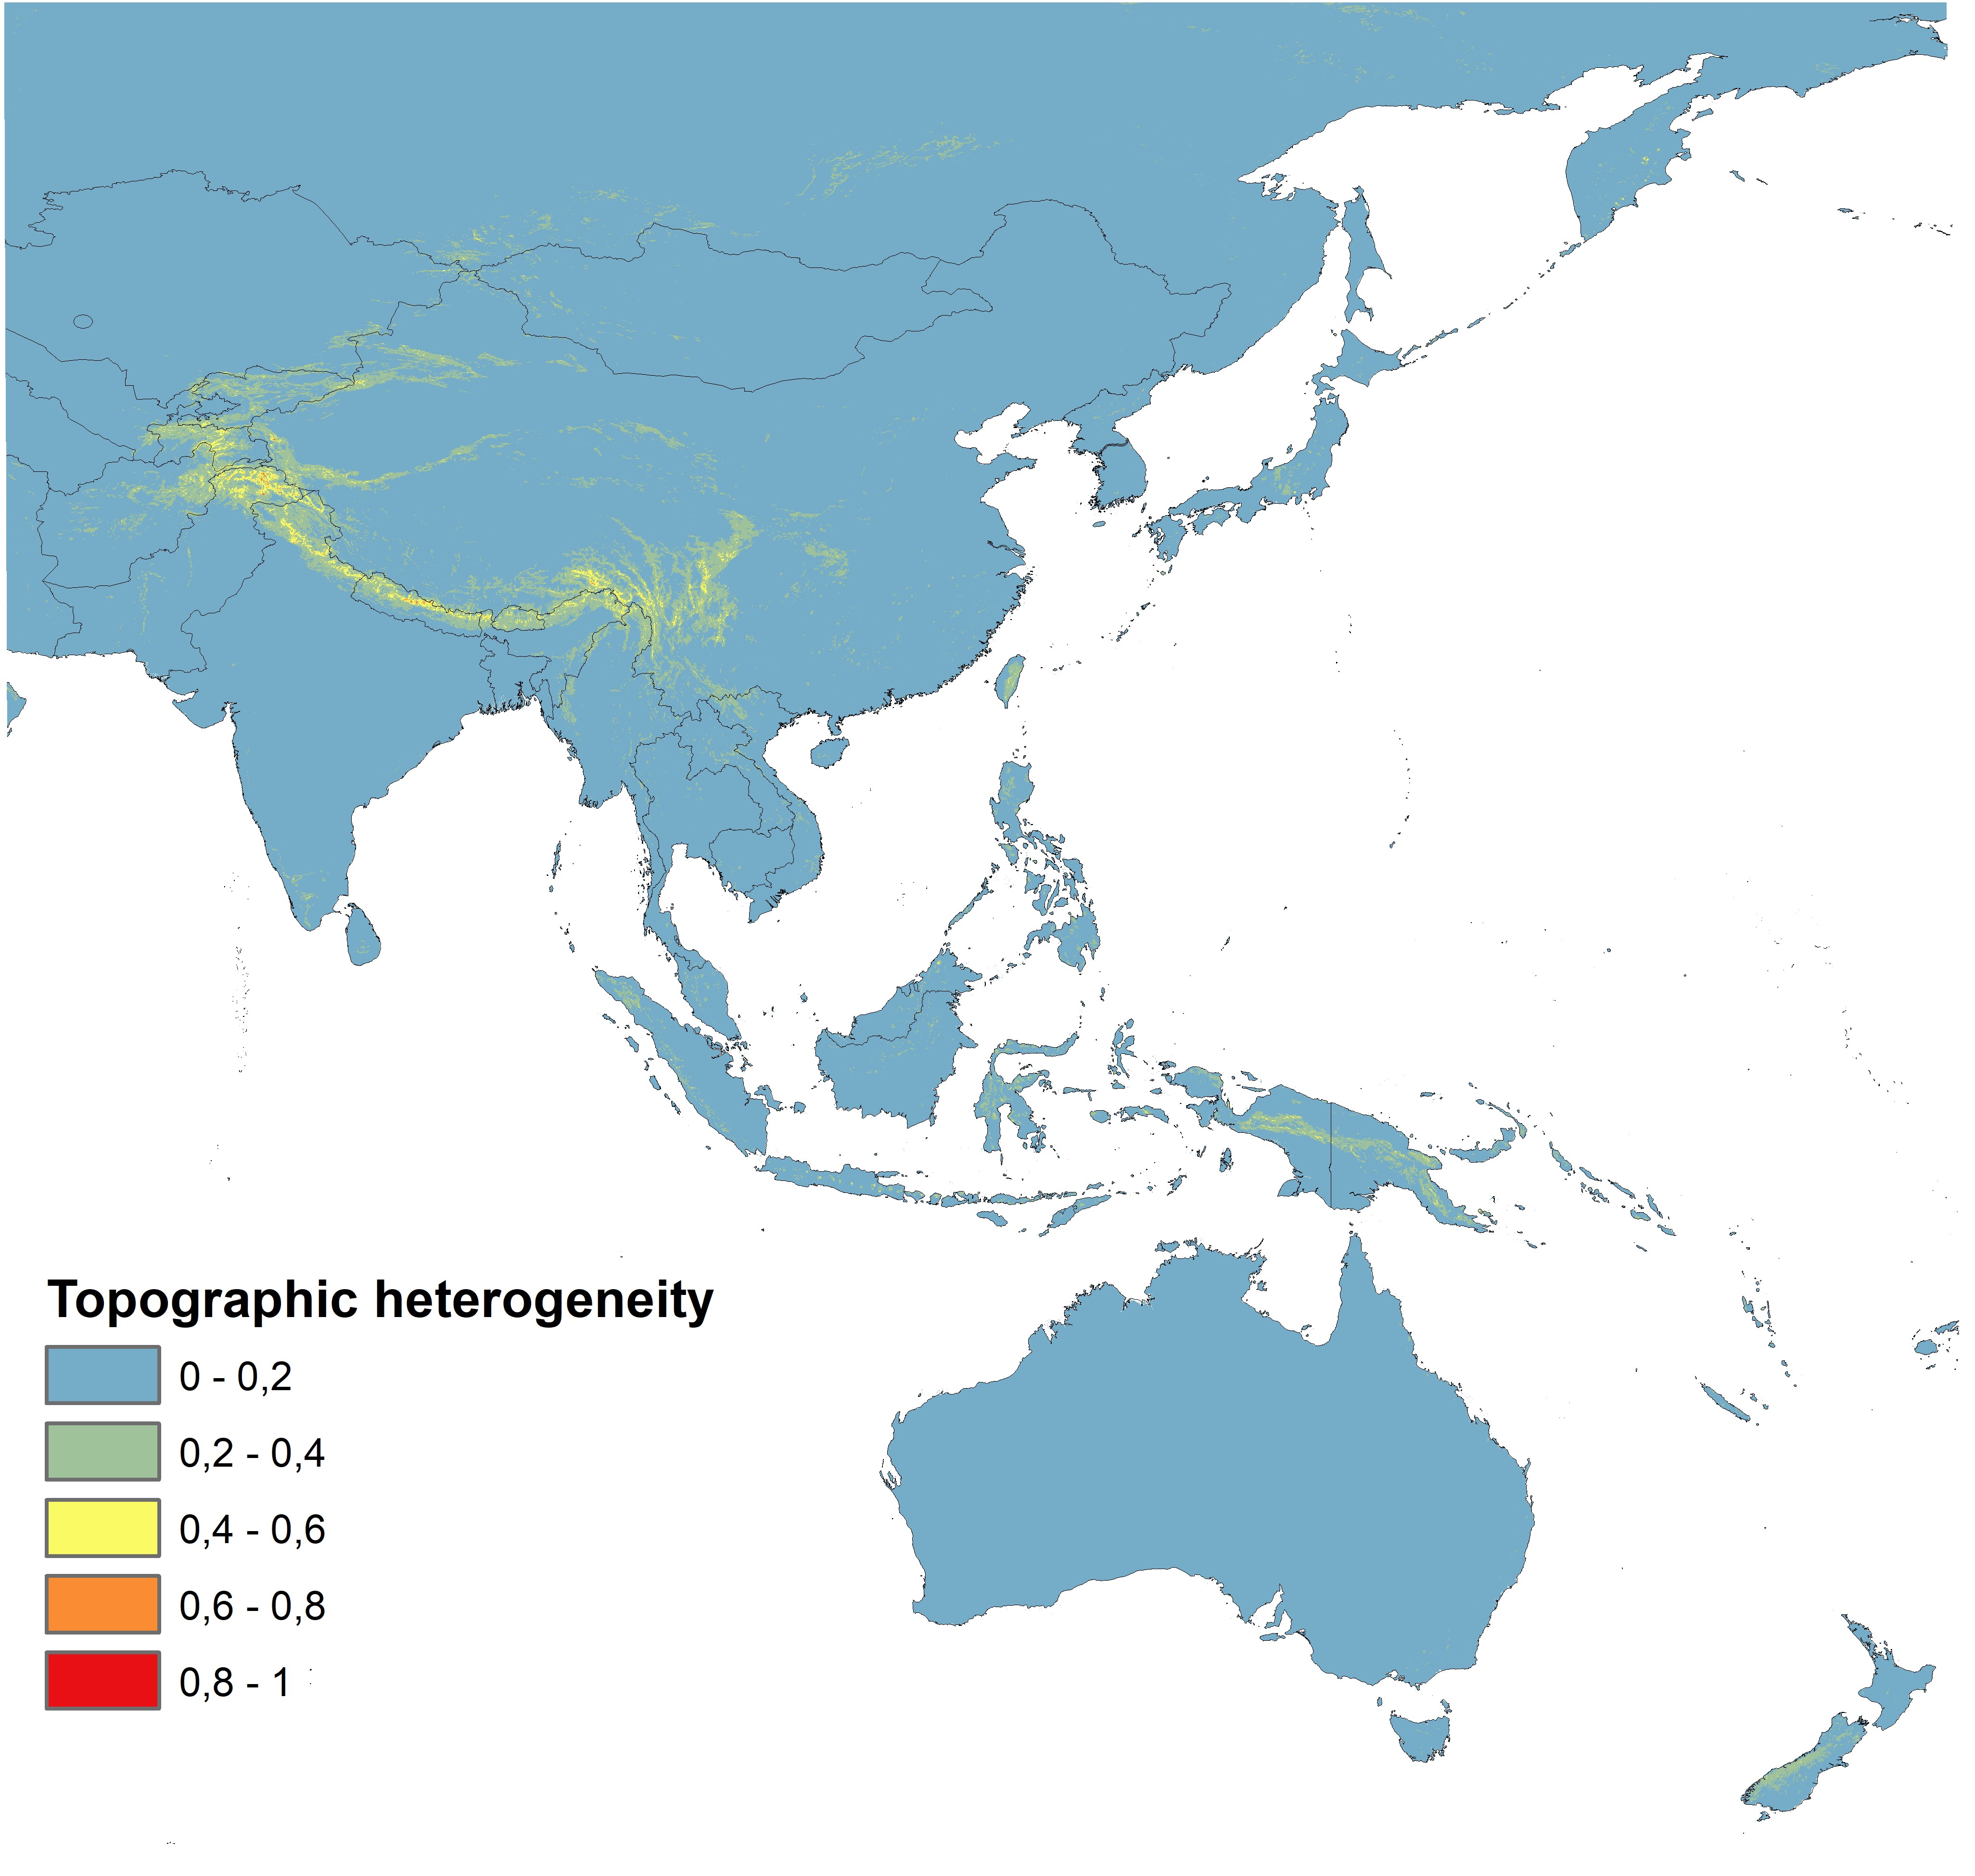
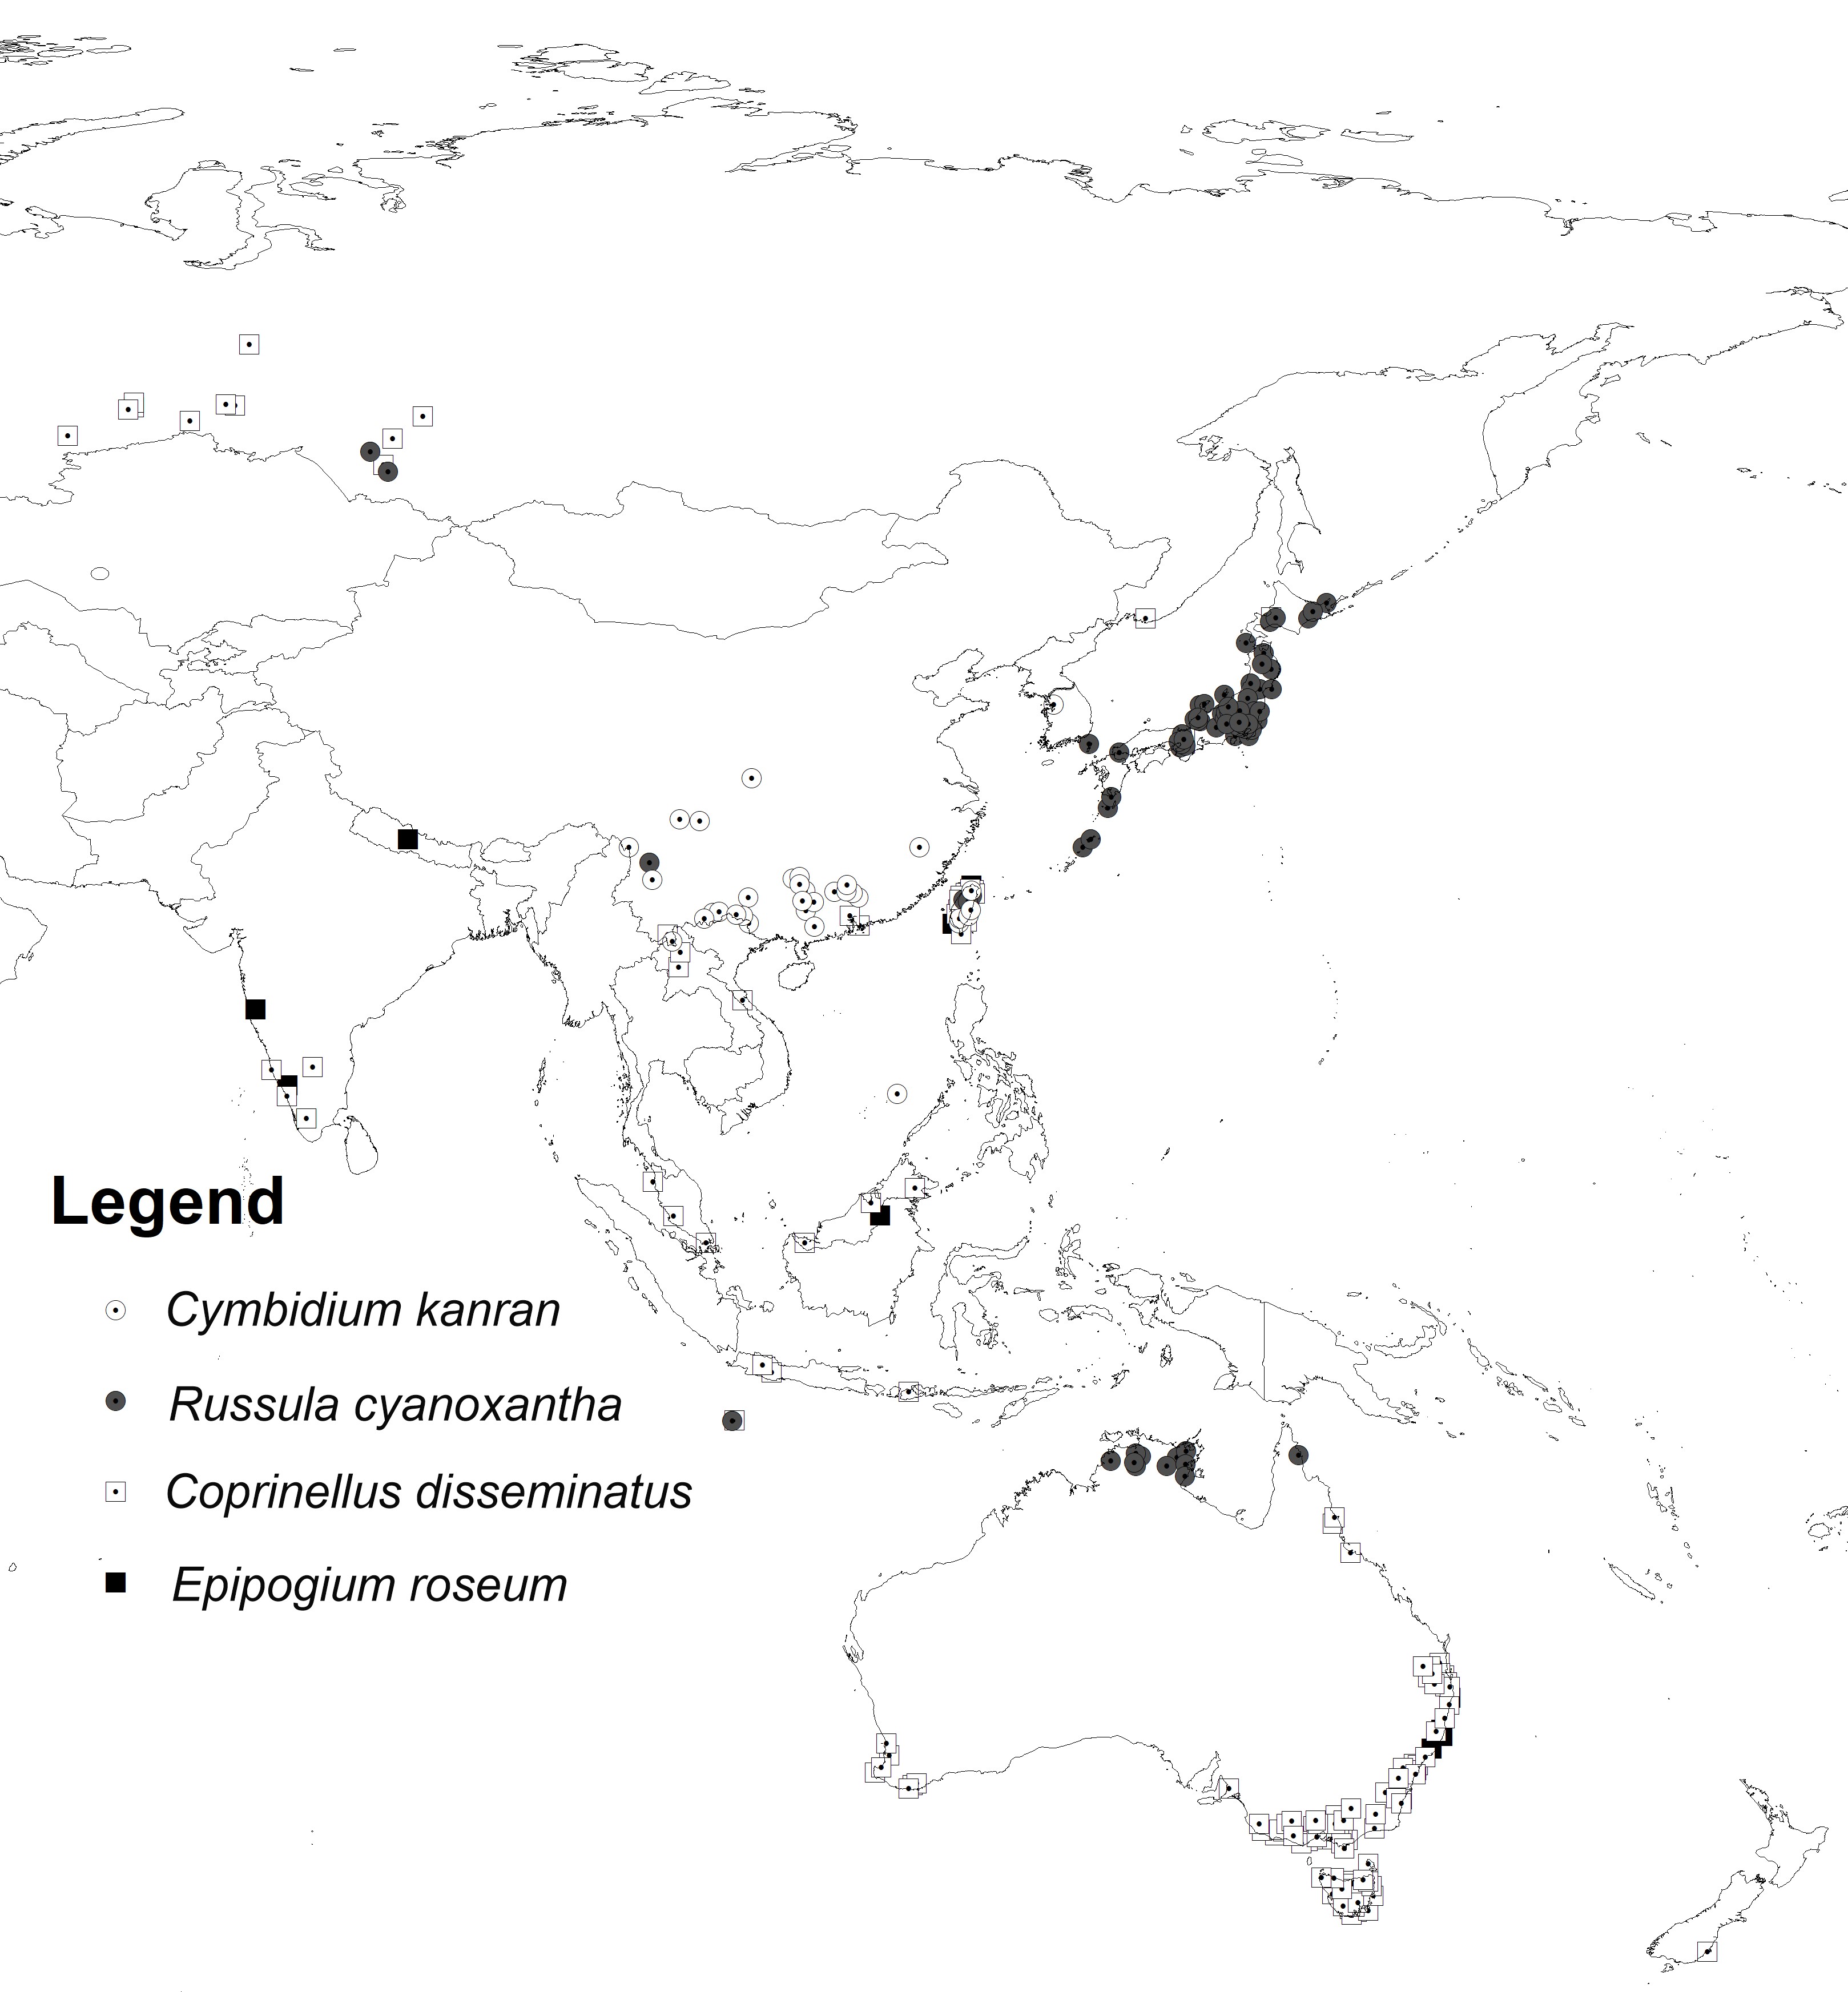
A database of orchid and fungi localities was compiled based on records included in the Global Biodiversity Information Facility (GBIF). The initial dataset was verified, and duplicate records for localities were removed, and only georeferenced records with a precision of at least 1 km were retained. Spatial thinning was done using SDMtoolbox 2.3 for ArcGIS (Brown, 2014; Brown et al., 2017) in order to reduce the spatial bias of the samples (Kramer-Schadt et al., 2013; Tourne et al., 2019; Veloz, 2009). For this process, the study area was divided into five classes of topographic heterogeneity (Luoto & Heikkinen, 2008) (Figure 1), which was quantified from the mean difference between elevation data of each grid cell and the eight neighboring cells based on the Shuttle Radar Topography Mission (SRTM). Records were spatially filtered at 5.0, 10.0, 15.0, 20.0, and 25.0 km in areas of high, medium-high, medium, medium-low, and low heterogeneity, respectively. Only records within the area studied were retained. Analyses were limited to 14.2°S–56.3°N and 66.2–155.9°E for C. kanran and R. cyanoxantha and to 48.6°S–65.8°N and 58.4–180°E for E. roseum and C. disseminatus. The GBIF datasets with the initial number of localities for each species are provided in Table S1, and records used in the analyses are listed in Table S2 and presented in Figure 2.
. Ecological niche modeling
MaxEnt version 3.3.2 (Babar et al., 2012; Elith et al., 2011) was used for ecological niche modeling based on presence-only observations. The analyses were based on bioclimatic variables in 30 arc-seconds of interpolated climate surface downloaded from WorldClim v. 2.1 (Booth et al., 2014; Fick & Hijmans, 2017). Because only a small area was included in the ENM analysis, it is more reliable than modeling habitat suitability at a global scale (Barve et al., 2011; Mendes et al., 2020); the background analyzed was restricted to 14.2°S–56.3°N and 66.2–155.9°E for C. kanran and to 48.6°S–65.8°N and 58.4–180°E for E. roseum. The correlations between the bioclimatic layers were evaluated using Pearson’s correlation coefficient computed in SDMtoolbox 2.3 for ArcGIS (Brown, 2014), and the variables with correlations above 0.8 were not included in the analyses (Table S3). For removing highly correlated variables the concept of retaining layers that best represent the original input data on climate and are not derived from several layers or a subset of the data was followed. The final set of bioclimatic variables included seven layers: bio1, bio2, bio3, bio8, bio12, bio14 and bio15. Codes for these layers are provided in Table 1.
Table 1
Codes of the bioclimatic variables used in the analyses.
General circulation models (GCMs), describing the dynamics of physical components of the circulation in the atmosphere and ocean (Flato et al., 2013), are essential for any research on the effect of climate change on living organisms. Numerous GCMs were created for the Coupled Model Intercomparison Project (Fajardo et al., 2020) and several studies compared the reliability of these simulations mostly at a regional scale (Fordham et al., 2011; Kamworapan et al., 2021). In this study forecasts of the future distribution of the climatic niches of the species studied in 2080–2100 were made based on climate projections developed by the CNRM/CERFACS (Voldoire et al., 2019) as this GCM works well for the Asian region (Kamworapan et al., 2021).
Four Shared Socio-economic Pathways (SSPs): SSP1-2.6, SSP2-4.5, SSP3-7.0 and SSP5-8.5 (Guivarch et al., 2016; McGee et al., 2000; van Vuuren et al., 2017) were analyzed. These scenarios are high-priority scenarios in the Sixth Assessment report of the IPCC. The SSP1-2.6 is a 2 °C scenario with a 2100 radiative forcing level of 2.6 W m−2. The SSP2-4.5 is a scenario with a nominal 4.5 W m−2 radiative forcing level by 2100. The SSP3-7.0 scenario is a medium-high scenario within the “regional rivalry” socio-economic family and SSP5-8.5 marks the upper edge of the SSP scenario spectrum with a high reference scenario for a high fossil-fuel using area of the world throughout the 21st century (Meinshausen et al., 2020; Schandl et al., 2020; van Vuuren et al., 2017).
Two sets of models were created for each orchid-fungus pairing: (1) models of the distributions of orchid and fungus-based exclusively on bioclimatic variables, (2) models of the distribution of the orchid based on bioclimatic variables and the predicted distribution of the symbiotic fungus (output of modeling based on climatic data).
In all analyses, the maximum number of iterations was set to 10,000 and convergence threshold to 0.00001. A neutral (= 1) regularization multiplier value and auto features were used. All samples were added to the background. The “random seed” option, which provided a random test partition and background subset for each run was applied. 20% of the samples were used as test points. The run was performed as a bootstrap with 100 replicates and the output was set to logistic. All operations on GIS data were done using ArcGis 10.8.2 (Esri, Redlands, CA, USA). In addition, in order to avoid extrapolations outside the training data’s environmental range, the “fade by clamping” function, which removes heavily clustered pixels from the final predictions in MaxEnt, was enabled (Owens et al., 2013; Phillips et al., 2006; Tobena et al., 2016). The evaluation of the models was done using the area under the curve (AUC) (Mason & Graham, 2002) and True Skill Statistic (TSS) (Čengić et al., 2020; Shabani et al., 2016). The jackknife test was used to detect the most important bioclimatic variables that shape the species’ geographic range (Convertino et al., 2012).
To evaluate the bioclimatic tolerances of the orchids studied the predicted niche occupancy profiles (PNOs) were created using the Phyloclim package (Heibl & Calenge, 2013). These profiles combine the probability of species occurrence derived from ecological niche modeling and the response of each species to a given environmental variable.
. Estimate of the effect of climate change
SDMtoolbox 2.3 for ArcGIS (Brown, 2014) was used to determine changes in the distribution of suitable niches for the species studied triggered by climate change. To compare maps created for current climatic conditions with future models, all SDMs were converted into binary rasters and projected using the Goode homolosine projection. The maximum Kappa value was used as the presence threshold (Freeman & Moisen, 2008) in the analyses of changes in range. Kappa statistic measures the proportion of correctly classified locations after accounting for the probability of agreement by chance. To calculate the current potential range of the species (current coverage of suitable niches), the area suitable for the species’ occurrence in both compared models was summed with the predicted area of range contraction in the future model. To calculate future coverage of suitable niches, the area suitable for the species occurrence in both compared models was summed with the predicted area of predicted range expansion.
. Results
. Evaluation of models and limiting factors
All models had high scores for both the AUC (0.964–0.985) and TSS (0.781–0.917) tests (Table S4). The presence threshold value, which is equal to the Max Kappa value and used to evaluate changes in the distribution of suitable niches of the species studied, is presented.
Based on the models that included both bioclimatic factors and distribution of the symbiotic fungi the most important factors limiting the occurrence of C. kanran are the annual mean temperature (bio1) and probability of the presence of R. cyanoxantha. In the case of E. roseum the occurrence of symbiotic fungi was crucial. The other important factor limiting the distribution of E. roseum is the annual precipitation (bio12). The geographical ranges of both orchids are also limited by the mean diurnal range (bio2; Figure 3).
Figure 3
Results of the jackknife test of variable importance created for C. kanran (A) and E. roseum (B). Values shown are averages over number of replicates.
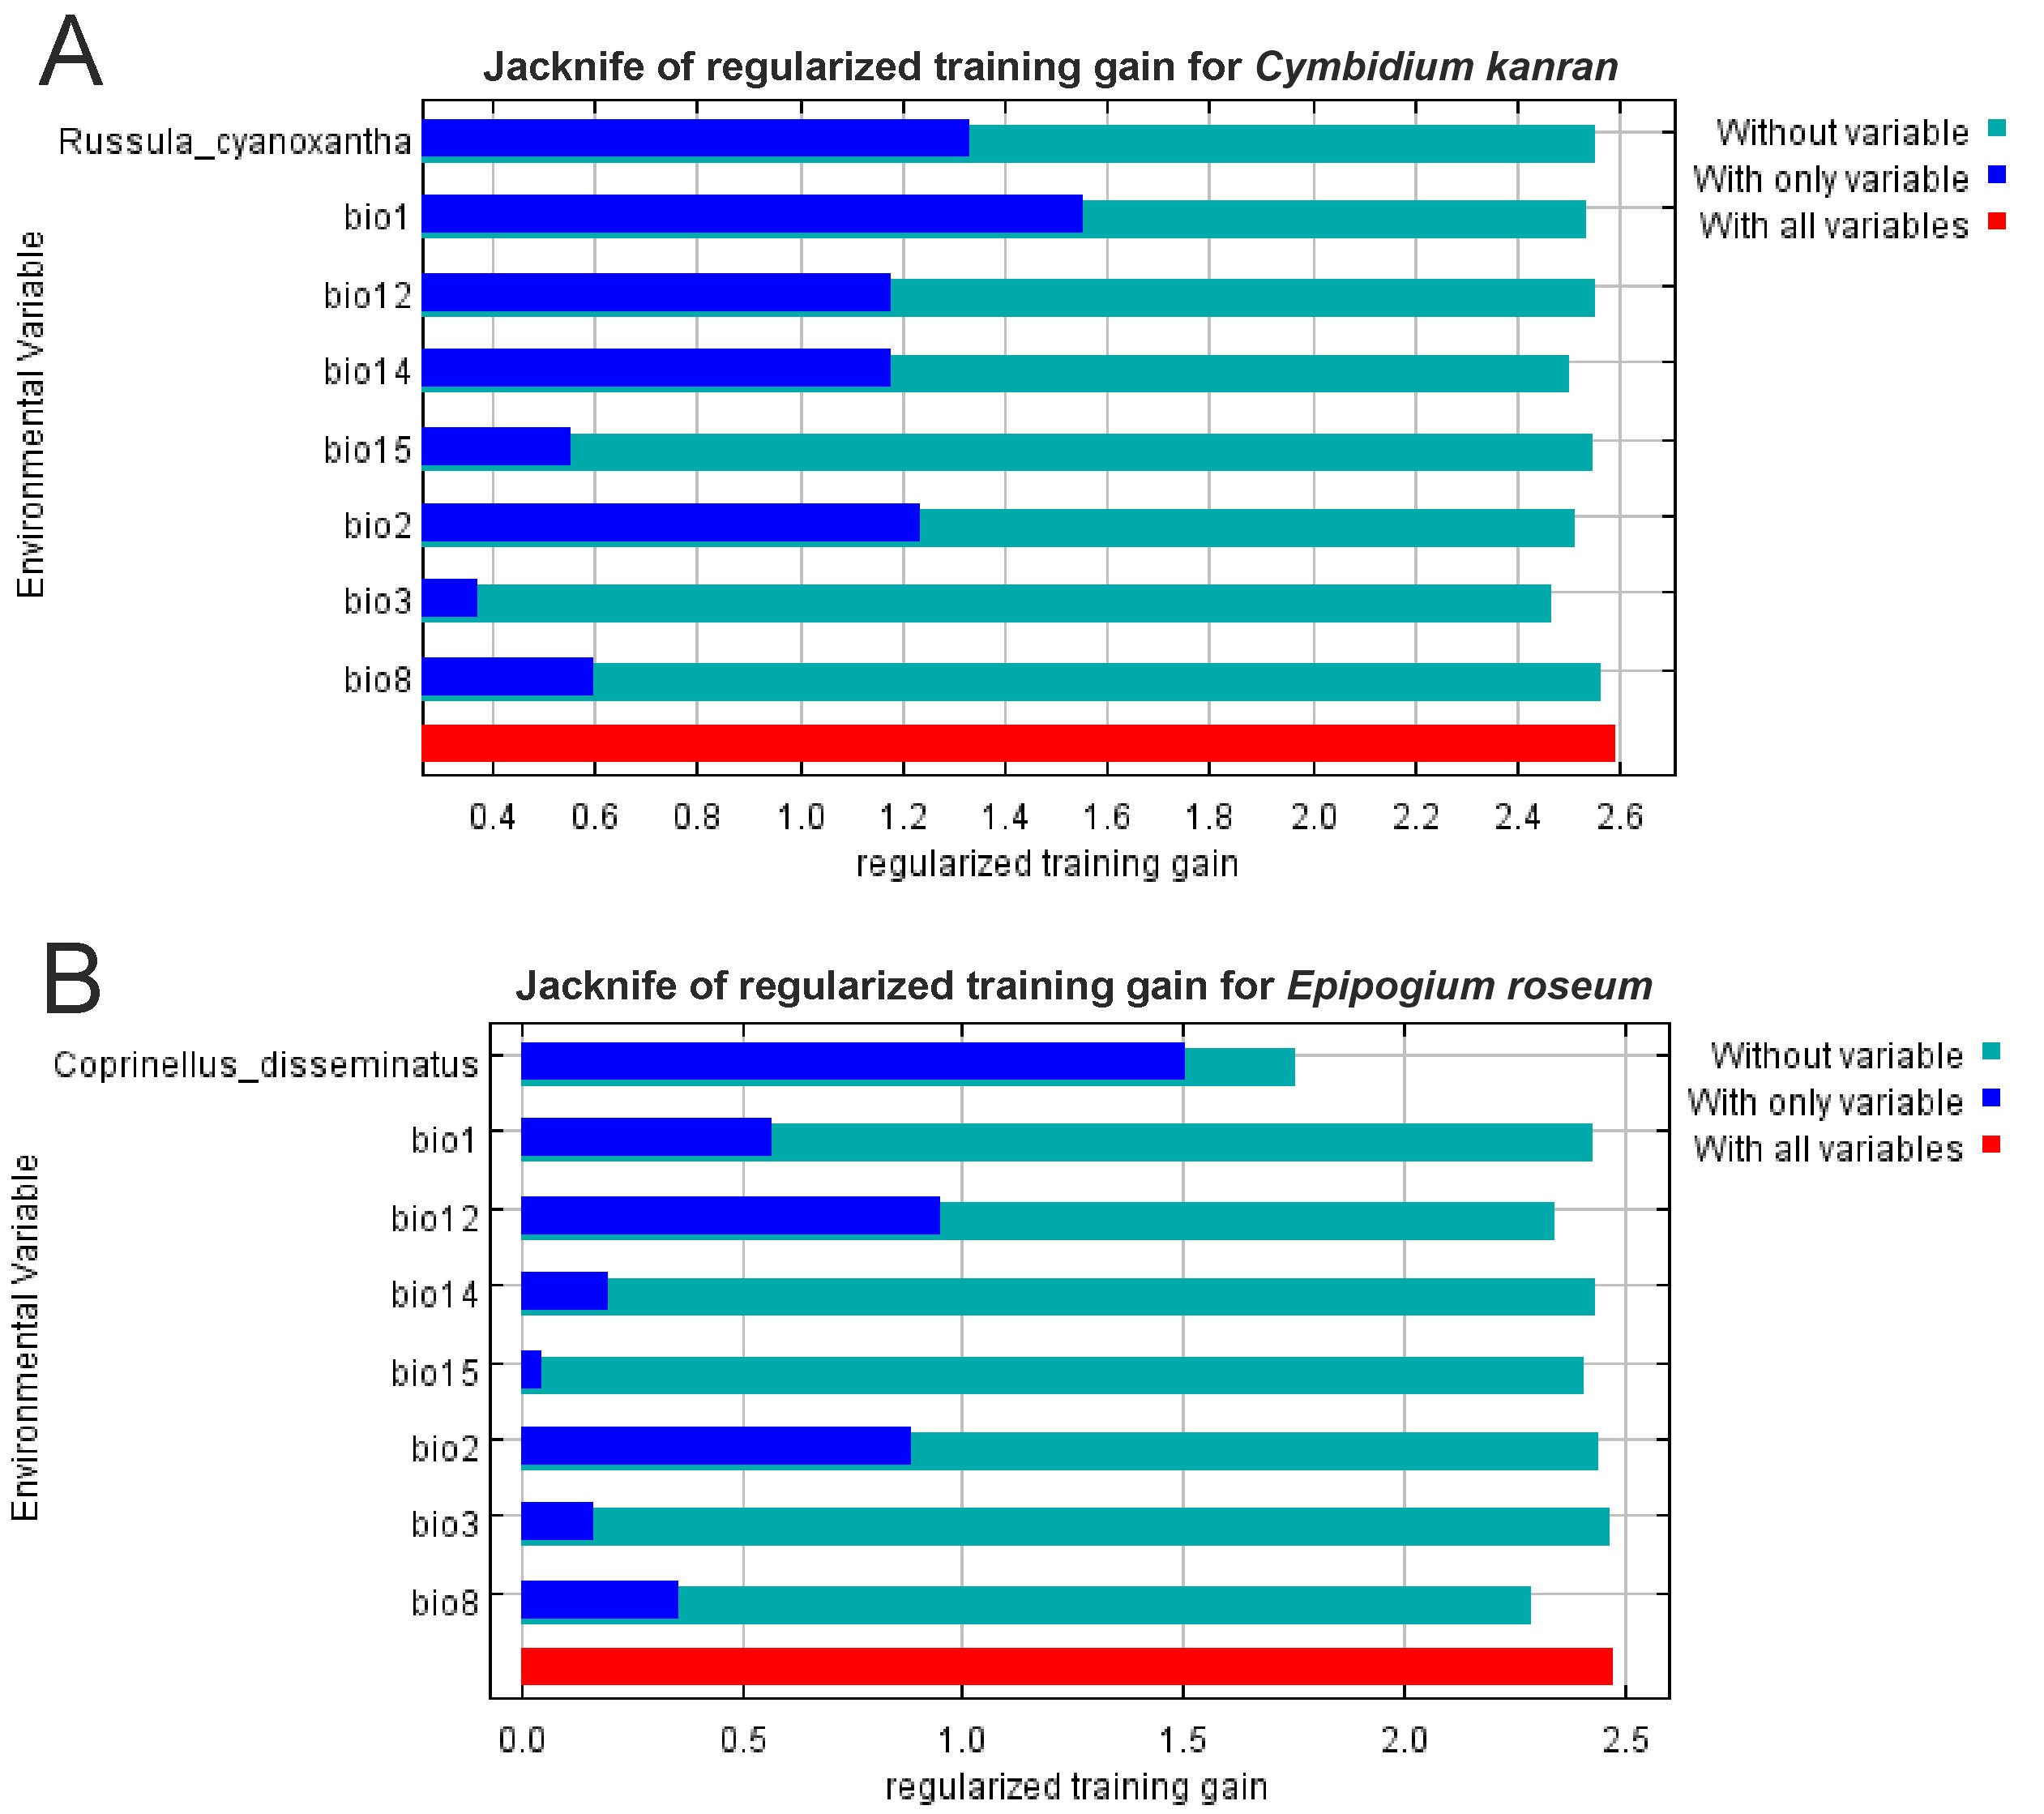
Models of the potential distribution of R. cyanoxantha and C. disseminatus based only on climatic data indicate that the occurrence of both fungi is limited mostly by the precipitation in the driest month (bio14). Other important variables affecting the distribution of R. cyanoxantha are the annual precipitation (bio12) and the isothermality (bio3), whereas the presence of C. disseminatus is influenced by the isothermality (bio3) and the mean diurnal range (bio2).
. Effect of global warming on the species studied
Predicted climate changes will be beneficial for R. cyanoxantha (Figure S1, Table 2). The potential range of this fungus will be 27–265% larger than currently. On the other hand, C. disseminatus will lose 16–41% of the currently available niches (Figure S1, Table 2).
Table 2
Changes in the coverage of suitable niches of the species studied under various climate change scenarios.
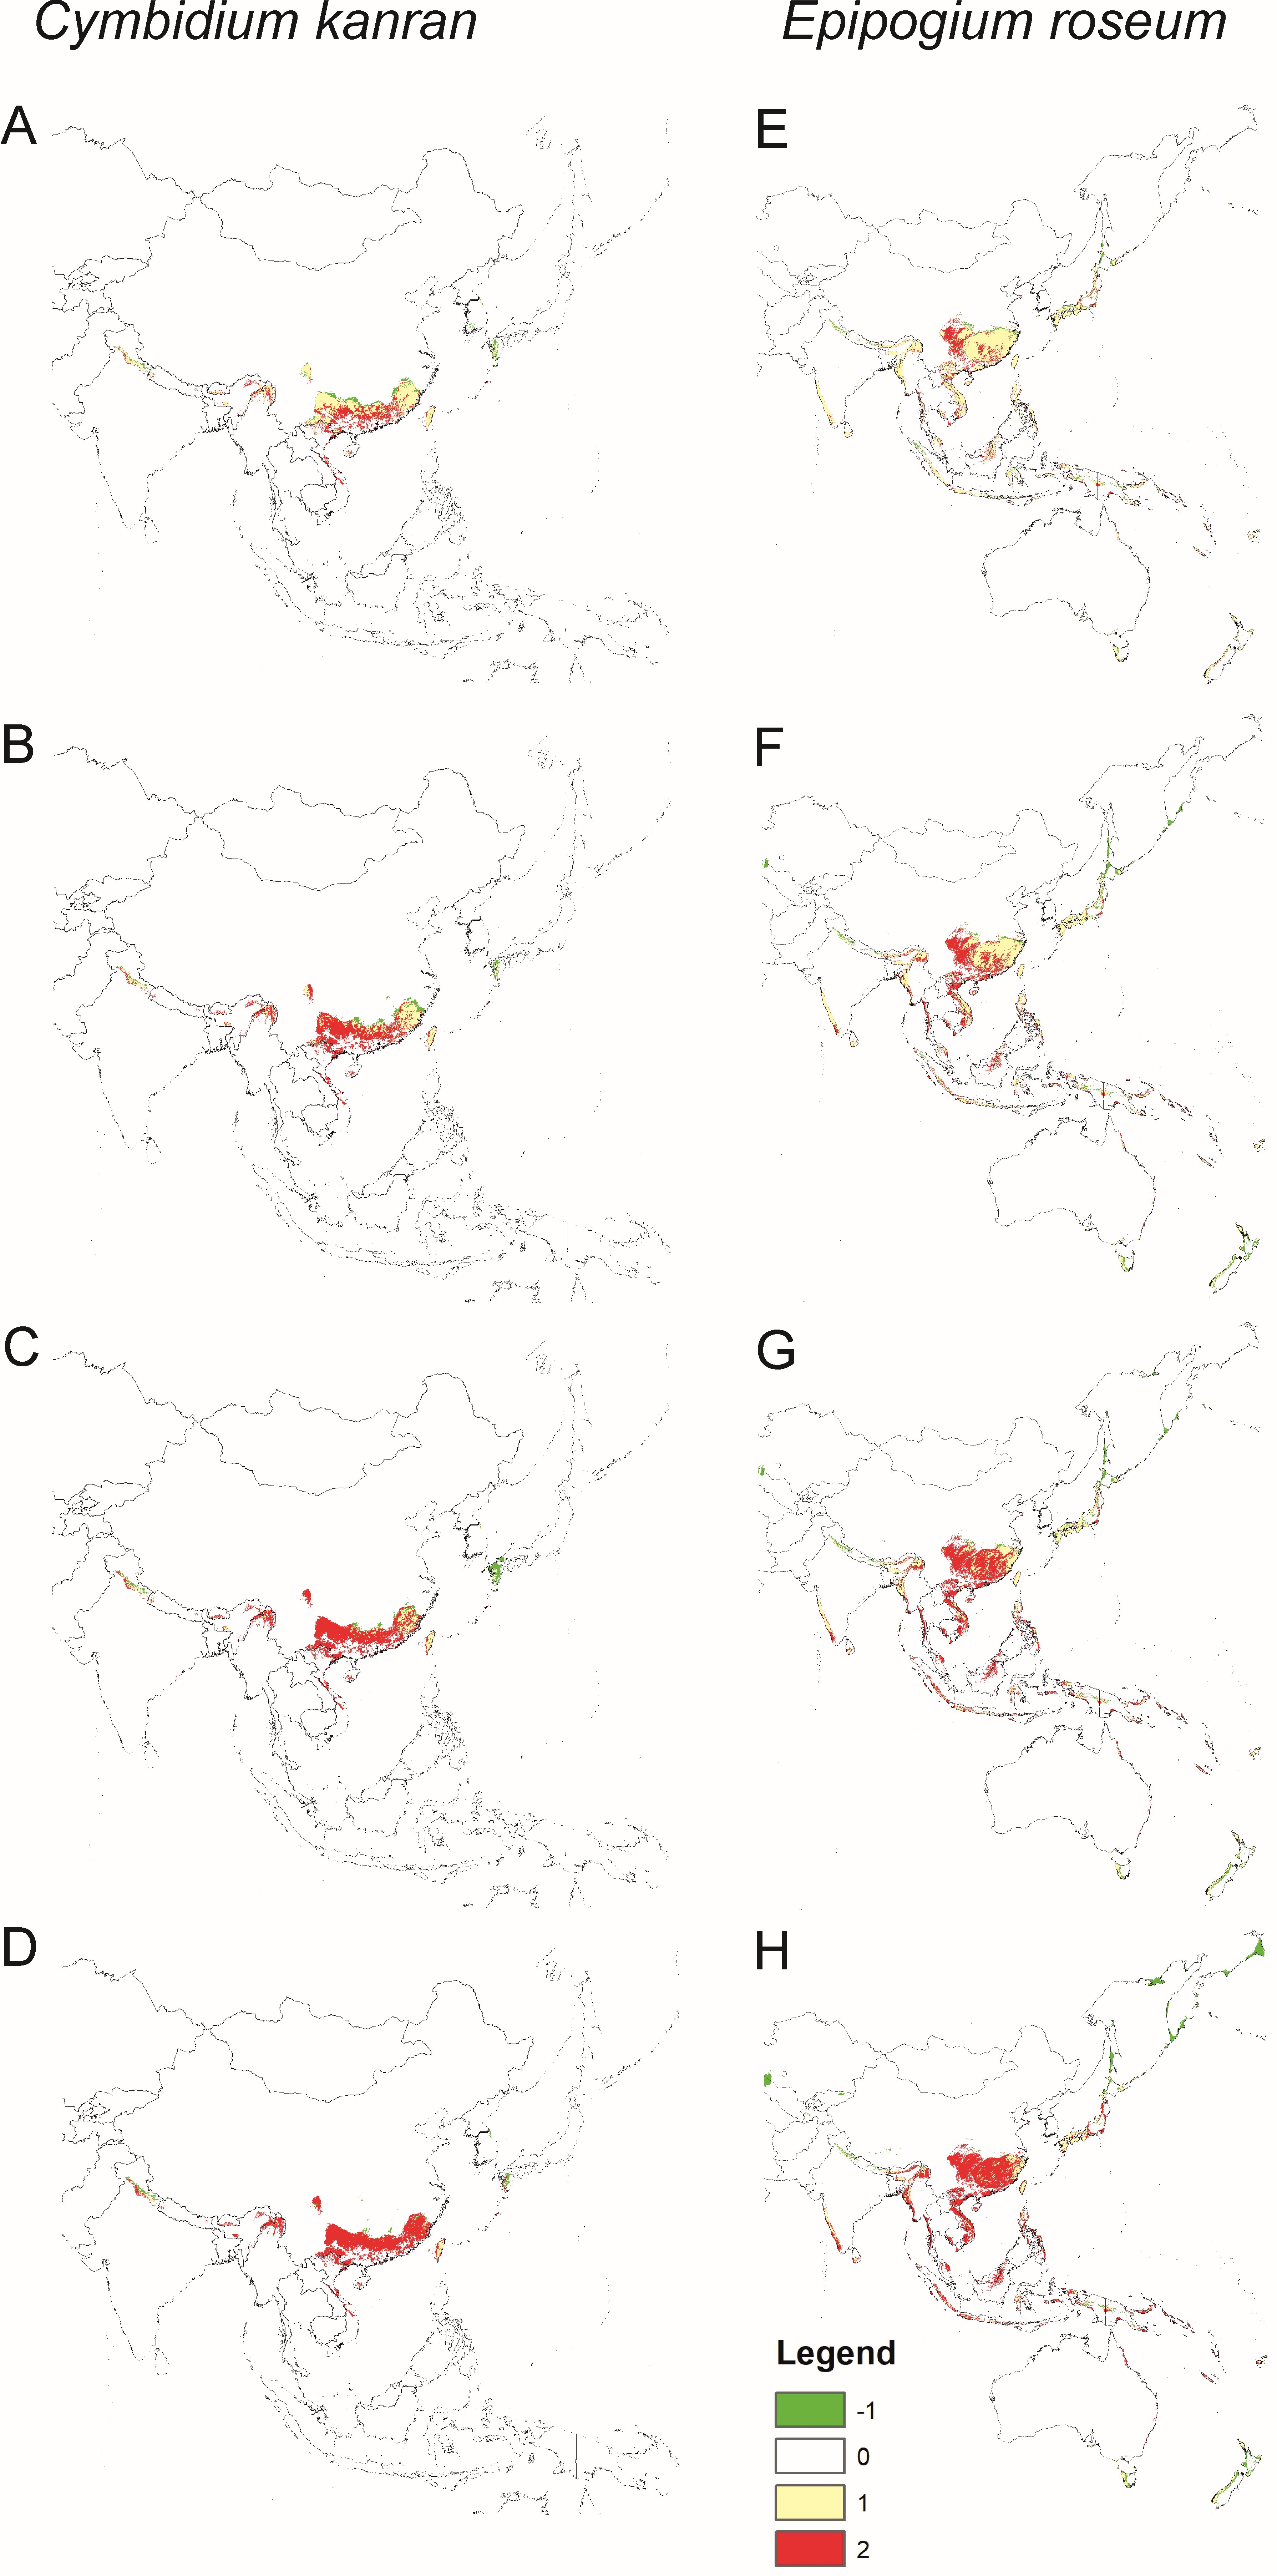
Models of the future distribution of suitable niches for orchids based only on bioclims indicate that for both species, there will be a significant loss of habitat. C. kanran will lose 31–88% of currently suitable niches and the potential range of E. roseum will be 18–66% smaller than currently (Figure 4, Table 2).
Figure 4
Changes in the distribution of suitable niches for the orchids C. kanran (A–D) and E. roseum (E–H) under various climate change scenarios - SSP1-2.6 (A,E), SSP2-4.5 (B,F), SSP3-7.0 (C,G) and SSP5-8.5 (D,H). Models based only on bioclimatic data. Legend: 1 – range expansion, 0 – no occurrence, 1 – no range change, 2 – range contraction.
Apparently, the presence of symbiotic fungi can slightly compensate for the predicted unfavorable climatic conditions for orchids. The models that include bioclimatic data together with the distribution of fungi for both C. kanran and E. roseum predict they will suffer habitat loss but to a smaller extent than the models based only on climate data. C. kanran will lose 25–87% of its habitats, and the range of E. roseum will be 25–48% smaller than currently (Figure 5, Table 2).
Figure 5
Changes in the distribution of suitable niches for orchids C. kanran (A–D) and E. roseum (E–H) under various climate change scenarios - SSP1-2.6 (A,E), SSP2-4.5 (B,F), SSP3-7.0 (C,G) and SSP5-8.5 (D,H). Models based on bioclimatic and fungal data. Legend: 1 – range expansion, 0 – no occurrence, 1 – no range change, 2 – range contraction.
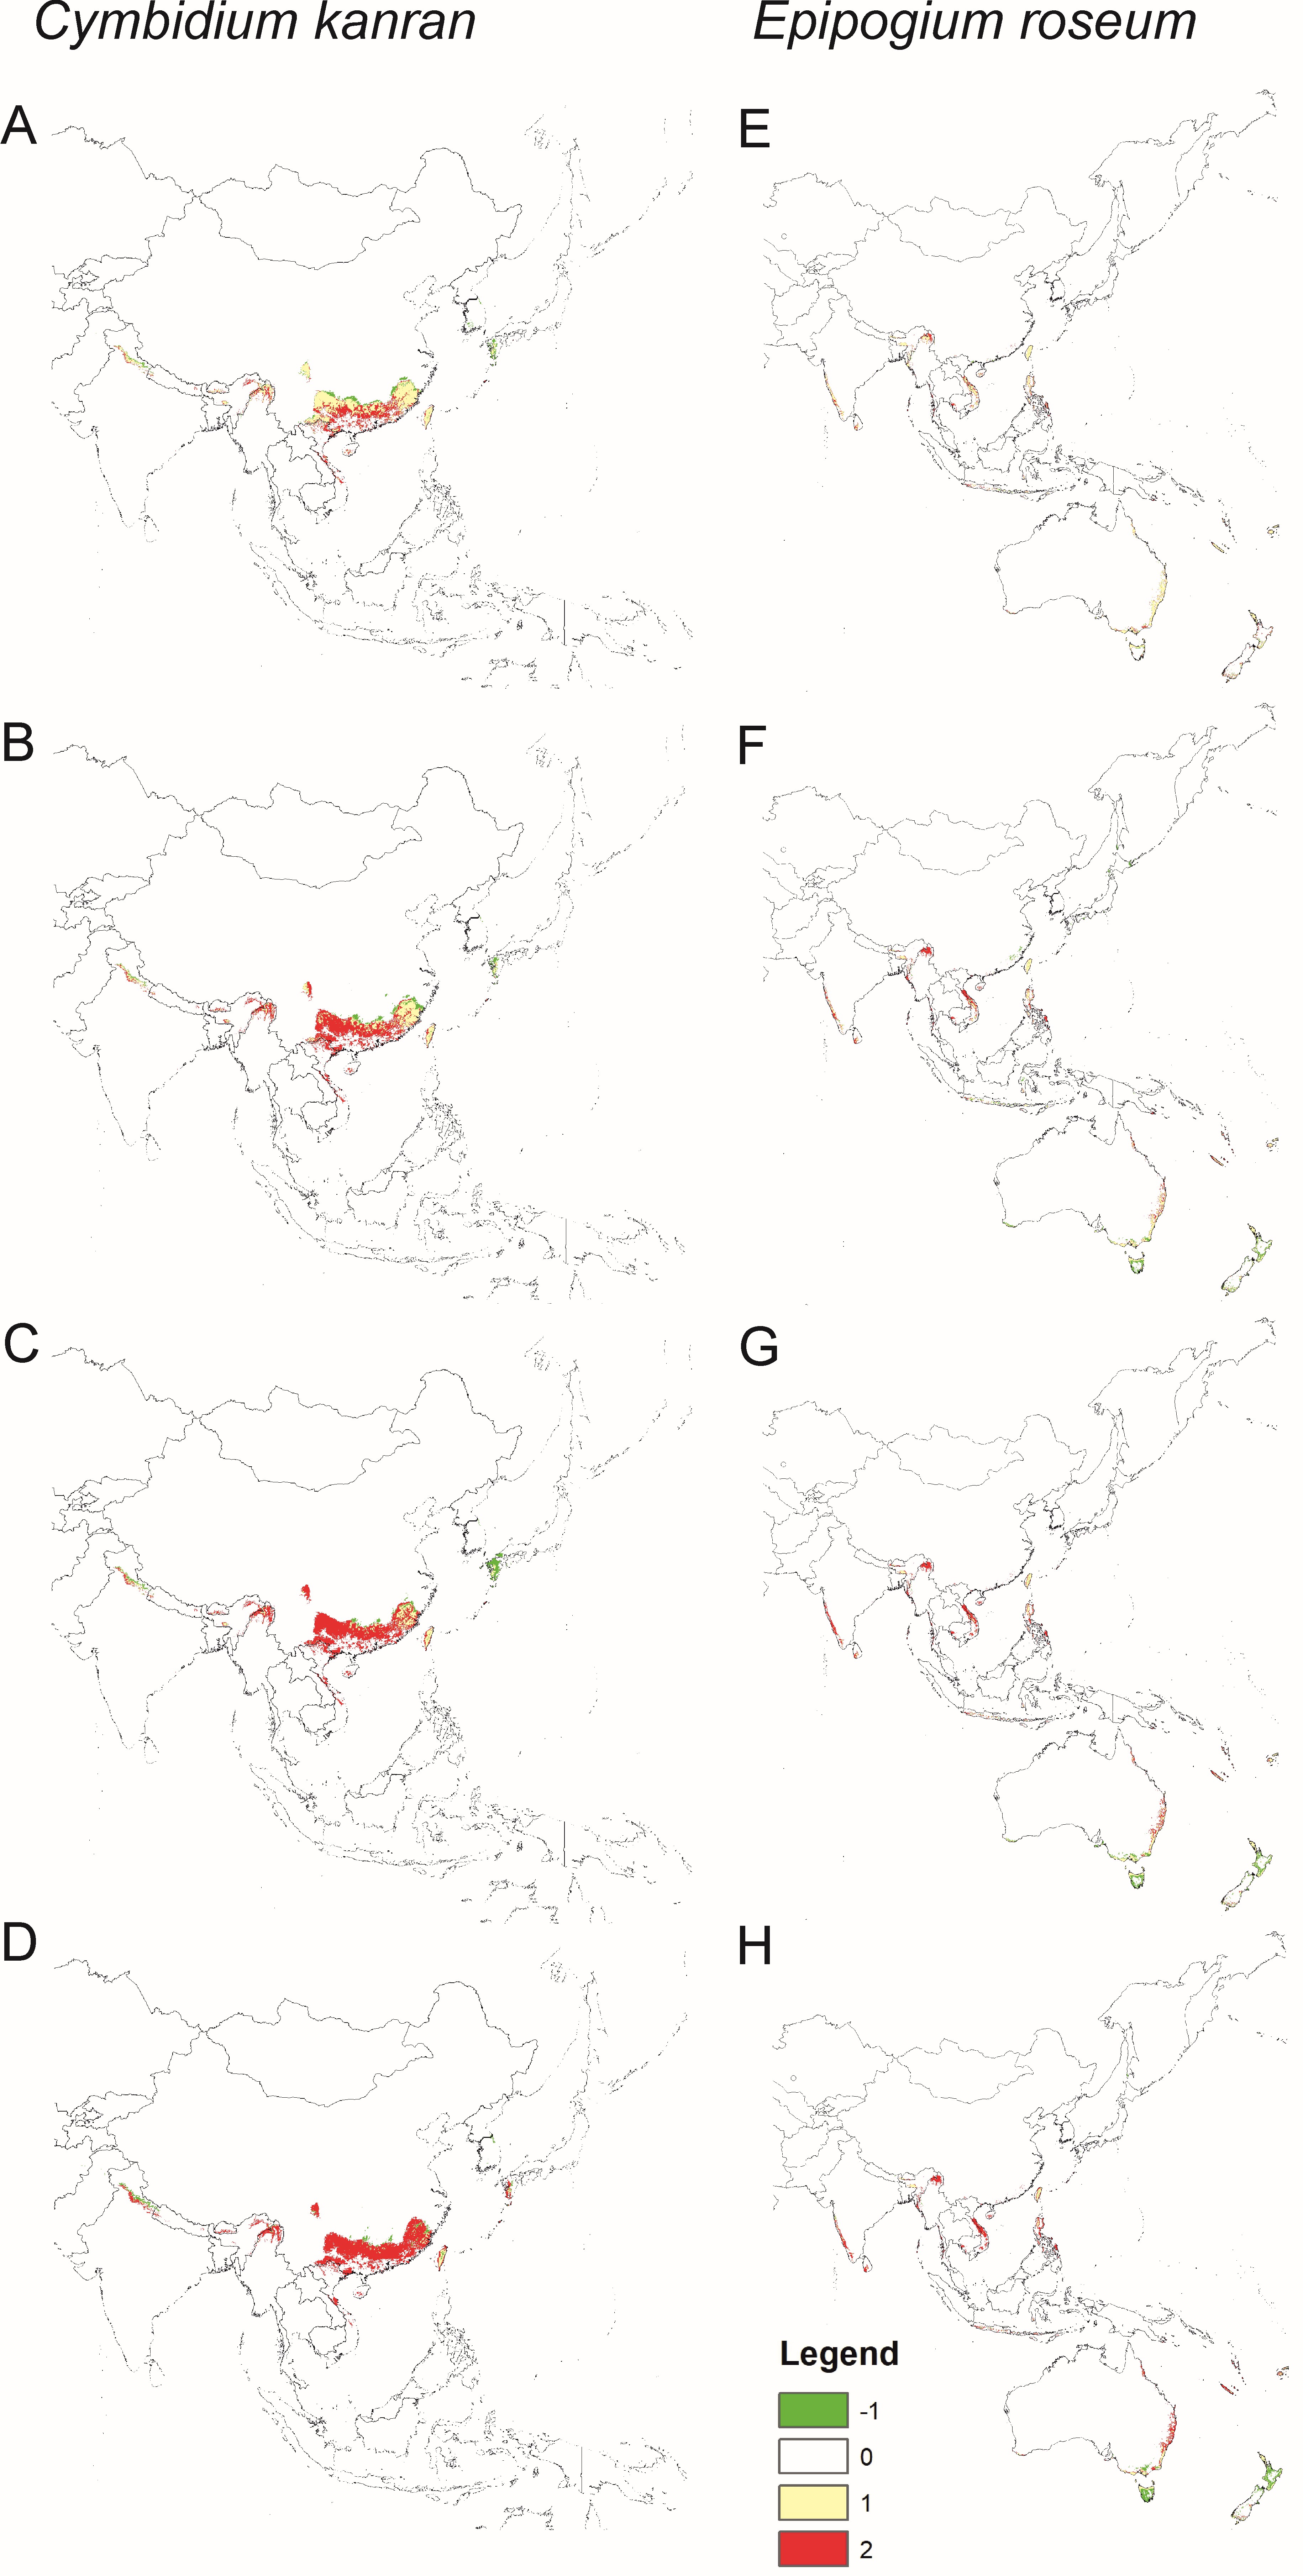
Generally, for C. kanran there was a north and north-eastern change in its geographical range. This species will lose niches in the southern part of its range. The same changes in range will occur in the northern part of the range of E. roseum, but the opposite is expected to occur in the southern hemisphere where this species will lose habitats in the northern part of the range and gain habitats in the south and south-east.
Comparison of the coverage and distribution of suitable niches calculated using MaxEnt and different sets of data (bioclims only vs bioclims + fungi) produced interesting results (Figure S2, Table 3). For both orchids, the inclusion of symbiotic fungi as a variable in the model significantly altered the predictions. Models for C. kanran using both bioclimatic and fungal data predicted a significantly larger extent of suitable niches under SSP1-2.6 and SSP5-8.5 climate change scenarios. On the other hand, the estimated potential range of this species in the SSP2-4.5 and SSP3-7.0 projections was greater in models based only on climatic data. In the case of E. roseum, which is a mycoheterotrophic species, models based on bioclims overestimated its range, and the addition of the distribution of the symbiotic fungus as a variable significantly reduced its predicted range (20–33%). At the same time, the general pattern of changes in the distribution of suitable niches for both orchids was similarly predicted by both ENM models.
Table 3
Differences in the coverage of suitable niches [km2] of the orchids studied predicted by models based only on bioclims and on both climate and fungal data.
. Discussion
. Importance of fungal factor in modeling orchid distribution
Undoubtedly, climate is the main factor shaping species’ geographical ranges. However, the occurrence of a particular organism depends on interactions between abiotic and biotic factors in the environment (Westgate et al., 2014). Unsurprisingly, models created in this study based exclusively on climate data significantly overestimated the future range of the fully fungus-dependent orchid (E. roseum). The merging of climate- and fungus-related data results in a reduction in the potential geographical range of this species by 66–78% compared to a simple climate-based model. Noteworthy, in the case of the less fungal-dependent (mixotrophic) orchid (C. kanran) the predictions of the models are not similar for all the climate change scenarios. It is hypothesized that the presence of symbiotic fungi can compensate for unfavorable climatic conditions, a situation predicted for two out of four scenarios (SSP1-2.6 and SSP5-8.5).
Considering the current biodiversity crisis, identification of the vital ecological factors affecting species distribution is crucial for predicting their responses to changes in global climate (Bateman et al., 2012; Brodie et al., 2012; Gårdmark & Huss, 2020; Guo et al., 2013; Romo et al., 2014). Specific symbioses are known to enable plants to adapt and survive in unsuitable habitats (Pérez-Alonso et al., 2020). One of the best examples is Serendipita indica (Agaricomycetes, Basidiomycota) a widespread fungus forming mycorrhizal symbiosis with orchids and other plants that promotes plant growth and performance, especially those growing in stressful conditions (Jogawat et al., 2013). This potentially advantageous aspect of orchid symbiosis is poorly studied (Xi et al., 2020). As indicated in this study, the inclusion of ecological factors, e.g., the availability of symbiotic fungi, increased the reliability of the predictions of distribution models.
Symbiosis limits the modeling of the distribution of species. A multipartite symbiotic system consisting of an orchid and numerous root-associated fungi is standard in many studies (Selosse et al., 2021). Both of the orchids considered are simultaneously associated with more than one mycorrhizal fungus: the spectrum is broad in the case of C. kanran (11 fungal families confirmed (Hong et al., 2015)) while for E. roseum 13 isolates of only saprotrophic species (Coprinus and Psathyrella) are reported (Yagame et al., 2008a). The presence of multi-species associations that include orchid- and fungi-associated bacteria indicates complex relationships and reciprocal effects (Kaur & Sharma, 2021). Moreover, the fungal associates of the orchids studied differed in their trophic mode (ectomycorrhizal vs saprotrophic), which influences their distribution and reaction to climate change. According to the global analysis of Sato et al. (2012), saprotrophic fungi are less constrained by climatic conditions than mycorrhiza-forming species, which could result in a much wider distribution for the symbiont of E. roseum.
. Uncertainty of climate models and possibility of niche shift
Clearly, this study has some constraints originating from the methods of modeling. While niche modelling techniques are currently broadly used for predicting changes in the distribution of rare or invasive species, it is not possible to precisely forecast the future climatic conditions in a specific area. More than 30 GCMs are proposed within the Coupled Model Intercomparison Project Phase 5 (CMIP5) (Fajardo et al., 2020; Flato et al., 2013). According to The Intergovernmental Panel on Climate Change website, even the selection of all the available GCMs and analysis of all projections of future climate would not guarantee a representative range, due to uncertainties that models do not fully deal with, especially the range in estimates of upcoming atmospheric structure. For this reason, models of the potential distribution of orchids presented in this study can be not 100% precise, but they are the best estimates of the future distribution of their suitable niches based on the current knowledge of their biology and ecology.
While this study indicates that both orchids studied are characterized by a narrow bioclimatic tolerance (Figure S3), it cannot be excluded that niche shift will occur as a response to unfavorable climate facilitated by a change of fungal partner(s). Changes in niches were already recorded for orchids colonizing new geographic regions (Konowalik & Kolanowska, 2018).
. Importance of identification, distributional data, and taxonomy of fungi
Our analyses included a single fungal species (Russula cyanoxantha, Coprinus disseminatus) per orchid species (Cymbidium kanran, Epipogium roseum), due to the lack of data on the distribution of fungi symbiotic to many other taxa. Such limitations are also highlighted in a similar modeling of the occurrence of plant-pathogenic (fungi (Batista et al., 2023). On the other hand, in the case of both fungi (R. cyanoxantha, C. disseminatus), the data on distribution in GBIF is based on human observations with a low percentage of occurrences supported by a preserved specimen or another sample (90% vs 10%, and 75% vs 25%, respectively). Among the data providers of human observations are citizen-science databases (e.g. iNaturalist, Observation.org), and presumably, the observations are exclusively based on the occurrence of fruitbodies, which narrows the information spectrum.
While studies on orchid mycorrhizae have been conducted for decades (Dorr & Kollmann, 1969; Narayanaswami, 1950; Rasmussen, 2002; Taylor & Bruns, 1997), many fungal species isolated from roots of various species remain poorly recognized (Bayman et al., 1997; Chen et al., 2011; Favre-Godal et al., 2020). Unfortunately, fungi isolated from orchid tissues are often not identified at the species level, and only the ITS-DNA-based operational taxonomic units (OTUs) are used in many analyses of orchid-fungus symbioses (Fernández Di Pardo et al., 2015). In the case of fungi, the main limitation and challenge to constructing a species distribution model is the uncertainty over identification and taxonomy that can mask actual occurrences and result in incorrect predictions (Fernández-López et al., 2021; Hao et al., 2020). Taxonomic problems are well-exemplified by Coprinus disseminatus,which is referred to as a complex of cryptic species by some authors (Yagame et al., 2008b). Although fungal identification, both morphological and molecular, is still a challenging task (Lücking et al., 2020), the inability to identify many species of fungi greatly reduces the possibility of conducting extensive studies on the ecology and biogeography of orchids and their symbionts. The insufficient data on symbiotic fungi (properly identified to the species level) also constrain the development of ENM studies on this group of organisms, which could be applied in biogeographical and ecological research. Moreover, the fungal ecological niche concept itself is still under debate (Kivlin et al., 2011), and some authors emphasize the dual nature of the symbionts’ niche, which is characterized by both host traits and the external environment (Mestre et al., 2020).
. Pollination uncertainty
The other ecological factor that should be considered when the long-term stability of plant species is considered is the availability of pollen vectors (Ramos-Jiliberto et al., 2020). While E. roseum is an autonomous species (Zhou et al., 2012), Cymbidium kanran is reported to be pollinated in Japan by Apis cerana ssp. japonica. The insect pollen vector of this orchid outside Japan, however, is uncertain in areas where this honeybee does not occur. Also, the future overlap of the geographical ranges of C. kanranand its pollinator(s) does not guarantee pollination success because some studies indicate the possibility of phenological desynchronization between insects and flowering plants due to climate change (Schenk et al., 2018).
. Effect of global warming on orchids and their fungal partners
As evaluated in our analyses, both orchid species will face significant habitat loss. While fungi studied are broadly distributed in the Americas, Europe, and Asia, their response to climate change will differ. Potential range contraction (16–41%) is predicted for C. disseminatus. On the other hand, climate change will be beneficial for R. cyanoxantha, which will expand its current potential range by 27–265% depending on the climate change scenario. The wide range of possible range expansion is not surprising considering a very broad range of possible CO2 emissions in various SSP baselines (21.8–126.1 Gt CO2), resulting in different warming in 2100. The sustainable SSP1 scenario forecasts 3–3.5 °C warming by 2100, while in the high-growth energy-intensive SSP5 warming of 4.7–5.1 °C is predicted (O’Neill et al., 2017). Based on the created PNO profiles (Figure S4), the climatic tolerance of both fungi species is similar. However, R. cyanoxantha is characterized by a broader tolerance for precipitation seasonality (bio15) and prefers lower values of the mean diurnal temperature range (bio2). The most striking difference between the two fungi is that R. cyanoxanthacan grow even in very dry conditions (bio14). Noteworthy, contemporary studies suggest that mycorrhizal fungal ranges are determined by plant host distributions or environmental tolerance rather than dispersal limitations (Kivlin, 2020).
. Conservation implications
Considering orchid conservation, according to our analyses both studied species will face significant habitat loss due to climate change. While only a reduction in global collective emissions can decrease the extent of the predicted changes in climate, it is important to concentrate future conservation activities in areas that will be suitable for the occurrence of the orchids studied and their fungal partners. The localization of climatic refugia is crucial for establishing conservation areas that will remain suitable for protected species occurrence for a long time, regardless of climate change. The direct protection of orchid habitats in situ should be complemented by establishing a network of seed banks (Seaton, 2007) and by ex situ cultivation of endangered plants in botanical gardens (Seaton et al., 2010). There is a need to understand the symbioses of orchids with diverse ecological and taxonomic groups of fungi, as well as the spatial distribution of the fungi and their ecology. An holistic approach involving multipartite relationships of orchids and other organisms, including fungi, pollinators, and highly neglected bacterial symbionts (both plant- and fungi-associated (Kaur & Sharma, 2021)) is necessary for improving their conservation.
. Conclusion
Orchids and fungi have a complex symbiotic association, and all orchids require mycorrhizal fungi for germination and, in the case of many species, also for their further proper functioning. In this study, the ENM method was used to evaluate the importance of fungal symbionts for two orchid species occurrences. It was proved that the distribution of both mixotrophic and mycoheterotrophic species is shaped not only by climatic conditions but also by the availability of symbiotic fungi. The predicted climate change will result in the contraction of the geographical ranges of orchids studied. However, models created for C. kanran using both bioclimatic and fungal data predicted a significantly larger extent of suitable niches under SSP1-2.6 and SSP5-8.5 climate change scenarios than in climate-only based models. In the case of E. roseum, which is a mycoheterotrophic species, models based exclusively on climatic datasets overestimated its range and the addition of the distribution of the symbiotic fungus as a variable significantly reduced its predicted range (20–33%). At the same time, the general pattern of changes in the distribution of suitable niches for both orchids was similarly predicted by both ENM models.
. Supplementary material
The following supplementary material is available for this article:
Table S1. GBIF datasets of the localities of the species studied (incl. synonyms) and final number of records used in ENM analyses.
Table S2. Records of orchids and their symbionts used in the ENM analyses.
Table S3. Pearson’s correlation coefficient computed for 19 bioclimatic variables.
Table S4. Results of the AUC and TSS tests and values of Max Kappa for all models (SD = standard deviation).
Figure S1. Changes in the distribution of suitable niches for orchid symbiotic fungi R. cyanoxantha (A–D) and C. disseminatus (E–H) under various climate change scenarios: SSP1-2.6 (A, E), SSP2-4.5 (B, F), SSP3-7.0 (C, G) and SSP5-8.5 (D, H). Legend: 1 – range expansion, 0 – no occurrence, 1 – no range change, 2 – range contraction.
Figure S2. Differences in predictions of models of the distribution of suitable niches for C. kanran (A–E) and E. roseum (F–J) when fungal data are added to climate data. SSP1-2.6 (A, F), SSP2-4.5 (B, G), SSP3-7.0 (C, H), and SSP5-8.5 (D, I), present time (E–J). Legend: 1 – range expansion, 0 – no occurrence, 1 – no range change, 2 – range contraction.
Figure S3. Predicted niche occupancy (PNO) profiles for the orchids studied.
Figure S4. Predicted niche occupancy (PNO) profiles for the fungi studied.
