. Introduction
The Scotch (common) broom Cytisus scoparius (L.) Link is a sub-Atlantic shrub species native and common in both western and central Europe (Tutin et al., 1968). It is also scattered throughout Poland, with the range that has probably changed over the last hundred years as a result of human activity (Mirek et al., 2020; Zieliński, 1975). Moreover, it was planted as an ornamental plant and to enrich habitats. It accidentally escapes from cultivation sites and grows wild. In Europe, it can be found within its natural range but is considered invasive in India, the United States, Australia, Argentina, Brazil and Chile (Holm et al., 1979; Rojas-Sandoval, 2022). The factors limiting broom occurrence are low temperature (Peterson & Prasad, 1998; Winde et al., 2020) and high soil pH (Dougherty & Reichard, 2004). The broom is sensitive to severe frosts, which may cause the death of aboveground shoots. The broom flowers on last year’s stems. Therefore, after a harsh winter, it does not bear fruits and seeds (Seneta et al., 2021). The Scotch broom is a shrub reaching a height of 1.5 to 2.0 m, but there are specimens reaching even 4.0 m (Parker, 1997). Its stems are angular, raised upwards, with a twig-shaped habit, dark green for most of the year. They dry and turn black in winter (Seneta et al., 2021). The leaves are small, single, or absent in the upper part of the stem and tripartite in the lower part (Seneta et al., 2021). The leaves are xeromorphic and appear on the stems only in spring (Norverto et al., 1994). In summer, the assimilation function is taken over by green stems (Bossard & Rejmanek, 1992).
The flowers, with zygomorphic symmetry, have a structure characteristic of legumes. Intensely yellow flower petals are differentiated into a banner standing upwards and the largest element of the perianth, as well as two free wings and a keel formed by the fusion of two elements of the corolla (Seneta et al., 2021). Each flower has 10 stamens and one pistil.
The broom belongs to species with an explosive mechanism of pollen release (Galloni et al., 2007; Suzuki, 2003). The pollinator pressing on the wing-keel complex causes a small explosion of pollen, which creates a cloud of pollen that settles on the insect. Only insects of a certain size have the ability to activate the pollen-triggering mechanism. Large pollinators, such as bumblebee queens, are too big to fit on the flower, and small ones are too light to trigger the mechanism. The honey bee (Apis mellifera) is the right size to activate the mechanism (Suzuki, 2003). However, broom flowers are visited by insects of all sizes, even after opening (Stout, 2000), which increases the efficiency of foreign pollination and reduces self-pollination. The largest element of the perianth is the banner, which attracts insects. After opening the flowers, although they are nectarless, banners display nectar guides, which fool bees into attempting to probe for nectar (Stout, 2000). It was found that the size of the banner has a small but significant effect on the proportion of pollinated flowers (Bode & Tong, 2017). However, it is unknown whether similar relationships exist in the case of the other elements of the perianth - the wings and the keel.
Environmental factors can significantly modify the size of flowers, including plants from the Fabaceae family. The size of the corolla may be influenced by water availability, leaf damage (Frazee & Marquis, 1994), or altitude (Baonza & Malo, 1999). The size of flowers in insect-pollinated plants, especially those with an explosive pollen release mechanism, is crucial to the effectiveness of pollination because only insects of a specific size can trigger this mechanism (Stout, 2000). The size of generative organs, especially flowers in insect-pollinated plants, is less variable and more conservative due to adaptation to pollinators. Therefore, we assumed that pod size, seed number, and especially leaf size would be more sensitive to environmental factors and, therefore, more variable.
The broom is a plant that fixes atmospheric nitrogen with the help of symbiotic bacteria, so it is independent of its content in the soil. Therefore, we assumed that nitrogen content would be slightly variable both in leaves and shoots and could be a reference to morphological features. The broom shoots have the ability to conduct photosynthesis, so we can expect similar contents of this element in the leaves. There is no information on this subject in the literature so far, hence the inclusion of this aspect in our research.
The aim of the research was to investigate the inter-individual and inter-population variability of leaves and generative reproduction organs, i.e., flowers, fruits, and seeds, and to determine the factors determining this variability and the relationships between the examined traits at the population level. It was hypothesized that there is a significant influence of environmental factors on the morphometric features of leaves, flowers, fruits, and seeds. In addition, we formulated some detailed questions: Does the habitat type affect the nitrogen and carbon content of leaves and stems? Does the habitat type affect the size of flowers and their elements, as well as pods and seeds? Does the nitrogen content in leaves and stems correlate with flower size? Does the nitrogen content correlate with the size of the pods and the size and number of seeds? Does the size of the flowers affect the size of the pods, seeds, and the proportion of large, fully developed seeds to all seeds? Which element of the flower has the greatest influence on the size of the pods and the number and size of the seeds?
. Material and methods
. Study site
The research was carried out in western Poland, where 16 plots were established, covering populations of Scotch broom Cytisus scoparius (L.) Link occurring in forest areas managed by the State Forests (Table 1). Each population consisted of at least 30 individuals, and 15 flowering and fruiting individuals, each measuring at least 1.5 m, were used for the analyses. Research material from 12 sites (Lubuskie and Wielkopolskie voivodeships) was collected in May 2016 (flowers and leafy stems) and August 2016 (fruits), while from the remaining four sites (Dolnośląskie, Pomorskie and Zachodniopomorskie voivodeships) similarly in May and August 2017 year. Ellenberg indicator values (EIV) have been frequently used to estimate habitat variables from floristic data (Czarnecka & Chabudziński, 2014). Therefore, in order to indirectly determine the parameters of the environment in which the broom occurs, an analysis of the species composition of the basic plants found on the researched sites was carried out. Then, the dozen most numerous species (Appendix 1) were assigned EIV, such as light, soil pH, temperature, humidity, nitrogen content and soil salinity (Ellenberg et al., 2001), and average values of indicators for each site were calculated (Table 2). The averaged EIV for each plot was subjected to Ward grouping analysis and principal component analysis was performed. This allowed us to divide the given areas into two groups. The first group included sites with higher nitrogen content and more sun exposure (seven sites) and the second site with higher humidity and higher pH (nine sites in total). The division into two groups became the basis for testing the hypotheses regarding the influence of the environment on selected parameters of the morphology of flowers, fruits, seeds and leaves, as well as carbon and nitrogen leaf and stem contents.
Table 1
Location of study plots and their assignment to habitat types and average Ellenberg indicator values (light – L; temperature – T; soil humidity – F; soil pH – R; soil nitrogen – N; soil salinity – S).
Table 2
Mean of all corolla petals area (mm2), number of samples (N), standard deviation (SD), and coefficient of variability (CV) for all study sites (numbers according to Table 1) and habitat type (WN - warm, nitrogen-rich); (MA – moist, alkaline).
. Plant material
From each selected shrub, three adjacent flowers were collected from the top of the shoot, which were used to analyze the area of individual parts of the perianth and leafy stems used to study the area of leaves. Similarly, pods with seeds were harvested in late summer. Leaves and stems for chemical analyses of carbon and nitrogen content were collected from five bushes in each plot. Preparation of flowers for area measurements consisted in separating fresh flowers into individual elements, spreading them on flat paper, pressing, and drying at room temperature. Leaves and seed pods were similarly prepared for measurements. The material intended for chemical analyses (stems and leaves) after collecting was stored at −18 °C until the analysis.
Dried perianth elements, i.e., keels, wings, and banners, as well as leaflets, pods, and seeds, were scanned, and their areas were measured. A set consisting of a Plustek OpticSlim 2400+ scanner and ImageJ 1.48 image analysis software was used for this purpose. Chemical analyses of carbon and nitrogen content were performed in the Mineral Analysis Laboratory of the Institute of Dendrology of the Polish Academy of Sciences according to procedures described by Maderek et al. (2015). The material (leaves and stems) was dried at a temperature (65 °C, >48 h) and powdered in a Mikro-Feinmühle Culatti mill (IKA Labortechnik Staufen, Germany). The content of N and C was measured using an Elemental Combustion System CHNS-O 4010 analyzer (Costech Instruments, Italy/USA; https://costechanalytical.com). The content of elements is given as a percentage of dry matter (% DM).
. Statistical analysis
The nested ANOVA was used to statistically evaluate the results, where the habitat type and site nested in the habitat type were treated as fixed factors and the plant as a random factor. The normality of residual distribution and homogeneity of variances were checked using Shapiro-Wilk and Levene’s tests, respectively. Arcsine transformation was used for data expressed as a percentage. Pearson correlation analysis was used to assess whether the size of flowers affects pods and seeds. The analyses were performed using the JMP Pro 16.1.0 SAS Institute Inc., Cary, NC, 1989–2023 software.
. Results
. Flowers
The corolla of broom flowers has a structure typical of legume flowers and is differentiated into three elements: a banner, wings and a keel. The largest element is the banner. In the case of these studies, its average area was 214.8 mm2, but it is the least diverse element, as the coefficient of variation (CV) for all collected flowers is only 15.5. Significant differences between sites were also observed (Table 2); the average banner size ranged from 168.4 mm2 to 301.6 mm2, and the coefficient of variation for the area ranged from 0.783 to 20.73. The second largest element of the perianth is the total area of both wings. The average area is 183.8 mm2. The coefficient of variation is slightly higher than in the case of the banner, and it is 18.24. The smallest is the keel, with an average area of 179.2 mm2 and a coefficient of variation of 16.69. The size of the banner, wings, keel, and the total area of the corolla was most influenced by inter-individual variation. It determined over 80% of the variability (Table 3), study site and habitat type also had a significant impact. The exception is the area of the banner, which was not dependent on the habitat. In the warmer, sunnier, and nitrogen-rich habitats, the flowers were significantly smaller than in the alkaline habitats with higher humidity.
Table 3
Mean (standard deviation in parentheses) area of all corolla petals, banner, wings and keel of Cytisus scoparius flowers for two habitat types and ANOVA results.
. Pods and seeds
The greatest impact on the area of pods and seeds had, as in the case of flowers, individual variability (Table 4). The type of habitat had no significant effect on the size of the pod, but it differentiated the number of seeds. In the more moist and alkalized habitat, there were 5.4 seeds per pod on average, which was 0.2 more than in the warmer, nitrogen-rich site. In the case of large seeds, i.e., those that can be considered properly developed, the difference was greater. The seed number per pod on average was 4.5 and 5.2 for the warmer, nitrogen-rich habitat and the more moist, more alkaline habitat, respectively (Table 5).
Table 4
Mean pod and leaflet area (mm2), number of samples (N), seeds and large seeds number and mean area of one seed, standard deviation (SD) and coefficient of variability (CV) for all study sites (numbers according to Table 1) and habitat type (WN - warm, nitrogen-rich); (MA – moist, alkaline).
Table 5
Mean (standard deviation in parentheses) area of pods and leaflets, number of seeds and large seeds of Cytisus scoparius for two habitat types and ANOVA results.
. Leaves and stems
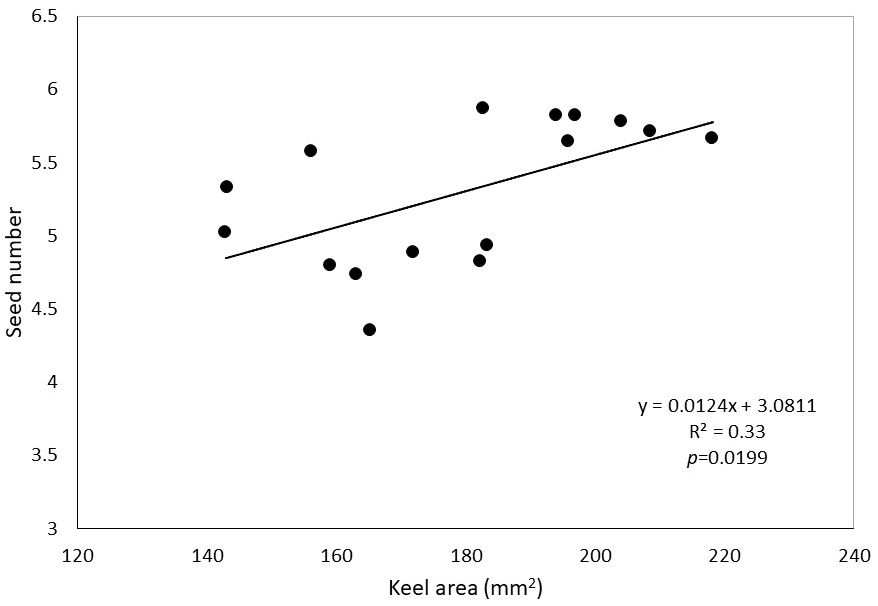
The area of broom leaflets is not very diverse - the coefficient of variation is only 5.2%. The size of the leaflets is also not differentiated by the habitat (Table 5). Inter-individual variability, as it is only 38%, has a smaller impact on the variability than in the case of the area of flower or pod elements. The same is true for the content of carbon and nitrogen - the variability of the content of both elements is small (Table 6). The nitrogen content in the leaves was almost twice as high as in the stems, but the type of habitat did not differentiate it, while in the case of stems in habitats considered to be warmer and richer in nitrogen, there was significantly more nitrogen. Both in the leaves and in the stems, the carbon content was similar - it was about 50%, and it was not differentiated by the habitat (Table 7). No significant correlations were found between nitrogen and carbon content and the morphology of flowers, fruits, seeds, and leaflets. The area of corolla petals is significantly correlated with each other (Table 8). In the case of the banner, keel, and total corolla areas, a significant correlation was also demonstrated for the leaflet area. The size of the flowers expressed by the area of the petals of the corolla was unrelated to the size of the pods and the number or size of the seeds. The exception was the positive correlation between the keel size and the number of seeds (Figure 1).
Table 6
Mean leaf and stem nitrogen (N%) and carbon (C%) content for all study sites (numbers according to Table 1) and habitat types (WN - warm, nitrogen-rich); (MA – moist, alkaline).
Table 7
Mean (standard deviation in parentheses) nitrogen (%) and carbon (%) content in leaves and stems of Cytisus scoparius for two habitat types and ANOVA results after arcsin transformation.
Table 8
Correlation coefficients between the average area of the corolla petals and leaflets of Cytisus scopariusand between the various plant parts. The results are presented for 16 samples for each element.
| Plant part | Banner | Wings | Keel | Total corolla | Leaflet |
|---|---|---|---|---|---|
| Banner | - | 0.67 | 0.76 | 0.89 | 0.73 |
| Wings | 0.67 | - | 0.84 | 0.91 | 0.48 |
| Keel | 0.76 | 0.84 | - | 0.94 | 0.64 |
| Total corolla | 0.89 | 0.91 | 0.94 | - | 0.67 |
| Leaflet | 0.73 | 0.48 | 0.64 | 0.67 | - |
. Discussion
The flowers of the broom have a structure typical of plants from the Fabaceae family. A single flower consists of one large banner, two wings, a keel covering the stamens, and a pistil. The size of individual perianth elements is a conservative feature and is characterized by little variation compared to the vegetative parts of plants (Endress, 2001). This is especially important in species pollinated by a distinct group of pollinators. In the case of our studies, the average value of the coefficient of variation (CV) for banners, wings, and keels was similar: 8.2, 12.7, and 10.9, respectively. However, in some populations, the variability of all perianth elements was high (CV even over 20%), and in others, it was very small (CV < 4%). Significant correlation of the coefficients of variation of individual perianth elements may indicate a significant environmental impact. Bode and Tong (2017) wrote about a similar relationship between urban and rural environments. They showed that banner size correlates with the number of flowers pollinated. In the case of the presented studies, the size of the banner, wings, and keel was little differentiated, although the differences were greater than in the case of studies conducted on the Iberian Peninsula by Herrera (2001). The area of individual corolla elements is correlated with each other, and a positive correlation with the area of the leaflets was also shown. This may indicate a significant influence of the habitat on the size of both flowers and leaves. This may be confirmed by significant differences between the selected habitats in the size of wings and keels (Table 3), which positively verifies the research hypothesis. The size of the keel is very important in the pollination process. The keel of an unpollinated flower surrounds the pistil and stamens, which are released only when a sufficiently sized pollinator lands on the mature flower (Stout, 2000). It can be concluded that the varied size of petals increases the number of species and the size range of insects involved in the pollination of broom flowers. Variation in flower size depending on environmental conditions expands the group of potential pollinators, which may help the broom to conquer new areas. The analysis of morphological features of flowers, fruits, and seeds in several dozen species of the Fabaceae family from the tribe Genisteae, performed in the Mediterranean area of Spain, showed a significant correlation between the size of flowers and the number of seeds (López et al., 2008). In these studies, the area of the keel, as the only element of the flower, was positively correlated with the number of seeds (Figure 1).
The broom is considered to be highly invasive plant in many areas (Herrera-Reddy et al., 2012). A feature conducive to invasiveness is the large number of seeds produced (Bossard & Rejmanek, 1994), and an additional factor is the autochorous way of seed dispersion. A significant number of broom seeds are thrown by bursting pods over 2 m from the mother plant and, in extreme cases, even over 7 m (Malo, 2004). The number of seeds in a pod is variable. Tylkowski (2016) says that there are usually 5–8. Bossard and Rejmanek (1994) report that the number of seeds can vary greatly from year to year, and their average number in a pod can be in the range of 2.4–8.1. Sheppard et al. (2002) also give the average number of seeds per pod as 7.9 and add that this number was not dependent on location, bush maturity, or browsing. In the case of the presented studies, the average number of seeds per pod was 5.3. If we consider only large, fully developed seeds, there were even fewer of them, with an average of 4.9. The number of seeds in a pod within a population is a relatively constant feature, as evidenced by the coefficient of variation at the level of several or over a dozen percent. Contrary to what Sheppard et al. (2002) say, the number of seeds is affected by habitat. In more moist and more alkaline habitats, the average number of seeds was higher (Table 5).
The broom’s invasiveness is certainly aided by its ability to fix atmospheric nitrogen, and this is of particular importance in nitrogen-poor habitats (Lafay & Burdon, 2006; Wang et al., 2022). The nitrogen content in the leaves of higher plants is, on average, about 2% (Reich & Oleksyn, 2004). In species in symbiosis with microorganisms that can fix atmospheric nitrogen, there is usually twice as much of it in the leaves. Lambert et al. (1989) found 3.9% nitrogen in broom leaves and 2.0% in green stems. In our study, the average nitrogen content was slightly higher in leaves and stems. The relatively high nitrogen content in the stems, twice as high as in the stems of many other shrubs (Garcia-Moya & McKell, 1970), is related to the fact that broom stems are evergreen and capable of photosynthesis even during drought periods (Bossard & Rejmanek, 1992).
. Conclusion
The conducted analyses allowed us to conclude that for the majority of traits, a greater part of the overall variability is explained by inter-individual rather than inter-population differences. In more moist habitats with a higher pH, the size of flowers, pods, seeds, and leaflets was larger, which is surprising because the broom is a species that requires a lower pH soil. The type of environment differentiated the nitrogen content only in the stems, and this is related to maintaining the possibility of photosynthesis in dry and warm habitats. Broom leaves have a relatively constant and high nitrogen content (>4% dry matter), and because they have a very short lifespan, they quickly enrich the soil environment with this element, which emphasizes the habitat-forming role of this species. Among the examined flower elements, the area of the wings and keel was dependent on the environment, which is probably related to the adaptation to the size of pollinators. The size of keels correlated positively with the size of seeds, which were significantly more numerous in more moist environments.
