Introduction
In the cold periods of Quaternary climatic fluctuations, many temperate species underwent severe contractions in distribution range, and their survival during these periods was associated with climatically more favorable regions, so-called glacial refugia, from which subsequent range expansions took place (Hewitt, 2004). These refugia played a crucial role in shaping the current genetic variation among present-day biota (Taberlet et al., 1998). In Europe, the role of the main southern peninsulas (Iberian, Apennine, and Balkan) as such refugia, as well as sources of genetic variation, is well established (Hewitt, 1996, 2004; Taberlet et al., 1998). A similar role for the eastern-most refugia (i.e., the Western Caucasus, Southern Urals, and Altai) as postglacial sources of European flora was postulated more than a century ago based on “florogenetic reconstructions” (Kamelin et al., 1999; Korzhinskiĭ, 1899). Nevertheless, there have been comparatively few studies that have assessed the role of these eastern regions in shaping the evolutionary history of European plants using modern approaches. Most of the studies that have been conducted have tended to focus on cold-resistant arboreal species (e.g., Palme et al., 2003; Pyhäjärvi et al., 2008; Tollefsrud et al., 2009; Volkova et al., 2020), although some studies have examined temperate species (e.g., Jia et al., 2012; Manafzadeh et al., 2014; Treier & Müller-Schärer, 2011). The findings of a majority of these studies support the general pattern of a westward postglacial migration of the studied plants. Paleobotanical data and past climate reconstructions have indicated the particular importance of the Ponto–Caspian region as a refugial area for temperate plant species with the main refugium, the Colchis region, located along the northeastern shores of the Black Sea (Tarkhnishvili et al., 2012). Colchis was recently proposed to be a “repository of unique genotypes and a refuge of unique tree species” (Grimm & Denk, 2014), although the potential importance of this refugium as an independent source of genetic variation had already been postulated (Hewitt, 2000; Taberlet et al., 1998). To date, however, we still lack continental-scale phylogeographic studies, including a sufficient number of both Caucasian and European samples, to establish the role of the Colchis region in shaping the modern flora of Europe.
Moreover, it seems probable that the southern and eastern refugia were not the only climatic refuges, as growing evidence supports the existence of “cryptic northern refugia,” wherein temperate plants could survive during glaciations at higher latitudes (Provan & Bennett, 2008; Stewart & Lister, 2001). These refugia may have been located at relatively high latitudes in Western and Central Europe (Magri et al., 2006; Michl et al., 2010; Valtueña et al., 2012) or Asia (Volkova et al., 2020), although their exact locations and borders have yet to be definitively established. For example, the Carpathians have been proposed as a refugium territory in the phylogeographic studies of certain species sampled at the European level (Daneck et al., 2011; Kramp et al., 2009; Mosolygó-Lukács et al., 2016; Slovák et al., 2012), although insufficient sampling in the Caucasus has thus far precluded a complete understanding of the relative roles of all refugia. To date, only the study conducted by Bartha et al. (2015) has compared the genetic variability of European and Caucasian populations, in which the authors uncovered a group of haplotypes of Erythronium dens-canis L. characteristic of the eastern Carpathian Basin that were nearly equidistant from the other two groups of haplotypes characterizing the Caucasian sister-species (Erythronium caucasicum Woronow) and samples from the remainder of the European area. These findings accordingly serve to highlight the role of the Carpathian region in the long-term isolation and survival of temperate mesophilous species in Europe.
Thus, the relative roles of the Southern (“main”), Northern (i.e., cryptic northern), and Eastern European (e.g., the Colchis) refugia in shaping the evolutionary history of European temperate plants should be evaluated. In the present study, we used Primula vulgaris Huds. (Primulaceae) as a model species to examine the different roles played by European refugia in shaping the phylogeographic history of temperate broad-leaved forest plants. This model species is suitable for our study purposes as it is distributed throughout Europe (Figure 1), and is a characteristic plant of broad-leaved (mostly Carpinus and Fagus) forest habitats or their clearings under the influence of a sub-Atlantic climate. Primula vulgaris is characterized by entomophilous pollination and myrmecochorous seed dispersal and has a transient seed bank (Jacquemyn et al., 2009), traits that tend to indicate the limited dispersal capabilities of this plant, which in turn are conducive to long-term preservation of the phylogeographic structure. Members of our group have previously revealed the high genetic diversity of P. vulgaris in the Colchis region and its spread from this refugium westwards to the Caucasus along the northern coast of the Black Sea (Volkova et al., 2013). However, the extent to which Caucasian P. vulgaris spread further in the past has yet to be conclusively established, given that our sampling in this study was limited to the Ponto-Caspian region.
In the current study, we sought to address the following questions: (i) Is there any evidence of glacial survival of the temperate herb Primula vulgaris in Northern and/or Southern European refugia? (ii) What was the role of the Eastern Colchis refugium in shaping the evolutionary history of P. vulgaris in Europe?
Material and Methods
Sampling of Plant Material
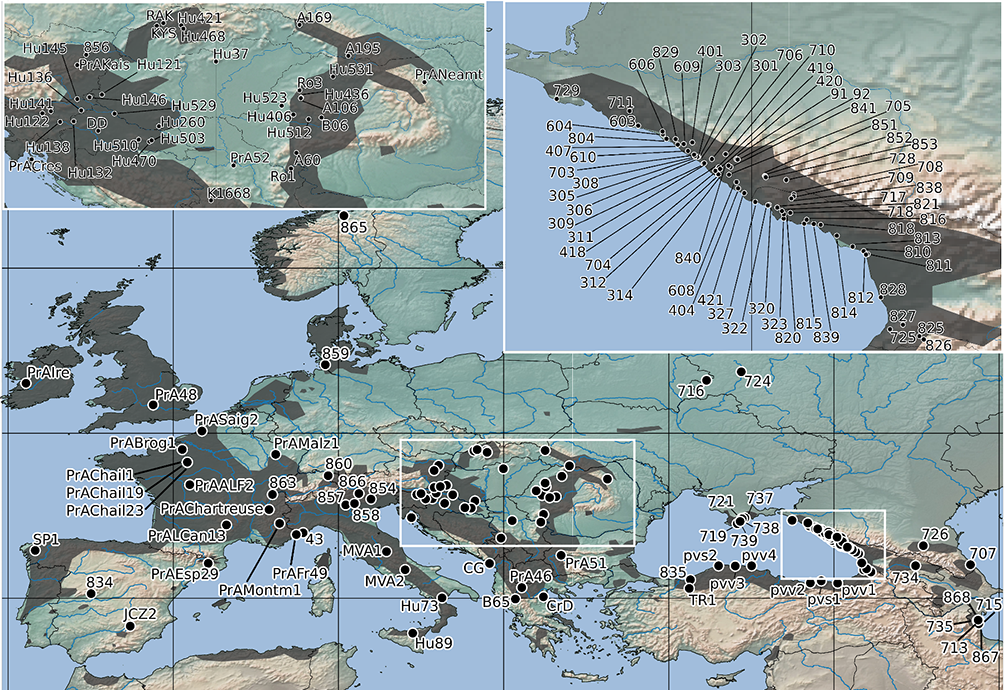
For the purposes of the present study, we augmented the samples of P. vulgaris previously collected from 57 populations distributed along the northeastern coast of the Black Sea and other parts of the Ponto-Caspian region and Central Russia (Volkova et al., 2013), with samples from a further 103 populations (160 in total), collected from across the entire European distribution of this species (Figure 1, Table S1). The additional sampling was conducted with a particular emphasis on the western part of Europe. We adopted a broad species concept to delimit P. vulgaris in a taxonomic sense, based on the findings of the more focused analyses by Volkova et al. (2013), who revealed that forms previously recognized as separate taxa should not be treated as such. The additional populations were sampled between 2005 and 2017 in the field. Our preliminary tests using populations representing three different parts of the distribution range [the northeastern coast of the Black Sea: Populations 703, 704, 705, 711, 707, 716 (see Volkova et al., 2013, Table 1), four specimens from Population 804, eight specimens from Population 829; three specimens from Western Hungary: Csöde (population code: Hu121); and three specimens from France: Chailland (population code: PrAChail)] revealed no intrapopulation variability in the selected DNA regions (Table S1). Given the highly limited intrapopulation variability of these DNA-regions in the studied populations, we followed the advice of Lowe et al. (2004) by sampling more populations at the expense of sampling more specimens per population, and reduced the sampling to one plant per population. Leaf samples collected from all plants were dried in silica gel or stored in ethanol at 4 °C prior to DNA extraction, and one plant per population was pressed as a voucher specimen. These voucher specimens have been deposited in the Herbarium of Moscow State University (MW; Seregin, 2020) and the Herbarium of Debrecen University (DE).
Figure 1
Geographical localities of the Primula vulgaris populations sampled in this study. The distribution range of P. vulgaris is indicated by gray shading on the map, which is drawn after Meusel et al. (1965). The black dots represent individual populations sampled for the genetic study. Population numbers correspond to Table S1.
For the purposes of morphometric analyses, we sampled 21 populations, representing four different regions of the distribution range (Table S2). A single lobe was cut from the corolla of 12–25 plants in each population and mounted on a paper sheet using transparent adhesive tape in the field. Wherever possible, samples were collected from plants growing at a distance of at least 10 m from any other sampled plant. Samples for morphometric analysis collected from the Hyrcanian region, which were obtained from sites 25 km apart (Populations 867 and 868), were mixed to a give a single population sample for the purposes of statistical analysis, owing to the small sample size.
DNA-Work and Data Analyses
DNA was extracted from desiccated leaf material using a modified CTAB method (Doyle & Doyle, 1987) as described by Sramkó et al. (2014). We used the same DNA regions used by Volkova et al. (2013), namely, the rpl32-trnL plastid spacer region (Shaw et al., 2007), the trnL-trnF plastid spacer region (Taberlet et al., 1991), and the complete nuclear ribosomal ITS (nrITS) region (Wen & Zimmer, 1996). To enhance resolution, we used the whole trnL-trnF region (trnL intron plus trnL-trnF spacer) instead of the spacer region only, as described by Volkova et al. (2013). PCR and sequencing were performed as described by Volkova et al. (2013).
Raw sequences and electropherograms were checked by eye for possible errors, after which the DNA sequences were manually aligned using BioEdit v.7.0.5.3 (Hall, 1999). The sequences of the two plastid DNA (pDNA) regions were combined into a single data matrix (“plastid dataset”) and the gaps were coded using the modified complex algorithm implemented in SeqState v.1.4.1 (Müller, 2005). In instances where DNA sequences differ with respect to only a few substitutions (as in our case, see the Results section), conventional phylogenetic methods may perform poorly (Crandall, 1996), and consequently, we carried out statistical parsimony analysis using the network algorithm described by Templeton et al. (1992) and implemented in the software TCS v.1.21 (Clement et al., 2000), which estimates unrooted haplotype networks with a 95% parsimony probability. We included Primula veris L. as an outgroup in the statistical parsimony analysis (it was shown to be one of the closest sister species to P. vulgaris in previous phylogenetic studies: Mast et al., 2001; Schmidt-Lebuhn et al., 2012). In the same studies, two further closely related species, P. megaseifolia Boiss. and P. juliae Kusn. were shown to be poorly genetically differentiated from P. vulgaris and probably paraphyletic, and were thus deemed unsuitable as outgroups in the present study. The online tool tcsBU (Santos et al., 2016) was used to visualize the haplotype and ribotype networks.
We also obtained sequences for herbarium samples (MW, MHA) of several Primula species from different sections, along with those from Cortusa matthioli L. and Hottonia palustris L. (Table S1), to verify our rooting with P. veris using multiple outgroups (following the phylogeny of the genus Primula described by Mast et al., 2001). Maximum likelihood analysis and tree building for the multiple outgroup (Figure S1) were performed with R 3.6.1 (R Core Team, 2019), using the packages Ape and Phangorn. Bootstrap values were estimated based on 1,000 bootstrap samples.
The sequences used in this study have been deposited in the GenBank database (MN826841–MN826918, MN854206–MN854330, MN865595–MN865671, MT137889–MT137895, MT155820–MT155829, MT155830–MT155839).
Morphometric Data Collection and Analyses
Morphometric analyses were based on the work of Yoshioka et al. (2004, 2007), who, by analyzing the outline shapes of Primula sieboldii E. Morren corolla lobes, were able to distinguish between both commercial varieties and natural geographical populations of this species. In the present study, we adopted this approach to characterize morphological differences between geographical groups of the studied populations.
Field-fixed lobes were scanned at high resolution using a Fujitsu Scansnap SV600 scanner (Fujitsu, Tokyo, Japan). The scanned images were used to record the shapes of petal outlines using tpsDig v.2.10 (Rohlf, 2006). Different numbers of landmarks, according to the size of the lobe, that accurately described the shape at high resolution, were placed manually on the corolla lobe outlines by the same person. Using the resampling function of tpsDig, a hundred landmarks were resampled on the outlines and placed equidistantly. Hangle–Fourier transformation (Haines & Crampton, 2000) and linear discriminant analysis (LDA) were performed using PAST v.2.17c (Hammer et al., 2001). The LDA results were based on the first 14 Hangle–Fourier coefficients, which described more than 99% of the variability of corolla lobe shapes. The statistical significance of morphometric separation was assessed by one-way pair-wise multivariate analysis of variance (MANOVA) using sequential Bonferroni significance in PAST. Using the morphometric dataset obtained, we performed three LDA analyses. The first two were run in PAST, in the first of which we defined all populations as separate groups, whereas the second analysis was run by defining four geographical regions recovered by the phylogenetic analysis as an a priori classification. Given that we wanted to show the mean shape of each population and their centroids, we thus ran a third LDA on corolla lobe shapes, in which each sampling site (i.e., population) was used as an a priori classification using the R package MASS (Venables & Ripley, 2002), with mean shape calculations being performed using the R package “geomorph” (Adams & Otárola-Castillo, 2013). For the purposes of this final LDA, we grouped the centroids of each population by convex hulls based on geographical regions with unique ribotype and haplotype combinations.
Results
TCS Reconstruction Based on cpDNA Sequences
The concatenated trnL-trnF and rpl32-trnL matrix consisted of 1,370 aligned positions, 49 of which were polymorphic and 25 parsimony informative. Our analysis revealed 58 haplotypes, two of which belonged to the outgroup species P. veris (Figure 2A, Table S1). The reconstructed haplotype network, with a calculated 95% parsimony maximum connection limit at 16 steps, was structured into five haplogroups, which were arranged consecutively, separated by several (at least three) mutational steps, and showed a strong geographical pattern (Figure 3A). The first haplogroup (I) comprised the two haplotypes (v1, v2) of P. veris. Haplotypes in the second haplogroup (II) were associated with populations located in the Colchis region and the Central and Eastern Caucasus mountains. The third haplogroup (III) was characterized by a considerably more complex structure with closed loops, and plants with haplotypes in this group were confined to the northeastern coast of the Black Sea. The fourth haplogroup (IV) appeared to have a star-shaped structure of haplotype relationships and was represented in plants that are widely distributed in Europe. The internal Haplotype 27 was widespread in Central and Southern Europe, and numerous haplotypes derived from Haplotype 27 could be found in the western and southern regions of Europe. Haplotypes 28–31 appeared to form a separate lineage distributed in Western Russia and the Crimea. Similarly, Haplotypes 42–49 formed a separate lineage distributed primarily in Western Europe, with exceptions being two locations in Southern Croatia and the Eastern Carpathians. Haplogroup V consisted of two haplotypes separated from Haplogroup IV by eight mutational steps and was confined to the Hyrcanian forest region. The network topology was congruent with the maximum likelihood tree, supporting the position of P. veris as the closest outgroup species, and indicating that Haplotype 1 diverged first in the ingroup (Figure S1).
Figure 2
Haplotype and ribotype networks reconstructed based on the combined plastid DNA dataset (A) and nrITS (B) with a 95% maximum connection limit in Primula vulgaris s. l. and the outgroup. The size of each circle is proportional to the frequency of the haplotype or ribotype in our datasets. Small unlabeled circles represent hypothetical haplotypes and ribotypes that were not sampled. The main groups of haplotypes (A) are denoted by Roman numerals (see Table S1).
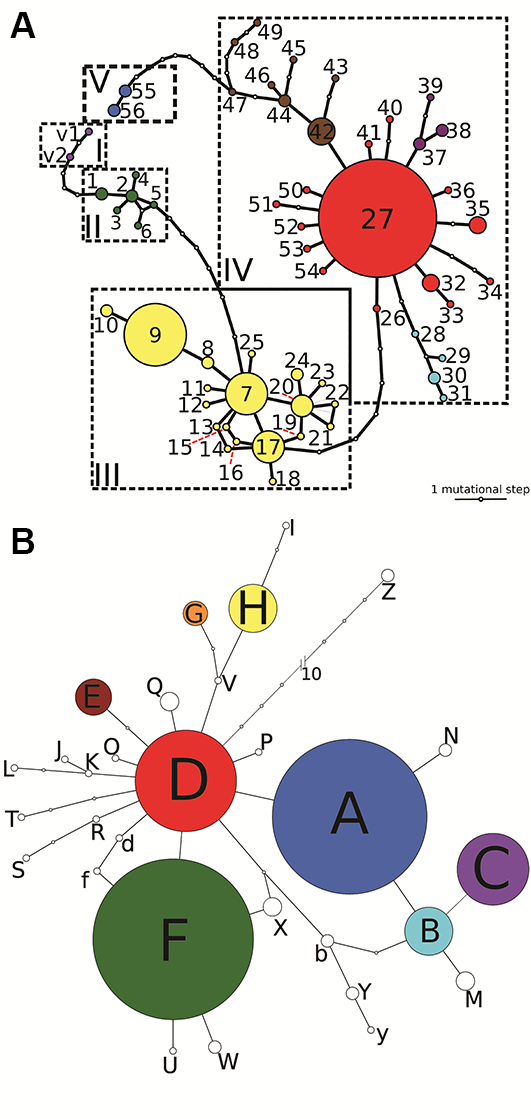
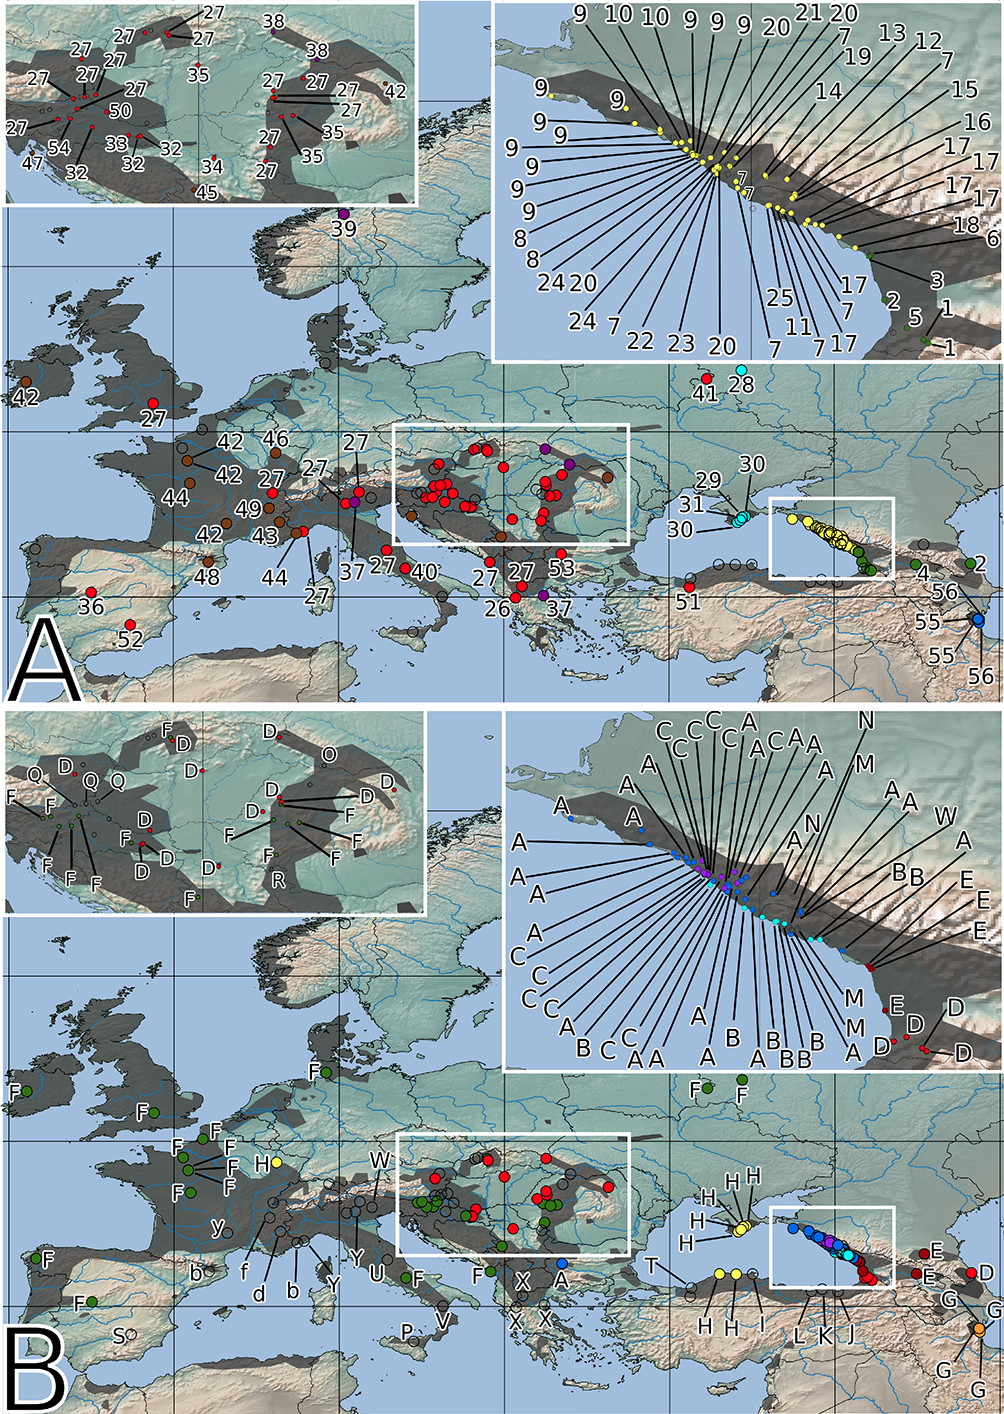
Figure 3
Spatial distribution of the identified haplotypes (A) and ribotypes (B). The color of the circles corresponds to that of the haplotypes and ribotypes shown in Figure 2. Empty circles represent samples that are missing from the plastid (A) or nrITS (B) dataset. The distribution range of Primula vulgaris is indicated by gray shading on the map.
Statistical Parsimony Analysis Based on nrITS Sequences
The nrITS matrix consisted of 647 aligned positions, 47 of which were variable and 29 parsimony informative. We were, however, unable to detect any evidence of nrITS paralogy (Álvarez & Wendel, 2003; Nieto-Feliner & Rosselló, 2007) in the direct sequence reads. Ambiguous sites appeared only at the beginning and end of the sequence reads and were trimmed off. The reconstructed ribotype TCS-network, with a calculated 95% parsimony maximum connection limit at 11 steps, connected all the ingroup samples into a single network (not shown). Manual increase of the connection limit to 13 steps facilitated integration of the outgroup species P. veris into the network (Figure 2B). Our analysis revealed 30 ribotypes, one of which (Z) belonged to P. veris, represented by two samples (Figure 2B, Table S1), and was connected to the D ribotype of the network. On the near star-like network of the ingroup, the majority of the ribotypes were connected directly to the “central” Ribotype D, which was confined to the Carpathians, Colchis, and the Eastern Caucasus (Figure 3B). Several ribotypes were derived from Ribotype D (Figure 2B). One ribotype group (comprising Ribotypes A, B, C, M, and N) was characteristic to the northeastern coast of the Black Sea, whereas another lineage (K, J, L) was found to be associated with Eastern Turkey. A third group, with a widespread internal Ribotype F, was common throughout the entire Europe distribution range, and several ribotypes (b, f, y, X, Y, U, W) closely related to Ribotype F were detected in some populations sampled in the Apennines and the Balkans. A fourth group was characteristic of the Ponto-Caspian region and the Eastern Caucasus (Azerbaijan: G, western Turkey: I, the Crimea and western Turkey: H) with Ribotype V being detected in a single Italian population. Additional satellite ribotypes of the central Ribotype D were scattered throughout most of the species’ distribution range: Ribotype R from the Western Carpathians was connected to an Iberian Ribotype S; Ribotype T was found in northwestern Turkey, Ribotype Q was from the Eastern Alps, Ribotype P was from Sicily, Ribotype O was from the Eastern Carpathians, and Ribotype E was from the Central Caucasus and the eastern coast of the Black Sea. Further, we detected two geographically outlying single occurrences represented by Ribotype H from France and Ribotype A from Bulgaria. The network topology was congruent with the maximum likelihood tree, supporting the position of P. veris as the closest outgroup species, and indicating that Ribotype D diverged first in the ingroup (Figure S1).
Morphometric Analysis
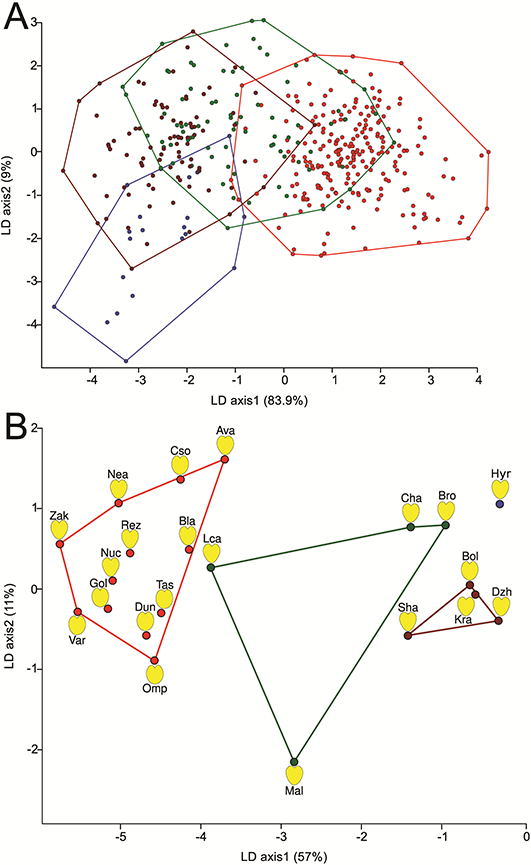
Analysis of the morphometric variation in petal shape revealed differences among all geographical regions with a uniformly high significance (p < 0.001), despite our detection of only minute differences in the mean shape of petals (Figure 4). Data clouds revealed by LDA were found to be overlapping in both analyses (only regional grouping is shown in Figure 4A). However, if sequential Bonferroni corrected significance levels were used in MANOVA, with a few exceptions, we were able to distinguish between populations that were collected from different geographical regions (Table S2). We found that Lca (Western Europe) and Kra (Caucasus) do not differ significantly from any other populations, whereas Mal (Western Europe), which bears Ribotype H that is characteristic of Crimean and northwestern Turkish populations (Figure 3B), differed only from Dzh (Caucasus). Furthermore, we found that populations from the Hyrcanian region (Hyr) differed significantly from most of the populations in the Carpathian Basin, but not from the Caucasian or Western European populations. However, we failed to observe any marked morphometric differentiation within regions (Table S3).
When grouping the populations according to their geographical origin, we were able to distinguish between all groups with high significance (Table S2). Using LDA, we identified the group centroids of each population (Figure 4B). Convex hulls drawn around each population centroid according to their geographical origin defined four nonoverlapping units. The Caucasian and Carpathian Basin samples form two somewhat distinct groups separated along the first axis. Notably, we observed a relatively higher regional diversity among Western European populations, which collectively form a third group of centroids, located between the two aforementioned groups. Considering only the relative distances between these three groups, the Hyrcanian region appears to be distinct from all three (Figure 4B). Although this region is underrepresented in our dataset, it is noteworthy that the Hyrcanian forest population appears to be closer to some Western European populations (Cha and Bro) than to those in either the Carpathian or Caucasian group.
Figure 4
Scatterplots of grouped geographical regions revealed by linear discriminant analysis (LDA) implemented in PAST (A) and population group centroids identified by LDA (B) with convex hulls drawn based on the geographical regions of origin. Color codes correspond to geographical regions as follows: brown – Caucasian region; red – Carpathian region; green – Western Europe; blue – Hyrcanian region. Calculated population mean shapes are depicted next to the group centroids. Please refer to Table S2 for descriptions of the identification codes.
Discussion
Our results clearly indicate the importance of previously neglected northern and eastern refugia (the Carpathian and Colchis regions) as sources of genetic variability among European populations of mesophilous plant species. As discussed further below, P. vulgaris appears to have initially spread westwards from the Colchis refugium, and subsequently during periods of glaciation, a proportion of the colonists survived in the Carpathian Basin, which served as a secondary center of diversity from which the entire European region was populated.
Genetic Variation in Primula vulgaris and Closely Related Taxa
The haplotype distribution of maternally inherited single-copy cpDNA and ribotypes of biparentally inherited multi-copy ITS are not perfectly congruent, which can be explained in terms of the peculiarities of these different marker types. For example, we identified two occurrences of geographically outlying single ribotypes, namely, Ribotype H in France and Ribotype A in Bulgaria, derived from plants sampled near settlements where various Primula plants are often kept in gardens for ornamental purposes. In most such cases, the exact origin of horticultural plants is unknown, and thus we cannot exclude the role of garden plants as putative pollen donors for plants from neighboring natural primrose populations, thereby giving rise to hybrids characterized by local haplotypes combined with outlying ribotypes. Thus, only simultaneous analyses of both datasets, taking into account their drawbacks and (to some extent) the results of morphological analysis, could provide us with a full picture of the species phylogeography.
Plants from the Hyrcanian region were found to be genetically highly divergent (particularly with respect to their plastid sequences), show discrete morphological differences (the abaxial surface of leaves is whitish and hairy), and have a distinct distribution range (Iran and Azerbaijan), and accordingly should be treated as a separate species, Primula heterochroma Stapf, rather than a subspecies of P. vulgaris [P. vulgaris subsp. heterochroma (Stapf) Smith et Forrest: Richards, 2003]. The origin of P. heterochroma is assumed to be associated with refugia in the South Caspian Basin (cf. Christe et al., 2014; Tarkhnishvili et al., 2012).
The History of Primula vulgaris: Glacial Survival and Migrations in Europe
Ribotype D and Haplotype 1, detected in P. vulgaris populations distributed in Colchis, are connected to the outgroup and accordingly should be treated as ancestral. Populations with haplotypes from the root Haplogroup II and the root Ribotype D and its close derivative E are also found in Colchis and the Central and Eastern Caucasus (Figure 3). Thus, the Colchis region and adjacent areas of the Ponto-Caspian region are assumed to be the main refugia where mesophilous P. vulgaris could have survived during multiple Quaternary glaciations, including the most severe glacial periods (Svendsen et al., 2004). These findings are consistent with those of earlier studies, which have highlighted the role of the Colchis region as an “archive of ancient plant lineages” (Grimm & Denk, 2014; see also Bartha et al., 2015; Tarkhnishvili et al., 2012; Volkova, Burlakov, et al., 2020).
From the Colchis refugium, P. vulgaris subsequently spread westwards along the northwestern coast of the Black Sea, as proposed earlier and discussed in detail by Volkova et al. (2013). This expansion is indicated by the distribution of the lineage of ribotypes (A, B, C, N, M) and Haplogroup III. The complex structure of the latter tends to indicate long-term in-situ glacial survival, in accordance with the past climate reconstructions (Svendsen et al., 2004; Tarkhnishvili et al., 2012). Similarly, as can be deduced from the distributions of Ribotypes K, L, and J, western Turkey was also colonized by P. vulgaris originating from Colchis (Volkova et al., 2013), although given the lack of cpDNA sequences from these populations, we are currently unable to conclusively establish this colonization route.
Primula vulgaris originating from the northeastern Black Sea coast further colonized the Carpathian Basin during interglacial periods when the improved climatic conditions became conducive to such colonization. This colonization event is evidenced by the distribution of the Central Haplotype 27 derived from Haplogroup IV and the root Ribotype D, possibly existing there due to a shared ancestral polymorphism.
We thus confirmed our earlier hypothesis, based on geographically limited sampling (Volkova et al., 2013), that the Colchis region is not only an important repository of genetic variability (Grimm & Denk, 2014) but also its source for European populations. Although this has been previously postulated based on florogenetic reconstructions (Kamelin et al., 1999 and references therein) and hypothesized in early comparative phylogeographic studies (Hewitt, 2000; Taberlet et al., 1998), it is only in the present study that this has been definitely demonstrated.
We also propose that the Carpathian Basin has served as an independent glacial refugium for P. vulgaris [at least during the last glacial maximum (LGM)], as is evident from the high genetic divergence of the Carpathian Basin plastid sequences from populations distributed along the northeastern coast of the Black Sea. These findings are consistent with earlier assumptions that the Carpathian Basin constituted a refugium for temperate plants, based on genetic studies (e.g., Bartha et al., 2015; Gömöry et al., 2003; Magri et al., 2006; Trewick et al., 2002) and recent paleobotanical reconstructions (Feurdean et al., 2007). Moreover, we have previously predicted the importance of the northern cryptic refugia for P. vulgaris (Volkova et al., 2013), as this mesophilous species can survive in harsh alpine habitats, and its distribution tends to be limited to a greater extent by humidity than by temperature (Jacquemyn et al., 2009).
It is indeed conceivable that most of the European populations of P. vulgaris originate from a postglacial expansion of refuge populations surviving in the Carpathian Basin. As is evident from the distribution of haplotypes and ribotypes, P. vulgaris spread from the Carpathian Basin to Western Europe. We also hypothesize that the Apenine and Iberian peninsulas may have been colonized from the Carpathian Basin, although this contradicts the traditional view on plant migrations in Europe (Hewitt, 2000; Taberlet et al., 1998) and is not supported even by studies that have revealed the refugial role of the Carpathian Basin (e.g., Bartha et al., 2015; Gömöry et al., 2003; Magri et al., 2006; Provan & Bennett, 2008; Trewick et al., 2002). This pattern could be explained by the dry climate of the southern peninsulas during the LGM (Markova & Kolfschoten, 2008) that was unsuitable for P. vulgaris (Jacquemyn et al., 2009). Furthermore, we found that the geographical distribution of ribotypes in Italy and the Balkans does not perfectly match their phylogenetic relationships, which could reflect the complex evolutionary history of this marker type as well as population extinctions. Carpathian P. vulgaris may also have colonized the western part of the Black Sea coast (the Crimea and western Turkey). In this regard, the observed genetic variability in these two regions (distinct haplotypes in the Crimea and different ribotypes in western Turkey) indicates that this colonization may have occurred prior to the LGM, and that P. vulgaris may have survived through periods of glaciation in Western Anatolia (a refugium reconstructed by Tarkhnishvili et al., 2012) and in the Crimea (a refugium on its southeast coast was described in Markova & Kolfschoten, 2008). Furthermore, one of the P. vulgaris populations in Central Russia (with Haplotype 41, derived from the Central European Haplotype 27) may also be of Carpathian origin, whereas the origin of a second population (characterized by Haplotype 28, which is linked with the Crimean Haplotypes 29–31) could be associated with a refugium that existed in the central part of the Dnepr valley (Markova & Kolfschoten, 2008).
Concluding Remarks
In an overwhelming number of phylogeographical studies of European species the eastern part of the area has been insufficiently sampled. It is well known that only area-wide phylogeographic analyses could well reveal cryptic assemblages of genetically distinct taxa, which are probably in need of protection (Van Rossum et al., 2018). Indeed, in this study we identified genetic differentiation among populations of P. vulgaris originating from the Hyrcanian, Colchis, and Carpathians regions, which indicates that Hyrcanian plants should be treated as a separate species, namely, P. heterochroma. A comparable genetic split between Carpathian and Caucasian populations has been revealed for two closely related species (Erythronium dens-canis and E. caucasicum) with ecological preferences similar to those of P. vulgaris (Bartha et al., 2015).
Thus, the relative roles of the southern (“main”), northern (i.e., cryptic northern) and eastern (e.g., Colchis) refugia in shaping the evolutionary histories of European temperate plants need to be further evaluated in continental-scale phylogeographic studies of species with different ecological preferences. Such investigations could make a valuable contribution to determining appropriate conservation strategies.
Supporting Material
The following supporting material is available for this article:
Figure S1. The maximum likelihood trees for the observed haplotypes and ribotypes and the multiple outgroup.
Table S1. Samples for molecular phylogenetic analyses included in this study.
Table S2. Population samples of Primula vulgaris for morphometric analyses and the difference between four geographic groups of these samples.
Table S3. Significance level of morphometric differentiation between each two population pairs.
Handling Editor
Agnieszka Popiela, University of Szczecin, Poland; https://orcid.org/0000-0001-9297-0538
Authors’ Contributions
PV and LL performed laboratory studies and analyzed the molecular data, these authors contributed equally to this work; PV wrote the manuscript; LL performed the morphological analyses; LL and GS created maps; all authors collected plant material and contributed to the manuscript
