Introduction
Drought is an abiotic stress that affects plant generation and productivity and causes alterations in several physiological, biochemical, and molecular pathways. Eighty percent of agricultural land areas in the world are cultivated by rain, thus, understanding the role of regulators of drought stress responses is important to improve and adopt drought-tolerant cultivars.
Responses of crops to drought depend on the severity of drought stress and vary among species and cultivars in terms of highly complex differentiations that allow the organism to survive. Accumulation of certain compounds, synthesis of antioxidants, variation in signal pathway and transduction networks, abscisic acid metabolism and transport, changes in gene expression, production of stress-related proteins, and changes in metabolic profiles are some of the well-known responses during abiotic stress (Banerjee & Roychoudhury,2016; Bray,2002; Christmann et al.,2005; Griffiths & Parry,2002; Zeevaart & Creelman,1988).
Severe drought stress causes a decline in photosynthesis rate due to limited stomatal conductance, which is the main contributor to reduced photosynthetic rate (Bota et al.,2004). In addition to effects on the photosynthetic process, drought causes an imbalance between light capture and its utilization and also leads to oxidative stress accompanied by the generation of reactive oxygen species (ROS) in plant cells. Changes in plant cells under oxidative stress can impact the growth or even cause plant death (Liu et al.,2015; Reddy et al.,2004).
Abscisic acid (ABA) has important effects on biological processes and plays a major role in plant response and tolerance to biotic and abiotic stresses (Raghavendra et al.,2010). At present, there is a plethora of data regarding ABA and stress; generally, these focus on the function of ABA in stomatal defense, analysis of ABA signal components, and the relationships of the components in the complex network of interactions. Stress signals are converted to ABA, and this triggers the activation of a number of plant physiological and developmental processes, thereby inducing acclimatization to stress conditions. In addition, most target proteins are restricted to the final stage of ABA signal transduction; these include transcription factors, which regulate the expression of ABA-responsive genes. Endogenous ABA levels in plant cells are increased in response to osmotic stress and lead to the activation of stress-responsive genes such as NAC1, NAC2, ORE1, WRKY24, SAG12, SAG13, KCS2, CER1, DREB2A, LTP3, SWEET15, and PYL9. Like ABA-independent gene expression, ABA-dependent gene expression also plays an essential role in transcriptional regulatory networks under osmotic stress conditions. Plants have developed complex stress response strategies, and genes encoding transcription factors (TFs), the main regulators of stress-sensitive genes, are excellent candidates for crop improvement. Relevant examples from recent studies include TF gene modulation and overexpression approaches in plant species to increase stress tolerance. Still, there is much to discover about various plant TFs, and only a few of the 80 TF family have vital roles in abiotic and biotic stress responses (Baillo et al.,2019).
The wild watermelon is a C3-plant and has very complex mechanisms to overcome drought stress. Studies on the physiological and biochemical responses of melon (Citrullus lanatus) to drought stress at the cultivar level is currently lacking. Generally, these deal with metabolic substances like citrulline, or with water status (Yokota et al.,2002). Also, some studies make use of boron treatments, or report on proteomic studies on different genotypes (Hamurcu et al.,2015). Since drought responses vary with assorted cultivars, the impact of drought stress on crops has been concentrated on different and newly developed adaptive cultivars. The demand for drought resistant crops to cope with drought stress is going to increase due to the increases in the frequency and severity of drought events in the future. Therefore, this study aims to investigate the effects of drought on the physiological, biochemical, and molecular responses of three different watermelon cultivars, and to introduce these genotypes to literature by focusing on the expression level of genes playing roles in the ABA pathway, photosynthesis, and antioxidant systems. Responses of genotypes vary depending on the severity of drought and on the resistance mechanism of the plant species or of newly generated cultivars.
Material and Methods
Plant Growth and Drought Stress Treatments
An experiment was performed in triplicate using three plants per cultivar to investigate the drought tolerance capacities and responses of three different watermelon cultivars under severe drought stress conditions. Three watermelon cultivars with contrasting drought stress characteristics, namely 24 (drought resistant), CS (moderately tolerant), and 98 (drought sensitive), were used as plant materials. Five surface-sterilized uniform seeds were planted in drainage-free plastic pots with 15 cm height and 10 cm diameter. Each pot was filled with air-dried, sieved (0.5 mm), and uniformly mixed peat loam soil.
Ten days after germination, seedlings were thinned to three per pot. After a week, second thinning was carried out, and one uniform seedling was selected per pot for the rest of the experiment. When the seedlings reached four leaf stages, the control treatment was irrigated with a 4-day interval. The treatment groups were not irrigated until harvesting. Plant samplings and measurements were carried out on the seventeenth day of drought treatment. Different control groups were made for each treatment based on the cultivar. The pots with different cultivars were rotated on every alternate day to ensure that all pots receive similar radiation and other environmental conditions until harvesting. Measurements were done in triplicate to be able to construct a meaningful probability.
Physiological Measurements and Enzymatic Antioxidant Activities
Chlorophyll and Carotenoid Contents
The chlorophyll (chl) and carotenoid contents were extracted using 80% acetone from the juvenile leaves of both treatment and control plants. Absorbance values were measured at 450, 663, and 645 nm wavelengths using a UV-160 Shimadzu spectrophotometer. Chlorophyll a, total chlorophyll, and carotenoid content were calculated as previously described (Arnon,1949).
Proline Content
Proline contents were measured as described previously (Bates et al.,1973). First, 1 g of a fresh leaf was ground and homogenized with 5 mL 40% methanol using a mortar and pestle. The mixture was centrifuged at 4,032 g for 15 min. Then, 1 mL of supernatant was taken and mixed with 100 mg of ninhydrin, 1 mL of acetic acid, and 1 mL ortho-phosphoric acid. The mixture was heated in a water bath for 1 hr and then incubated on ice for 5 min. Afterwards, 2 mL of the mixture was taken, extracted with 2 mL of toluene, and quickly vortexed until phase differences were formed. The upper phase was taken, and absorbance was measured using a spectrophotometer at 520 nm. A standard curve was prepared using pure l-proline to determine the proline content of the watermelon cultivars. Proline content was then expressed in mg g−1 FW (fresh weight).
Enzymatic Antioxidant Activities
Protein extractions for the enzyme assays were performed for all samples prior to antioxidant activity analysis. First, 1 g of fresh leaves was washed in chilled distilled water, homogenized with a chilled mortar and pestle in 5 mL of 0.1 M extraction buffer (10 mM KCl, 1 mM MgCl2, and 10 mM EDTA, pH 7.0), and centrifuged at 11,200 g, 4 °C for 20 min. The supernatant was used for enzyme assays. The enzymatic protein content was determined by the Bradford method (Bradford,1976), and the protein contents were expressed as mg g−1 FW. All antioxidant enzyme activities were calculated according to the protein contents.
Glutathione reductase activity was determined by adding 2.5 mL 120 mM K-phosphate buffer (pH 7.2), 0.1 mL 0.015 mM EDTA, and 0.1 mL 0.065 mM oxidized glutathione to 0.1 mL enzyme extract. After 5 min, 0.05 mL 9.6 mM NADH was added, and the solution was mixed thoroughly. Absorbances at 340 nm were recorded by 5-second intervals. The enzyme activity was presented as µmol g−1 FW oxidized NADH.
Catalase (CAT) activity was estimated by the UV method reported by Aebi (Aebi,1984). First, 300 mL of enzyme extract was mixed with 0.5 mL of 10 mM H2O2 and 600 mL of 30 mM potassium phosphate buffer. Decreases in absorbance were recorded at 240 nm for 30-second intervals. Enzyme activity was calculated as U mg g−1 FW decomposed H2O2.
Ascorbate peroxidase (APx) activity was estimated by a modification of a method previously described (Nakano & Asada,1981). First, 0.3 mL of 50 mM K-phosphate buffer (pH 7.0) containing 0.5 mM AA was added to 0.1 mL of enzyme extract. The volume of the total reaction was completed to 1 mL by adding distilled water. The reaction was started by adding 0.06 mL of 1 mM H2O2. The absorbance decrease was recorded after 10 s at 290 nm. Enzyme activity was calculated as U mg g−1 decomposed ascorbate.
Superoxide dismutase (SOD) activity was calculated by adding 0.1 mL enzyme extract to a reaction mixture containing 1.5 mL 50 mM sodium phosphate (pH 7.8), 0.3 mL 130 mM methionine, 0.3 mL 750 mM nitro-blue tetrazolium (NBT), 0.3 mL 100 mM EDTA-Na2, 0.300 mL 20 mM riboflavin, and 100 mL distilled water. Extracted samples were illuminated in light of 4,000 flux for 20 min, and the sample absorbance was recorded at 560 nm using a UV/visible spectrophotometer. One unit of SOD activity was regarded as the amount of enzyme used for 50% inhibition of the NBT reduction (Giannopolitis & Ries,1977). SOD activities were expressed as U mg g−1.
Lipid Peroxidase Assay Content
Elevation of lipid peroxidation was determined in terms of thiobarbituric acid reactive substance (TBARS) content. First, 500 mg of watermelon samples were homogenized with 5 mL of 0.1% TCA. Homogenates were centrifuged at 7,168 g for 15 min, after which 4 mL of 20% TCA containing TBA was added to 1 mL of supernatant. The mixture was heated in a water bath at 95 °C for 30 min and cooled in an ice bath quickly. Absorbance was recorded at 532 nm after centrifugation at 7,168 g for 10 min (Heath & Packer,1968). TBARS content was calculated using its extinction coefficient of 155 mM−1 cm−1 as TBARS g−1 FW.
Gene Expression Analysis (RNA Isolation, cDNA Synthesis, and Quantitative qRT PCR Analysis)
Leaf tissues of three different watermelon cultivars were harvested for use in qRT-PCR analysis. qRT-PCR reactions were run with three biological replicates. Total RNA of leaf and root tissues were isolated using the NucleoSpin RNA Kit (Macherey-Nagel) according to the manufacturer’s protocols. RNA concentrations were determined using the NanoDrop ND-1000 spectrophotometer, and the RNA were also confirmed by gel electrophoresis using 1.5% agarose gels. cDNA synthesis was performed with 2 μg of RNA and a high-fidelity cDNA synthesis kit (Sigma), which contained 2.5 µM Anchored-oligo (dT)18, 1× transcriptor high-fidelity reverse transcriptase reaction buffer, 20 U protector RNAse inhibitor, 1 mM deoxynucleotide mix, 5 mM DTT, and 10 U transcriptor high fidelity reverse transcriptase as their final concentrations. The following incubation conditions were applied: 10 min at 65 °C, 30 min at 55 °C, and 5 min at 85 °C.
qRT-PCR was performed with a Thermo Scientific PikoReal thermal cycler. Primer sequences of the target genes and the housekeeping gene used for normalization were designed with the Primer3 program based on the sequences of 12 different and important genes related to drought mechanisms in plants. qRT-PCR reactions were performed in triplicate, and controls were included for each gene. Amplifications of PCR product were monitored using an intercalation-based method using SYBR Green I dye. The glyceraldehyde-3-phosphate-dehydro-genase (GAPDH) gene was used for normalization of the expression level. Three replicates were obtained for each sample. Gene expression levels were calculated according to the 2−ΔΔCT algorithm.
Results
The cultivars of watermelon seedlings were exposed to explore the mechanisms underlying drought tolerance. Results were compared among all the cultivars and control. Significant proline content increases in all varieties of watermelon seedlings were observed under limited water conditions. The increase in proline content in 24 (tolerant variety) was higher than that in the 98 and CS varieties. Proline content increased 2.12-, 2.8-, and 2.1-fold in the 98, 24, and CS cultivars, respectively, compared to that in their control groups (Table 1).
Table 1
Proline, chlorophyll, and carotenoid contents in watermelon seedlings grown under drought conditions.
The chl a contents of the 98 and CS cultivars were not significantly affected by drought stress, whereas total chl content in the 24 (tolerant) and CS (moderately tolerant) cultivars was significantly higher than that in the control groups. Both chl a and total chl contents of cultivar 98 (sensitive) were slightly decreased under drought conditions. Also, carotenoid contents of cultivars did not significantly differ, except for the tolerant cultivar 24. The 24 cultivar exposed to drought stress exhibited a 2.04-fold increase in carotenoid content compared to that in the control group (Table 1).
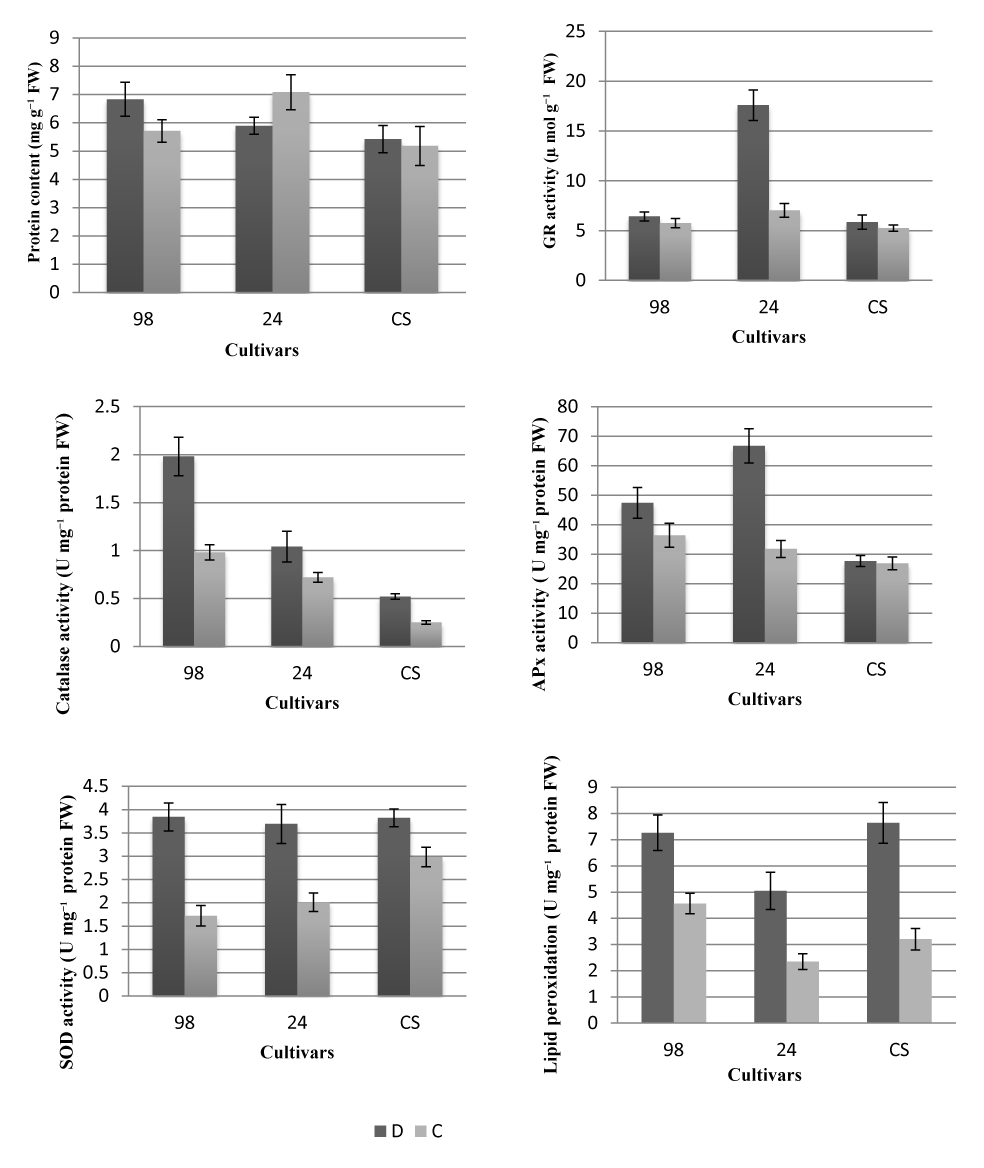
GR, APx, and SOD activities in drought-exposed seedlings of cultivar 24 significantly increased compared to that in the control group (Figure 1). The sensitive cultivar 98 exhibited higher CAT activity and lower GR activity under drought stress. GR activity differed from the others during the general evaluation of antioxidant enzymes. GR activity in cultivar 24 was significantly higher than that in the control group and the other two cultivars. The increase in antioxidant defense enzymes in cultivars is related to their tolerance, though the lipid peroxidation activity especially decreased in cultivar 24, which was an expected response in tolerant varieties (Figure 1).
Figure 1
Protein content and antioxidant enzyme activities in watermelon seedlings grown under drought conditions. D – drought treatment; C – control; 24 – drought resistant; CS – moderately tolerant; 98 – drought sensitive. FW – fresh weight.
Drought-resistant mechanisms were also screened by measuring the expression level of twelve important genes that are known to play important roles; this was done by observing expression profiles and by analyzing gene expressions of the diverse genes that play roles in the ABA pathway. Most of these genes (ORE1, SAG12, SAG13, KSC2, CER1, SWEET15, and PYL9) were first studied in watermelon under drought stress. The expression levels of NAC1, NAC2, ORE1, WRKY24, SAG12, SAG13, KCS2, CER1, DREB2A, LTP3, SWEET15, and PYL9 genes were measured using qRT-PCR. The expression levels of genes were significantly varied depending on the location of gene and the drought tolerance of watermelon cultivars.
According to qRT-PCR results, the expression profiles of NAC1, NAC2, and ORE1 genes were found to be almost similar. Thus, expression of these genes increased in the drought treated groups of both sensitive 98 and resistant 24 cultivars. In contrast to cultivars 24 and 98, NAC1 and NAC2 gene expression levels were found to be lower in the moderate CS cultivar group exposed to drought stress. However, the expression profile of the ORE1 gene exhibited a high expression level in all three investigated cultivars (resistant, sensitive, and moderate) (Figure 2).
Figure 2
Gene expression results in watermelon seedlings grown under drought conditions. X axis – relative gene expression (fold change – log2). Y axis – cultivar/treatment. D – drought treatment; C – control; 24 – drought resistant; CS – moderately tolerant; 98 – drought sensitive.
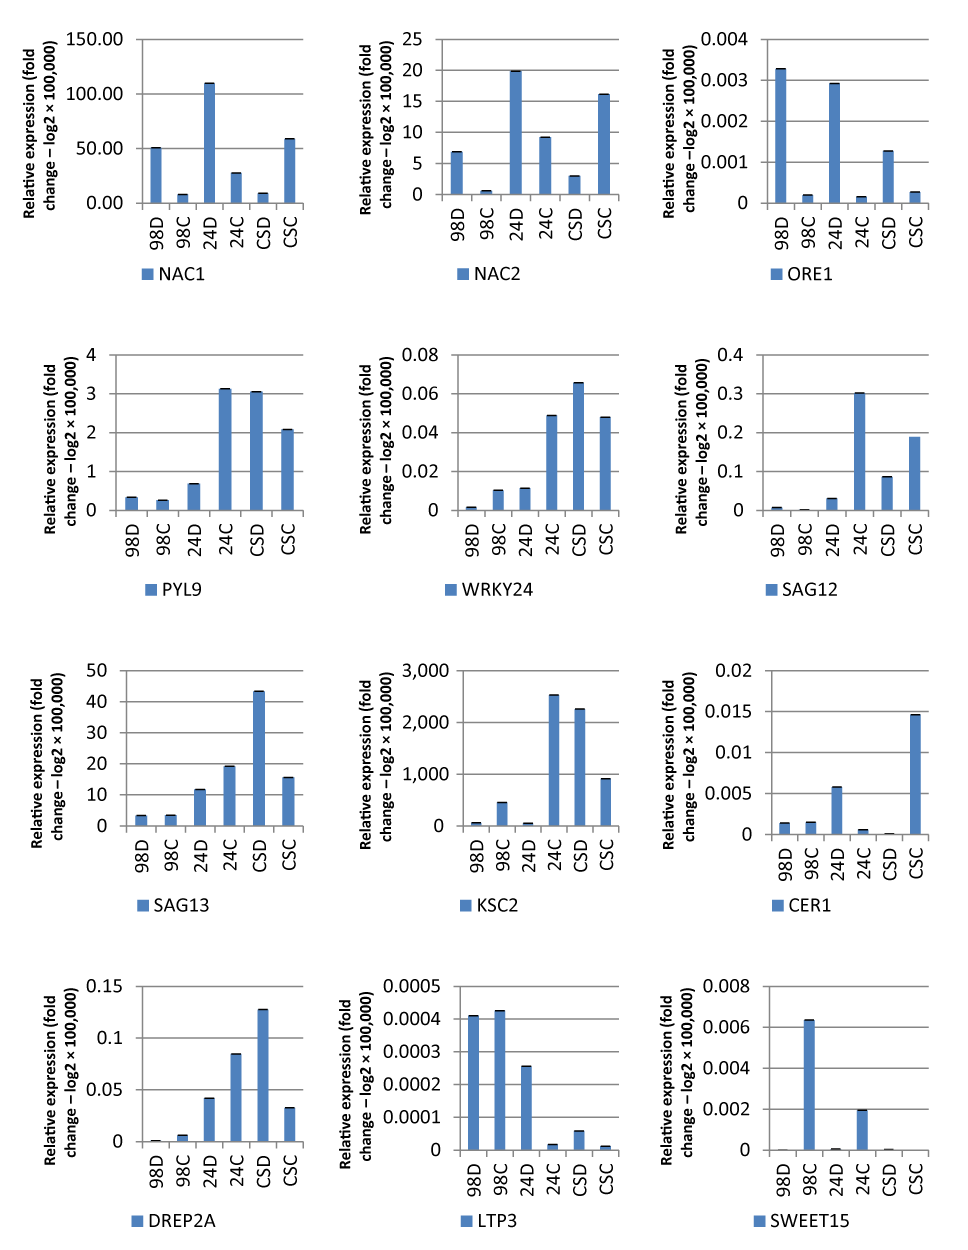
On the other hand, the expression levels of WRKY24, SAG13, KCS2, DREB2A, and PYL9 genes were upregulated only in the drought treated groups of the moderately resistant CS cultivar. On the contrary, these genes exhibited low gene expression levels in groups under drought treatment of both sensitive and resistant cultivars of watermelon. Moreover, both SAG12 and SWEET15 genes represented similar expression profiles, which were found to be significantly higher in the control samples of resistant cultivar 24 than the other groups of watermelon cultivars exposed to drought stress. Expression levels of SAG12 and SWEET15 genes were not found to be significantly different between the drought treated and control samples of both 98 and CS cultivars. Finally, the expression levels of LTP3 and CER1 genes were higher in drought treated samples than the control samples of resistant cultivar 24. However, no significant expression differences were found between drought treated and control samples of the sensitive cultivar 98 (Figure 2).
Discussion
The accumulation of osmoprotectants (especially proline) and drought tolerance are related to each other, while enhanced proline accumulation was thought to be related to the upregulation of the delta1-pyrroline-5-carboxylate synthetase gene, which encodes the limiting enzyme in proline biosynthesis (Hu et al.,1992). Accumulation of these compounds is a spontaneous process, and increased synthesis and decreased catabolism lead to increases in drought resistance (Sharma et al.,2011). Many studies show that proline and other pathways interact with each other. Salicylic acid in wheat increased the abscisic acid content and led to the accumulation of proline (Shakirova et al.,2003). This can be explained by the reduction of H2O2 generation and soluble protein content, and also by the increase in chl a, chl b, and total chl contents due to the prevention of chl break down in tolerant cultivars (Haddad & Kamangar,2015). Decrease in chl content may be the response of pigment degradation in chloroplast; therefore, we examined the chloroplast ultrastructure in the leaves of tolerant watermelon cultivars to observe the impairment of the photosynthetic system. The carotenoid level of tolerant cultivar 24 was significantly higher than the control group. Carotenoids and other compounds are involved in scavenging singlet oxygen and lipid peroxy radicals, inhibition of lipid peroxidation, and superoxide generation under dehydrative conditions. A primary protective role of β-carotene in photosynthetic tissue may be linked to direct quenching of triplet chlorophyll, which prevents the generation of singlet oxygen and protects the plant from oxidative damage.
Plants possess a natural capacity to stimulate their own defense mechanisms depending on their tolerances and on the severity of stress. The activities of GR, CAT, APx, and SOD in watermelon seedling leaves are higher than in their control groups; however, the rates of increase varied depending on the characteristics of the cultivars, especially in 24 and CS. Our findings suggest that drought stress induces the expression of antioxidant enzymes in the drought-resistant cultivar 24. Cultivar 24 could cope well with drought stress by increasing the activities of mainly SOD, GR, APx, and CAT. Cultivar 24 exhibited a better protection mechanism against drought stress due to the higher free radical scavenging capacity and lower levels of lipid peroxidation activities. The effects of water stress on enzyme activities are disputable and depend on both the tolerance level of plants and on the specific mechanisms underlying water stress. These metalloenzymes constitute an important primary line of cellular defense against superoxide free radicals generated under stress conditions (Ni et al.,2009). In this sense, it is seen that genotypes that are tolerant, moderate, and sensitive differ with each other and each seek different metabolic pathways for survival according to their genetic potential.
The identification of gene profiles is a useful tool in determining which cultivars exhibit inadequate or sufficient stress tolerance. As such, a single gene may not exhibit a high level of corresponding tolerance due to the complexity of molecular drought stress mechanisms. The products of drought-inducible genes participate in the synthesis of regulatory metabolic proteins. Some of these regulatory molecules can also launch a second round of circulation (Pan et al.,2006).
Plants have adaptive stability in the physiological, molecular, and cellular levels to maintain water status under stress. Many networks of signaling play crucial roles in fighting the effects of stress in plants. Drought stress causes versatile and often adverse effects on plant growth, development, physiological processes, and gene expression. In addition, various TFs are implicated in triggering specific genes involved in the plant hormonal systems that create the plant defense mechanisms.
The proportion of ABA in plant cells affects the expression level of ORE1, and it was also suggested that ORE1 delays plant senescence and makes plants more resistant to drought stress (Zhao et al.,2016). In most of the previous studies, NAC TF was found to be participating in the ABA-related signaling pathway and regulated drought biomechanisms in plants (Sakuraba et al.,2014). The expression level of NAC1 gene increases drought and salinity stress tolerance (de Oliveira et al.,2011; Si et al.,2009). In the current study, it was also found that the expression of the NAC1 and NAC2 TFs increased in sensitive and resistant watermelon cultivars exposed to drought stress. Therefore, it was showed that our results were consistent with many previous studies. However, a reduction in the expression level of NAC1 and NAC2 were detected in the moderately resistant cultivar CS. It was estimated that this result, which differs from other cultivars, was due to the still-unstable resistance mechanism in moderate watermelon CS cultivars. In addition, molecular and biochemical pathways related to resistance mechanisms in the CS cultivar may have a significant impact on expression status. As a NAC TF the ORE1, ORE3, and ORE9 genes not only play crucial positions in the regulation of leaf senescence, but also have important functions in programmed cell death (PCD) and other abiotic stresses (Matallana-Ramirez et al.,2013; Nakashima et al.,2012) . In the current study, the expression profile of ORE1 was found to be most similar with NAC1 and NAC2 TFs (Figure 2). That result was expected as the ORE1 gene is known to belong to the NAC TF. In this study, the ORE1 gene, which is usually known to regulate senescence in plants, was studied in watermelon cultivars under drought stress. It is estimated that data about ORE1 can be a resource for future functional studies on watermelons under drought stress.
Expression levels of genes including senescence genes WRKY24, SAG13, KCS2, DREB2A, and PYL9 were found to be upregulated only in drought treated groups of moderately drought resistant cultivar CS. On the contrary, these genes exhibited low gene expression levels in groups under the drought treated sensitive and resistant cultivars of watermelon. These results also provide a way to compare senescence-related genes and other TFs, which are usually used as marker genes during abiotic-biotic stresses. WRKY and DREB2A TFs were known to have crucial roles in response to diverse abiotic stress in many plants (Leng & Zhao,2019). In this study, it was inferred that senescence genes and other conventional stress response genes showed almost the same expression profile, and that they were consistent with each other.
WRKY is an important TF that induces abiotic stress-related genes and regulates multiple mechanisms at the gene level in the ABA-responsive pathway (Eulgem et al.,2000; Siddiqui et al.,2015). The SAG13 transcript has an important role by regulating the senescence pathway in plants, and the LTP gene also has a significant effect on the drought pathway in plants and is induced under several abiotic stress and senescence processes. In our study, the expression level of LTP3 was also upregulated in both drought resistant and moderate cultivars, but exhibited minor expression changes in the sensitive cultivar (Figure 2). The DREB1/CBF-type TFs presented higher drought response in addition to expression of cold-responsive genes (Ishizaki et al.,2013). Overexpression of Os DREB1G is also known to stimulate drought tolerance. DREB2A also regulates drought stress response gene expression levels, which in turn improves drought stress tolerance in plants (Qin et al.,2004). It was observed that DREB2A was upregulated only in drought treated groups of the CS moderate resistant variety. In contrast to the high expression in the CS variety, DREP2A exhibited low expression levels in drought treated groups of both sensitive and resistant cultivars. The interactions of plant physiology, biochemistry, and molecular biology are crucial for understanding the mechanisms underlying the plant tolerance system. Despite the deficiency of information on the whole phenomenon, efforts on understanding plant acclimatization mechanisms encourage future studies on evaluating the data under environmental stresses. The KCS2/Daysi gene encodes a 3-ketoacyl-CoA synthase 2, and it is functionally related with cuticular wax and root suberin biosynthesis (Lee et al.,2009). In our study, KCS2 expression was found to be upregulated only in the moderate-resistance cultivar CS. In the sensitive and resistant cultivars, the expression was decreased under drought stress when compared to that in the control groups. Thus, it can be asserted that the KCS2 gene did not measure drought levels in the watermelon cultivars used in the current study. In our previous study, the CER1 gene was defined, and it was mainly expressed in the epidermis of aerial organs and was found to be induced by abiotic stresses (Bourdenx et al.,2011). In our study, we also found that the CER1 expression level was induced only in the drought resistant cultivar 24. Thus, it was inferred that the CER1 gene was found to be the most compatible marker gene used in drought stress in the current watermelon cultivars.
Senescence associated genes (SAGs) are stimulated by leaf senescence. The SAG12 and SAG13 genes exhibited different expression profiles between the resistant and sensitive cultivars. The expression of SWEET15/SAG29 is stimulated by ABA and osmotic stress through binding between ABF4 and the promoter of SWEET15/SAG29. Contrary to this, it was found that the SWEET15 gene expression was not affected by drought stress in watermelon cultivars (Figure 2).
To conclude, it is known that the most effective method of coping with increasing drought worldwide is the development of varieties with high tolerance. As such, we believe that the importance of gene sources in terms of breeding should be better understood.
