Abbreviations
ABA: Abscisic acid
CDS: Coding Sequence
CMS: Cytoplasmic-male-sterility
GFP: Green fluorescent protein
HMM: Hidden Markov Model
MeV: MultiExperiment Viewer 4.9
MS: Murashige & Skoog medium
qRT-PCR: Quantitative real time PCR
RFL: Restorer-of-fertility-likes
StPPR: Potato Pentatricopeptide repeat
. Introduction
Pentatricopeptide repeat (PPR) proteins were first named in the plant Arabidopsis (Arabidopsis thaliana), and consist of tandem arrays of two to 30 PPR motifs of 31 to 36 amino acids that form double alpha-helices connected by a small loop (Barkan & Small, 2014; Small & Peeters, 2000). PPR is ubiquitous in land plants, including Arabidopsis, tomato (Solanum lycopersicum), rice (Oryza sativa) and maize (Zea mays), with more than 400 members (Chen et al., 2018; Ding et al., 2014; Lurin et al., 2004; Wei & Ping, 2016), while it is rare in lower plants and animals (Barkan & Small, 2014). Numerous studies demonstrate that these proteins localize to plastids and mitochondria, playing a role in post-transcriptional processes such as RNA editing (Kotera et al., 2005; Okuda et al., 2007), RNA splicing (Chen et al., 2019; Schmitz-Linneweber et al., 2006), stability and translation (Zoschke et al., 2016), thereby affecting the growth and development of plants.
PPR proteins contained the P subfamily, and the PLS subfamily were divided into more subclades in detail based on C-terminal domains (Cheng et al., 2016; Lurin et al., 2004; Rivals et al., 2006). In addition, the double alpha-helical structure of the P motif has been proven via protein crystal structure, suggesting the model of recognizing and binding to RNA bases by P motifs (Shen et al., 2016; Yin et al., 2013).
PPR proteins were involved in different biological processes due to their functions of modifying specific RNA. PET309 in yeast was the first PPR gene to determine its function, playing a crucial role in the translation of cytochrome c oxidase 1 (COX1) in mitochondria (Manthey & McEwen, 1995; Manthey et al., 1998). Restorer-of-fertility-likes (RFLs) are the cytoplasmic-male-sterility (CMS) restorers of mitochondria (Bentolila et al., 2002; Dahan & Mireau, 2013). A group of small P subfamily proteins containing a small MutS-related domain was named PPR-SMR, and its absence induces dysfunction in the chloroplast or mitochondria (Liu et al., 2013; Zhang & Lu, 2019). Among these proteins, PLASTID TRANSCRIPTIONALLY ACTIVE CHROMOSOME 2 (pTAC2) affects the activity of plastid-encoded bacterial-type RNA polymerase (PEP), GENOMES UNCOUPLED 1 (GUN1) plays an essential role in the transduction of plastid-to-nucleus retrograde signaling, and both PPR-SMR proteins are involved in chloroplast biogenesis (Koussevitzky et al., 2007; Pfalz et al., 2006; Song et al., 2018; Zhao et al., 2018). While other PPR-SMR proteins, including SUPPRESSOR OF VARIEGATION 7 (SVR7), SUPPRESSOR OF THF 1 (SOT1), and PPR-SMR1, participated in the splicing and maturation processes (L. Wu et al., 2016; Zhou et al., 2017; Zoschke et al., 2012, 2013). The intact DYW domain contains the cytidine deaminase domain with the activity of catalyzing the RNA C-to-U conversion, resulting in the PLS-DYW proteins function in RNA C-to-U editing (Fujii & Small, 2011; Iyer et al., 2011; Oldenkott et al., 2019). The double proteins CHLORORESPIRATORY REDUCTION 4 (CRR4) and DYW1 are involved in the editing of ndhB C2 (Boussardon et al., 2012). The protein ELI1, which participates in the conversion of ndhB C830, has indicated the necessity of PG-box for C-to-U editing (Hayes et al., 2013).
Moreover, the PPR gene family plays important roles in crop storage organ development by affecting plastid and mitochondrial development. Such as the deletion mutation of Dek2 (Defective Kernel 2), Dek35, Emp8 (Empty Pericarp 8), Emp10 and Emp12 in maize will change the expression of nad1 to nad4 in mitochondria, causing delayed development and smaller kernels (Cai et al., 2017; Chen et al., 2017; Qi et al., 2017; Sun et al., 2018, 2019). In addition, the absence of rice PPR genes, FLOURY ENDOSPERM14 (FLO14), will lead to the phenotype of loose starch granules and less total starch content and even affect the quantity and morphology of amyloplast (Xue et al., 2019). As described, PPR genes have great significance for starch crops. However, as one of the most important starch crops, there is little information about potato PPR genes. To further understand the roles of PPR in potato development, we identified the PPR members in the potato genome (DM v3.0) and performed structural, evolutionary, and gene expression analyses of the PPR genes and proteins. These studies should provide insight into the roles that the PPR genes and proteins play in the potato.
. Material and method
. Materials and stress treatments
The potato seedlings were cultured using Murashige & Skoog medium (MS), and GV3101 is the Agrobacterium used in this study. The seedlings in MS medium were transplanted to an artificial climate box under the conditions of 22 °C, 16 hours of light and eight hours of dark, and 2,400 lux light density to domesticate for three weeks. Then the seedlings with similar growth were selected to culture for another week. Preparing 2,000 ml 10% PEG6000 (Solarbio, Code No. P8250) and 150 mmol L−1 sodium chloride (Solarbio, Code No. S8210) to treat seedlings to represent osmotic stress and salt stress, respectively. The leaves were collected at zero hour (before treatment), 6th hour, 12th hour and 24th hour and frozen in liquid nitrogen and stored in a −80 °C refrigerator for RNA extraction. Three biological repeats were applied for each sampling.
. RNA extraction and cDNA synthesis
The RNA was extracted using the TaKaRa MiniBEST Plant RNA Extraction Kit (Takara, Code No. 9769), and DNase I was used for genome DNA removal. Taking 1 µg RNA to reverse transcribed to cDNA using PrimeScriptTM RT reagent Kit (Takara, Code No. 6110B). According to the protocol, we mixed 1 µg RNA, 4 µl 5× PrimeScript Buffer 2.1 µl RT Primer Mix, 1 µl PrimeScript RT Enzyme Mix I and added RNase Free dH2O to a final volume of 20 µl, and incubated on a thermal cycler at 37 °C for 15 minutes and reacted at 85 °C for 5 seconds. The cDNA was added to 200 µl RNase Free dH2O for quantitative real-time PCR (qRT-PCR).
. Quantitative real-time PCR
The primers were designed on the Integrated DNA Technologies (https://sg.idtdna.com/) and synthesized by Sangon Biotech (Table S4) to qRT-PCR. Mix the reagents from GoTaq®; qPCR Master Mix (Promega, Code No. A6,001): 0.5 µl primer F, 0.5 µl primer R, 5 µl GoTaq®; qPCR Master Mix (2×), 2 µl cDNA and add Nuclease-Free Water to a final volume of 10 µl. The mixture was pre-denatured at 95 °C for 2 minutes, then denatured at 95 °C for 15 seconds, renatured and extended at 60 °C for 1 minute, and set for 40 cycles on the QuantStufio 7 Flex system (refer to the kit protocol for details). Taking the gene actin (PGSC0003DMG400003985) as the internal reference gene. The experiments were repeated three times, and expression levels were calculated using the 2−Δ Δ Ct method.
. Identification of StPPR genes
The potato genome sequences and genome annotations were downloaded from the Ensembl plant database (https://plants.ensembl.org/index.html). The candidates are gathered through the HMMER package (Eddy, 2011): (1) the PPR seed “PF01535” (Lurin et al., 2004) downloaded from the PFAM database (Mistry et al., 2021) was exploited to construct the Hidden Markov Model (HMM), and (2) the HMM was used to search for the potato PPR (StPPR) protein sequences from the potato genome with a threshold E-value to −10, to define the StPPR candidates, and (3) we detected the PPR motifs of the candidate sequences using the MAST tools in the MEME-suite (Bailey & Gribskov, 1998), and sequences contained one or no motif were discarded.
The chromosomal localizations and structures (UTR/CDS/introns) of the StPPR genes were visualized by TBtools (Chen et al., 2020). The number of StPPR genes on 12 chromosomes and the number of gene introns were counted to analyze the evolutionary relationships.
. Classification and structure analysis of StPPR protein
The classification of the P subfamily and PLS subfamily was determined from the PPR database (https://ppr.plantenergy.uwa.edu.au/) after uploading the StPPR protein sequences. Referring to the PPR model (Cheng et al., 2016), P-class proteins and PLS-class proteins were aligned in Mega-X (Kumar et al., 2018), respectively, and the potato PPR motifs and domains were analyzed from the alignments. The models were drawn in WebLogo (Crooks et al., 2004). Further, we detected the StPPR proteins using these motifs and domains to analyze the protein tandem structures.
. Construction of phylogenetic tree
Multiple sequence alignments were generated using the MUSCLE method. The StPPR sequences and 23 PPR sequences from Arabidopsis, rice, and maize. The phylogenetic tree was constructed by the neighbor-joining (NJ) method using MEGA-X with a bootstrap analysis of 1,000 replicates. The tree was decorated in EVOLVIEW (Subramanian et al., 2019).
. Gene expression analysis
The potato (DM1-3 516 R44 and RH89-039-16) gene expression data was downloaded (Diambra, 2011) and the FPKM-value was used to represent the gene expression level. The data matrix, including eight different tissues, was selected to construct heatmaps to determine the expression pattern of StPPR genes. The salt treatments and mannitol treatments data matrix were selected to analyze the response of StPPR genes to abiotic stress. All heatmaps were drawn using MultiExperiment Viewer 4.9 (MeV) (Saeed et al., 2003).
. Subcellular localization
Predotar 1.04 (Small et al., 2004) was used to predict the subcellular localization of StPPR. For subcellular localization validation experiments, the full-length CDS without stop codon was amplified and inserted in front of the green fluorescence protein codon sequence under the control of the CaMV 35S promoter of the pCambia1300-GFP vector and then transformed into Agrobacterium (GV3101). Tobaccos (Nicotiana tabacum) were injected with Agrobacterium, and the green fluorescence of PPR-GFP proteins was visualized with a confocal laser scanning microscope (OLYMPVS FV3000) with excitation wavelengths at 488 nm and emission wavelengths at 509 nm to determine the subcellular localization of two proteins.
. Results
. Identification and classification of StPPR members
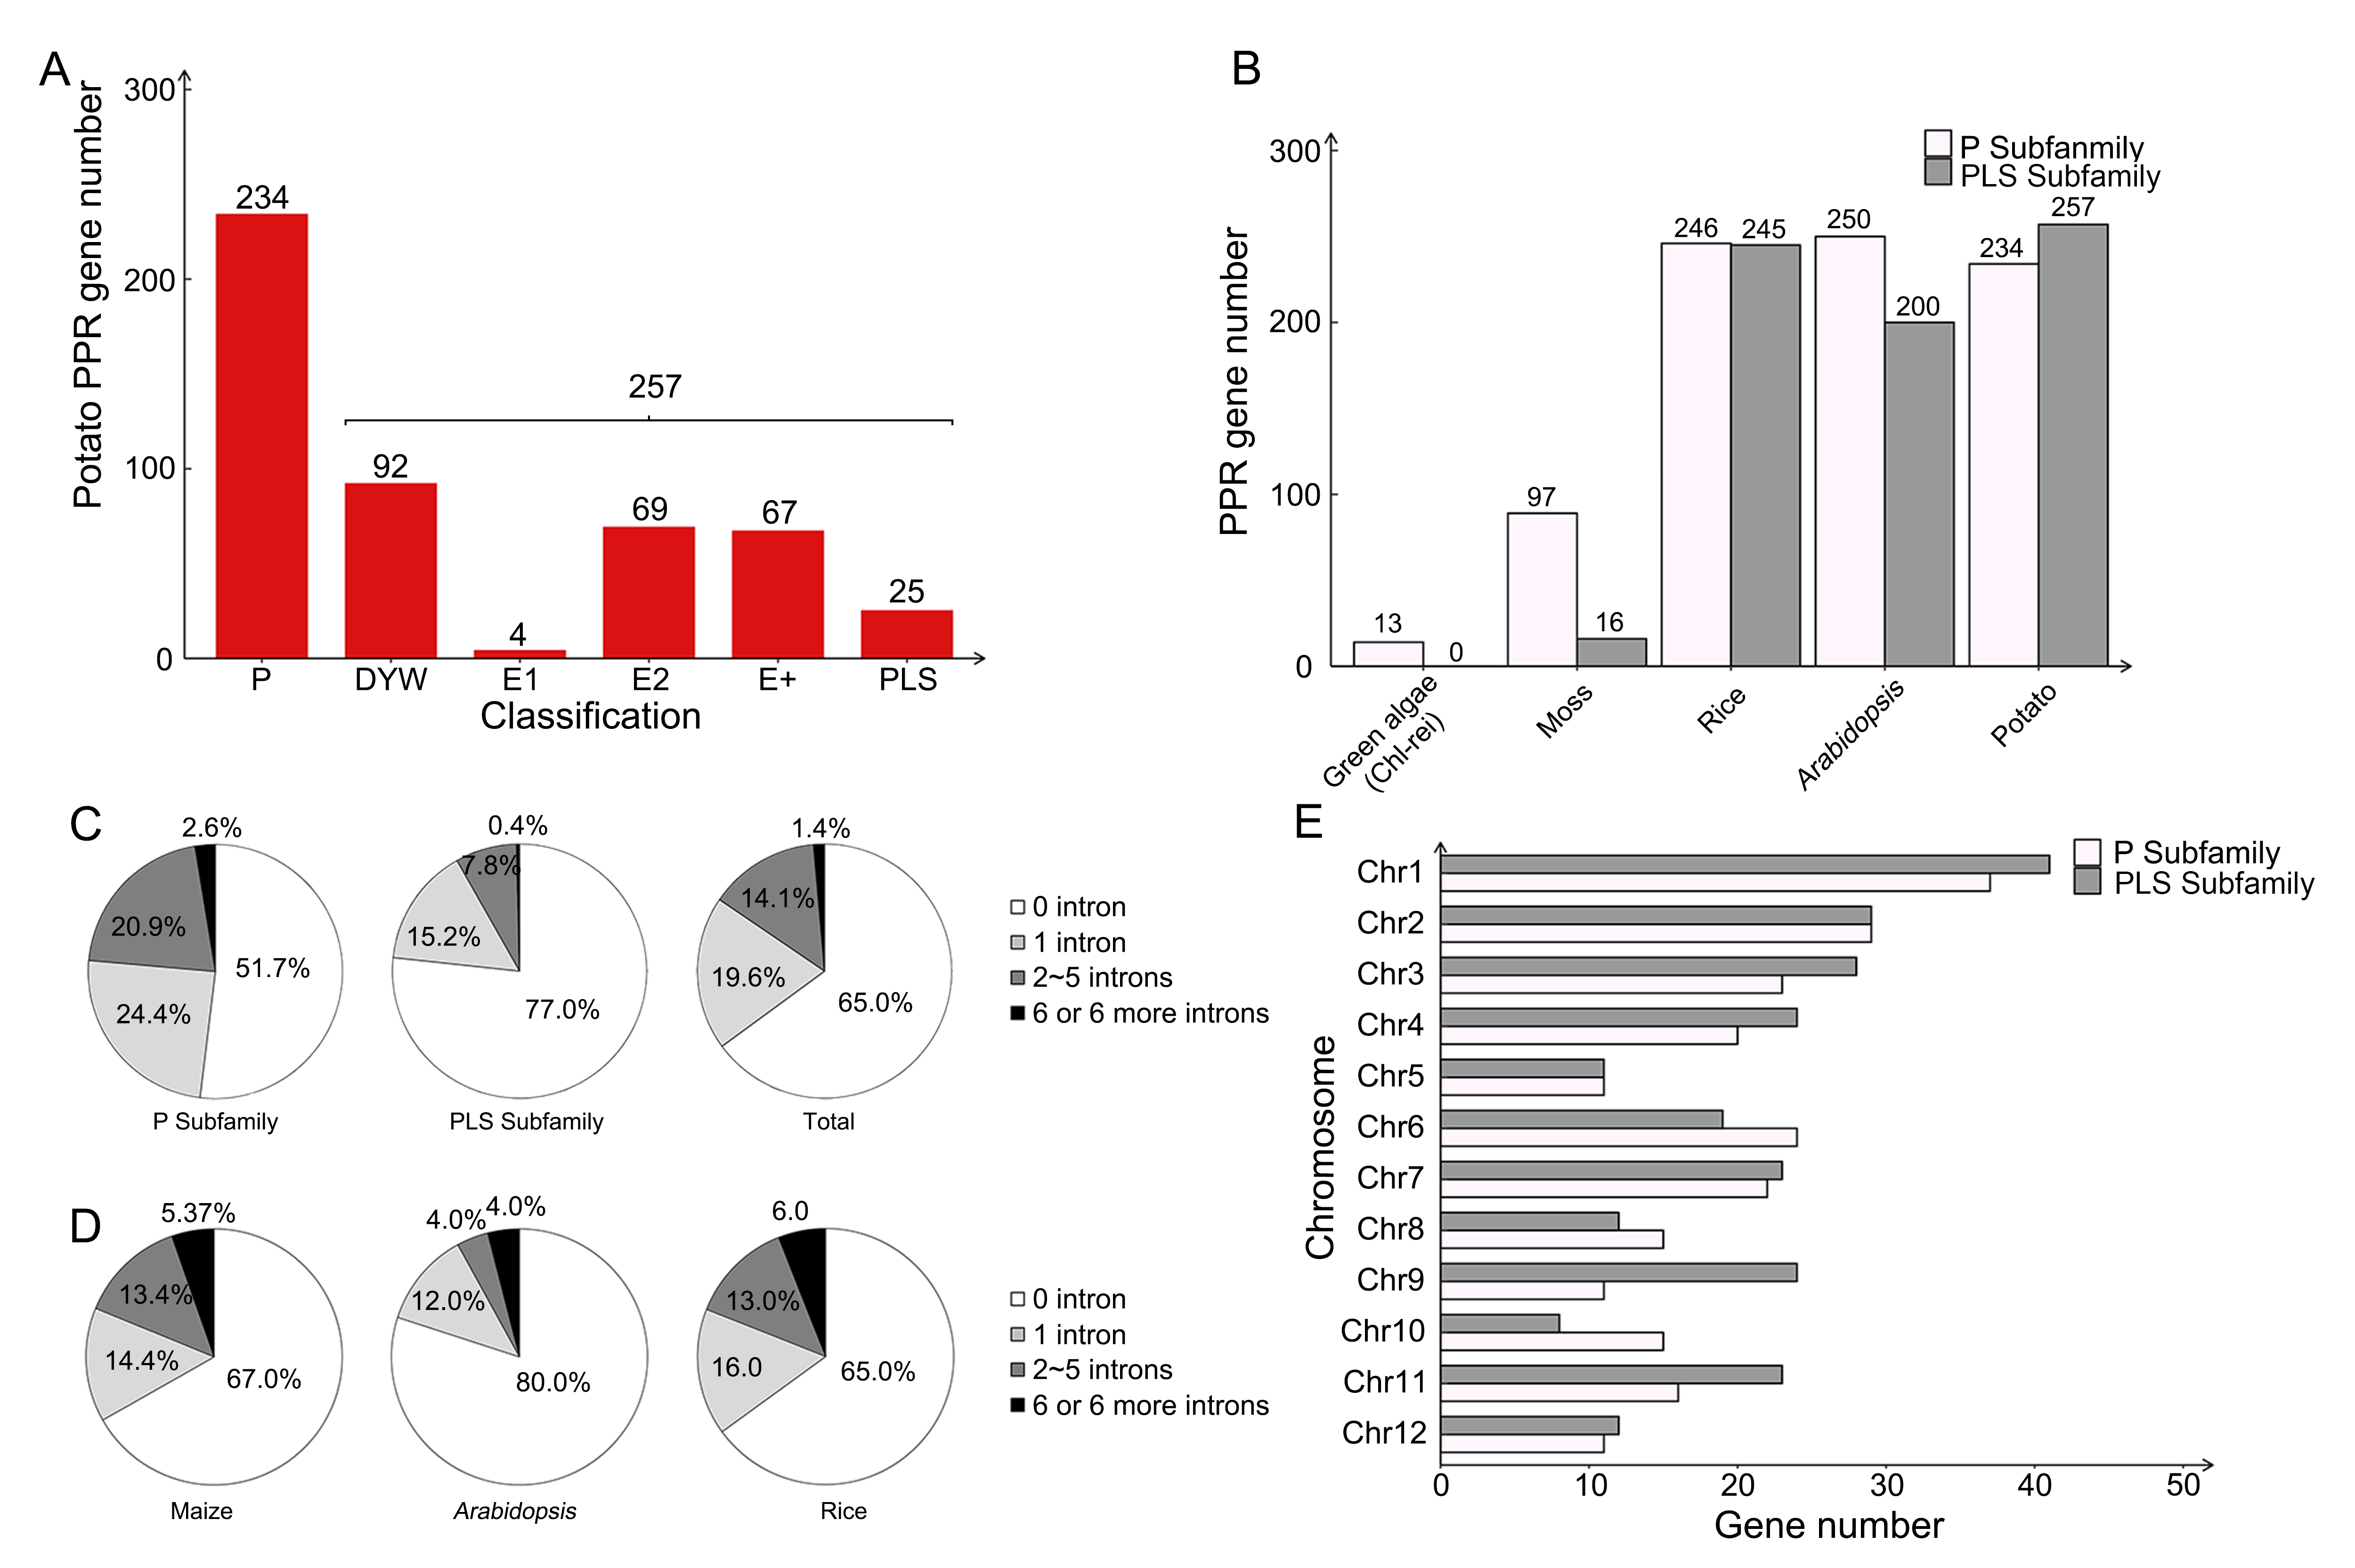
There were 491 sequences predicted as StPPR proteins, divided into 257 PLS subfamily members and 234 P subfamily members (Figure 1A; Table S1). We further grouped the PLS subfamily based on the C-terminal domains, which were key to the function of PLS proteins, and 92 proteins ended in DYW domains, 67 proteins ended in E+ domains, and 73 proteins ended in the E1 (4 members) or E2 (69 members) motifs in PLS subfamily. The StPPR number is similar to that of Arabidopsis, rice, and maize, and lower plants have fewer PPR members with a larger proportion of P-class genes, even though none of the PLS members existed in algae (Figure 1B). In addition, we further screened seven potato PPR-SMR proteins and constructed a Maximum Likelihood (ML) tree, in which every three proteins from other species, including maize, Arabidopsis, and potato, formed a small clade indicating their homology relationships (Table S2, Figure S1).
Figure 1
StPPR genes and other PPRs basic information. (A) StPPR numbers of P subfamily and PLS subfamily; (B) PPR gene numbers of two subfamilies in green algae (Chl-re: Chlamydomonas reinhardtii), moss, rice, Arabidopsis and potato; (C) Intron numbers of StPPR genes: P subfamily, PLS subfamily and total; (D) Intron numbers of maize, Arabidopsis and rice; (E) Numbers of StPPR gene on 12 chromosomes. All bar charts were drawn in OriginPro 8.5 and pie charts were drawn in Excel 2016.
. Protein structure analysis
We determined the conserved primary sequences of StPPR motifs and domains in WebLogo (Crooks et al., 2004). The results are displayed in Figure 2B, which has the typical feature that the 15th position of each motif prefers glycine (G) in the 10 motifs (P, P1, P2, L1, L2, S1, S2, SS, E1 and E2 motifs). Five motifs (P, P1, P2, S1 and SS motifs) were almost always occupied by the polar amino acid asparagine (N), threonine (T) and serine (S) in the 5th positions, and eight motifs (P, P1, P2, S1, SS, L1, S2 and E1 motifs) end with asparagine (N) or aspartic (D). We have also described the PLS-terminal domain, including the E+ domain (40 amino acids) that starts with a “PG box” and the DYW domain (93 amino acids) that contains a “HxEx(n)CxxC” structure in the middle. Both “PG-box” and “HxEx(n)CxxC” structures play key roles in the C-to-U editing (Hayes et al., 2013; Kotera et al., 2005). In addition, the DYW domains contain a highly conserved end structure, the “HHx(n)DYW” motif.
Figure 2
StPPR protein structural models. (A) Typical tandem array of PPR proteins. The figures were drawn using PowerPoint, and more tandem arrays were listed in Table S1; (B) Conserved amino acid sequences of PPR motifs. The highlighted amino acids (green) may be the key to protein folding and binding RNA bases. The E+ domain contains a PG box and DYW has a cytidine deaminase motif, “HxEx(n)CxxC”.
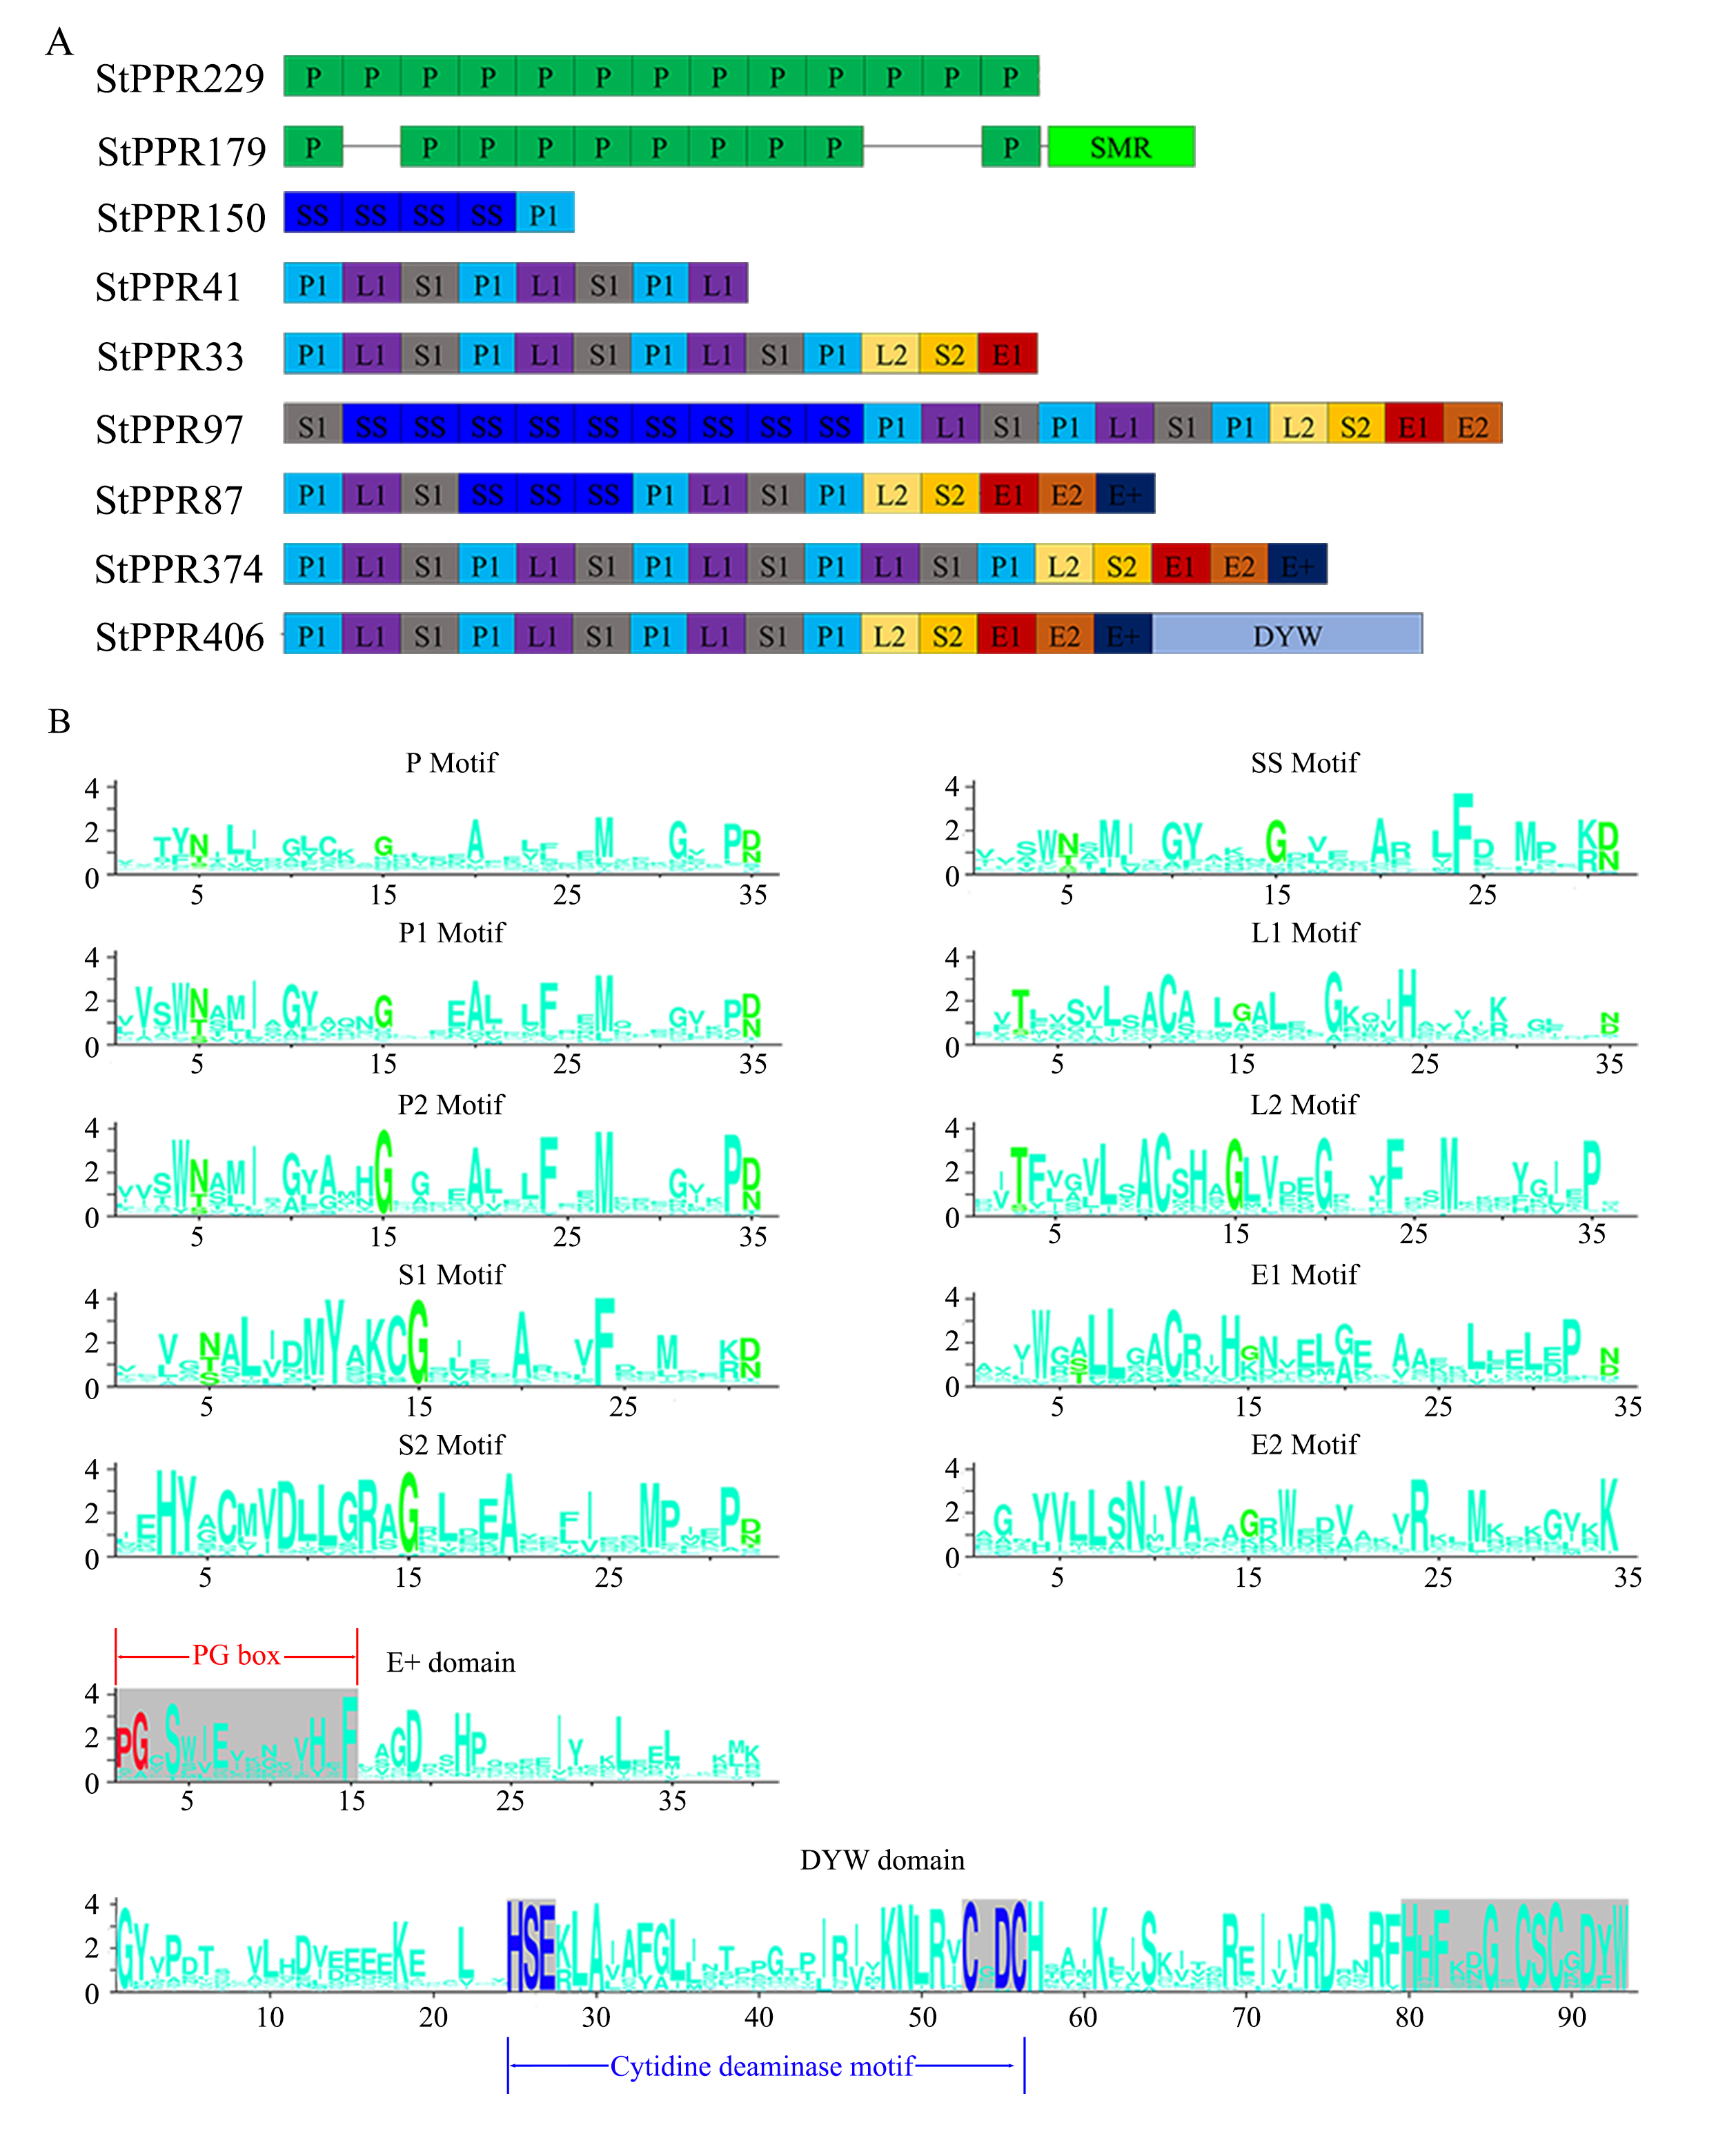
The PPR database and the MEME-suite website were utilized to analyze the StPPR motif structures. We found that 90.4% (444/491) of StPPR proteins contain two to 20 motifs, and the two P-class proteins (27 P motifs) have the largest number of motifs (Table S1). Most P-class proteins consist of classical P motifs (e.g., StPPR229) (Figure 2A). We cannot detect the P2 motif that is led by the high similarity of P1 and P2 sequences (Cheng et al., 2016). Most PLS-class proteins demonstrate P1-L1-S1 and P1-L2-S2 structural arrangements (e.g., StPPR374 and StPPR406), and E1-E2 usually present as twins appear at the end of the P1-L2-S2 arrangement (Figure 2A). The SS motif appears in two positions in PLS proteins: multiple SS form tandem sequences in the N-terminus, such as StPPR97 and StPPR150, or as the connecting node of two P1-L1-S1 arrangements like protein StPPR87 (Figure 2A).
. RFL genes loci and PPR gene evolution analysis
The phylogenetic tree of 491 StPPR proteins and 22 proteins from other species constructed by the neighbor-joining method displayed two large branches corresponding to the P subfamily and PLS subfamily (Figure 3A), showing the significant differences in protein sequences between the two subfamilies. There are three PLS-class proteins clustering to the P subfamily branch. Noteworthy, we found that the Arabidopsis protein RNA PROCESSING FACTOR 1 (RPF1, AT1G12700, Figure 3A, in light-blue font) (Hölzle et al., 2011) is clustering with 13 potato P-class proteins with the length in a range of 459 amino acids to 610 amino acids with 11 to 15 P motifs, and we speculated the branch as RFL protein clade.
Figure 3
Phylogenetic tree and gene on chromosome. (A) Phylogenetic tree constructed by Neighbor-Joining method with Jones–Taylor–Thornton model and set 1,000 bootstrap replications in MEGA-X. And decorating the tree on the EVOLVIEW, the proteins in light-blue font were predicted RFL clade; (B) Distribution of StPPR genes on 12 chromosomes analyzed using TBtools. A total of 488 StPPR genes are distributed on 12 chromosomes of the potato, and the P-class gene loci with a blue background on chromosome 6 were the putative RFL gene clusters.
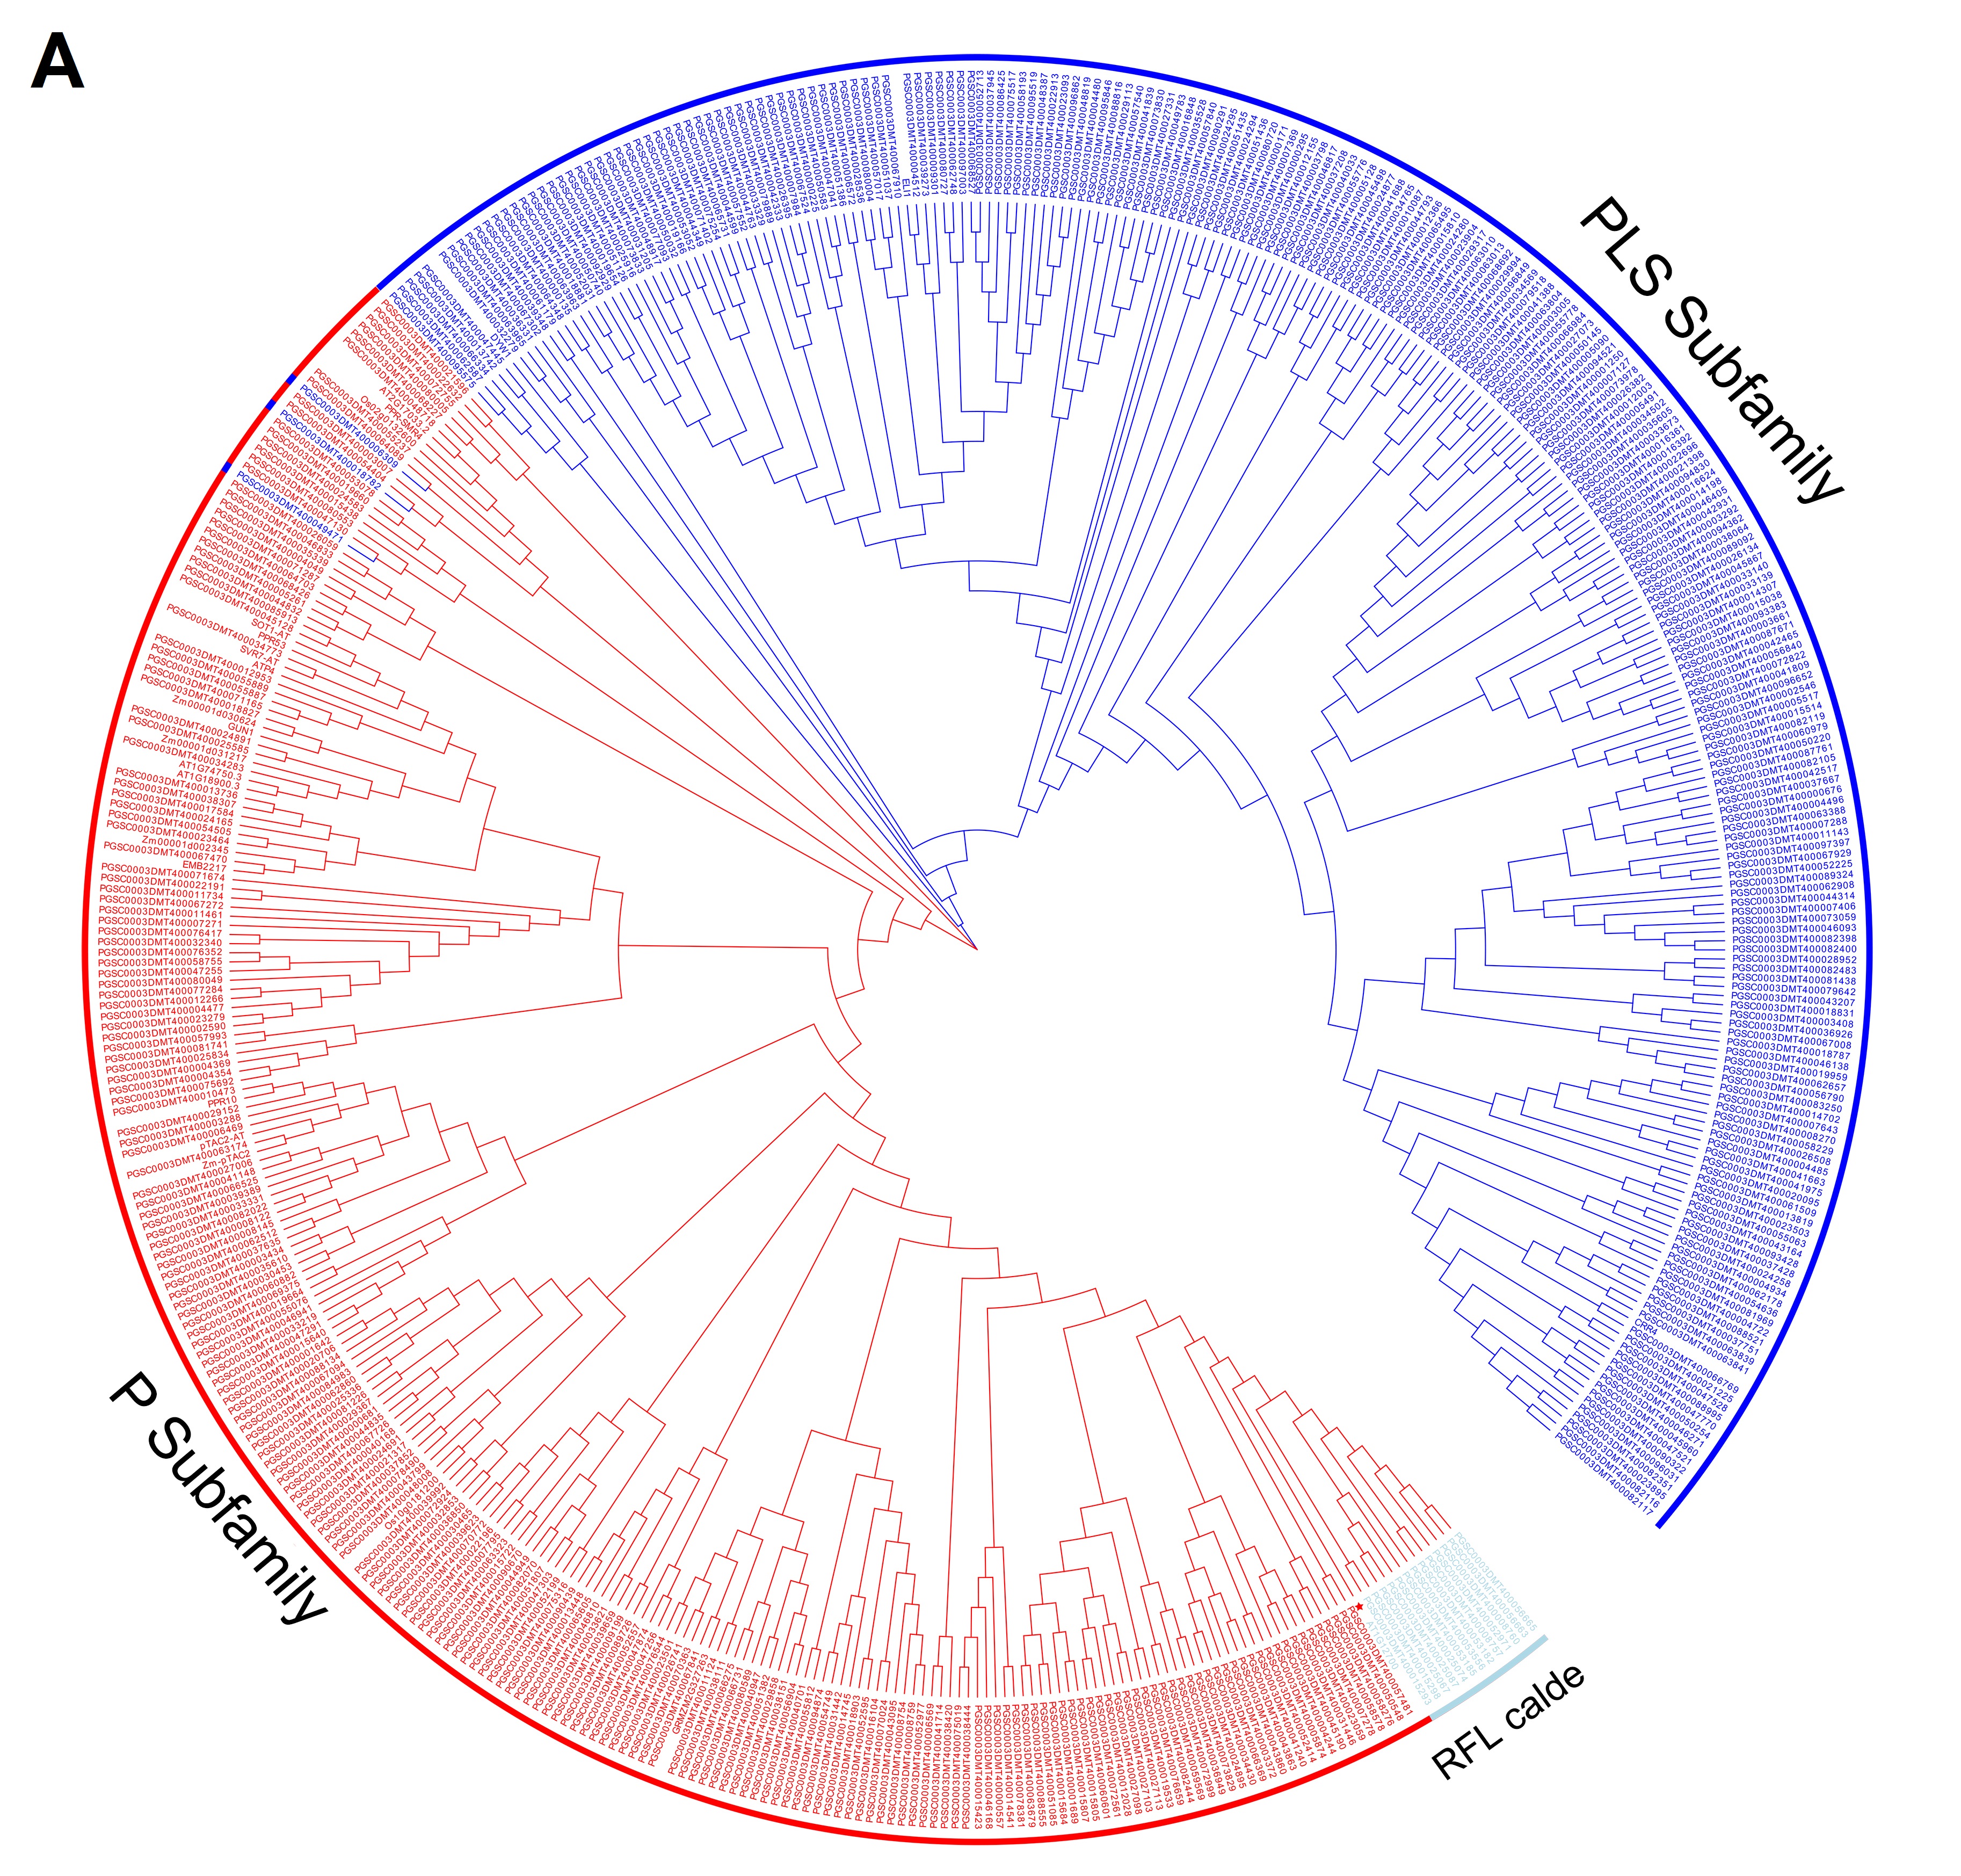
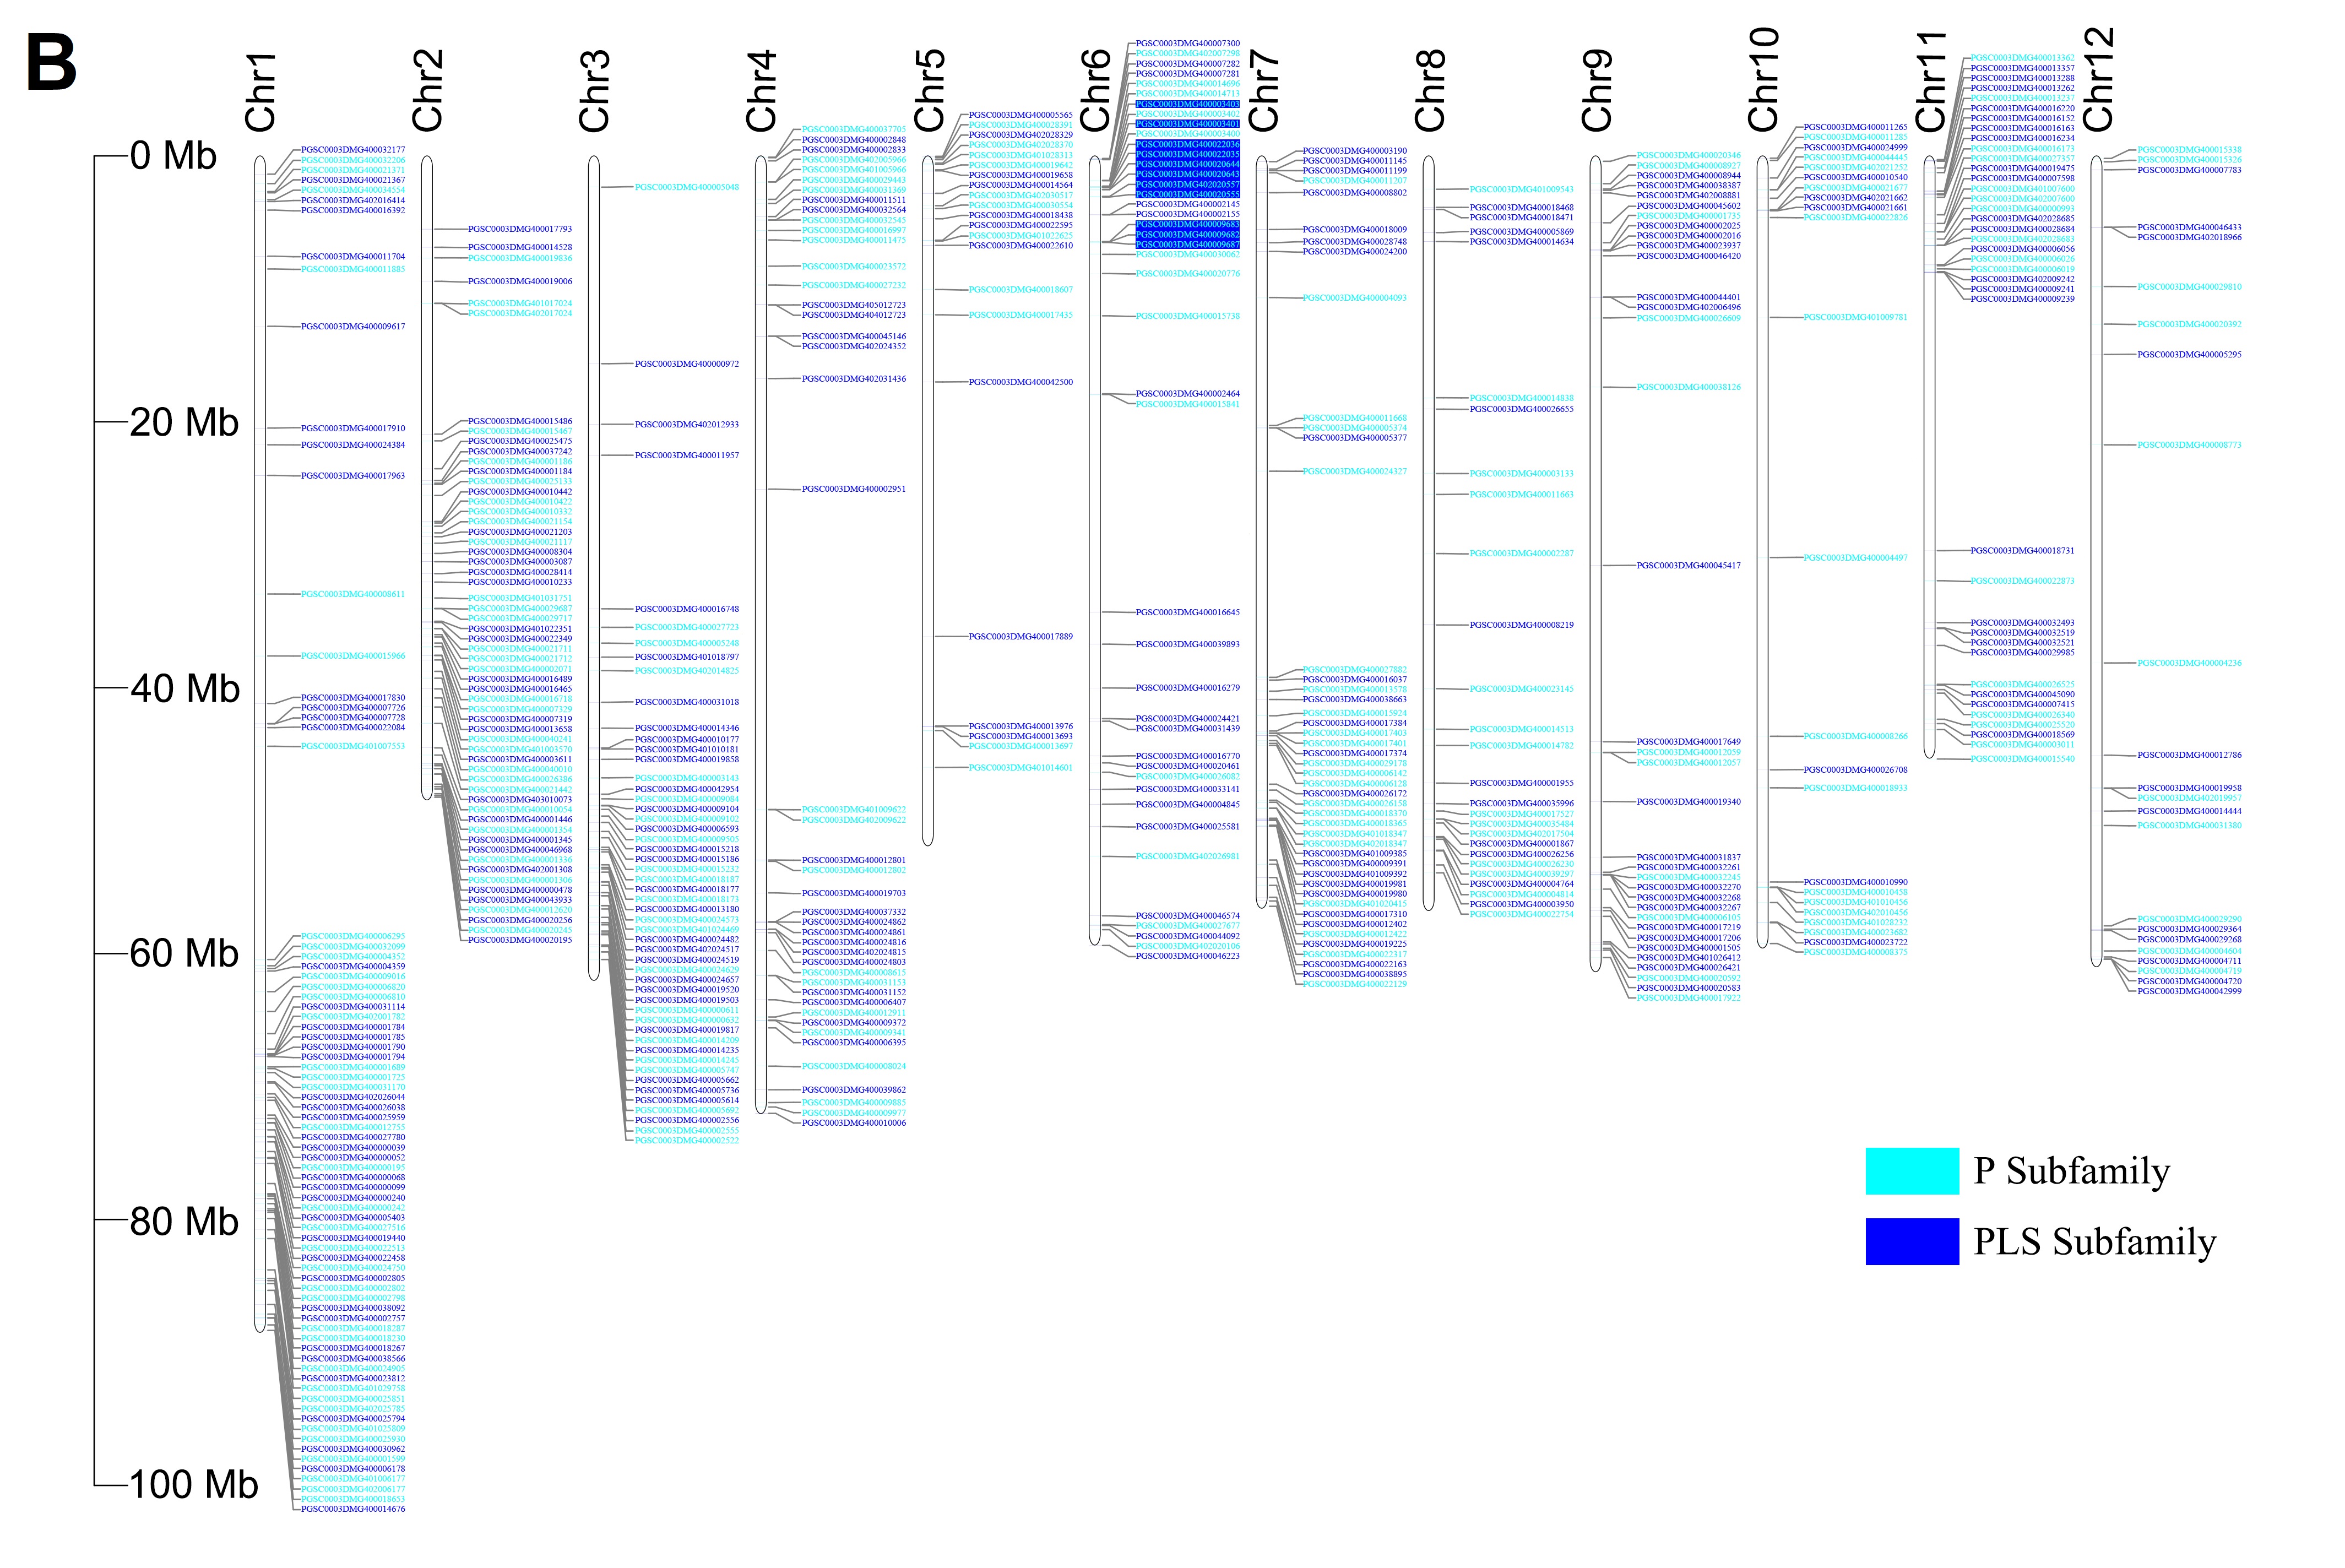
The analysis shows that the 488 StPPR genes are distributed on all 12 chromosomes of the potato genome (Figure 1E, Figure 3B). Chromosome 1 has the largest number of StPPR genes with 78 (37 P-class and 41 PLS-class) StPPR genes, while chromosome 5 has the least, which contains 22 (11 P-class and 11 PLS-class) StPPR genes. Surprisingly, we found gene clusters composed of 13 P-class genes on chromosome 6 and surmised them to be the potato RFL loci (Figure 3B, in blue background). To verify this speculation, we screened for potato RFL genes in the whole genome by Rf-PPR592, the petunia (Petunia hybrid) gene (Bentolila et al., 2002), setting a threshold E-value to −100 (Fujii et al., 2011). As a result, 16 potato RFL genes were identified, 11 genes of which were located in the gene clusters on chromosome 6 (Figure 3B), 12 proteins of which were clustered on the putative RFL clade in this study (Figure 3A). These results indicated that the RFL loci of potato located on chromosome 6, and their proteins cluster on the RFL clade.
The gene structures were determined using TBtools (Figure S2). We found that 84.5% (415/491) of StPPR genes have one or no intron, while only 1.4% (7/491) have six or more introns (Figure 1C), with similar numbers in maize and rice (Figure 1D), especially in Arabidopsis, where 92% of PPR genes contain one or none of the introns. Interestingly, the introns of two subfamilies show that 76.1% (178/234) P-class and 92.2% (237/257) PLS-class genes have one or no introns. To confirm whether more introns are contained in P-class genes than PLS-class genes, we downloaded and analyzed the intron numbers of PPR genes in Arabidopsis, tomato, maize, rice, foxtail millet (Setaria italica) (Liu et al., 2016), watermelon (Citrullus lanatus) (Subburaj et al., 2020), poplar (Populus trichocarpa) (Xing et al., 2018), tea plant (Camellia sinensis) (Zhang et al., 2022), moss (Physcomitrium patens) and two algae (Chlamydomonas reinhardtii and Volvox carteri). Compared to P-class genes, PLS-class genes have more members with one or no introns in all higher plants on this list (Figure S3). Although there are only 16 PLS-class genes in moss, none have six or more introns, while 42.3% (41/97) P-class members belong to intron-rich PPR genes (six or more introns). As for the algae, two species have 13 and 11 P-class genes in Chlamydomonas reinhardtii and Volvox carteri, respectively, and almost all these genes belong to intron-rich PPRs (Figure S3). In summary, the intron-rich PPR genes are more likely to be a P subfamily member but not the PLS.
. StPPR gene expression analysis
The potato public transcriptome data were downloaded to analyze tissue expression and stress-induced patterns of StPPR genes, and all heatmaps were created using the MeV 4.9 package. As a result, 462 StPPR genes were expressed in eight tissues with a feature of low expression levels and nonspecific expression, and more genes were expressed in meristematic organs while less in mature organization (Figure S4). We screened 79 StPPR genes up-regulated (above 2-fold) in abiotic stress in this study. Respectively, 46 genes were up-regulated under the salt treatment, 38 genes were up-regulated under the mannitol treatment and 20 genes responded to both salt treatment and mannitol treatment (Figure 4A).
Figure 4
Heatmaps of PPR gene expression in abiotic stress and qRT-PCR results. (A) Heatmap of StPPR genes up-regulated (above 2-fold) under salt stress and osmotic stress was drawn by MeV 4.9 package; (B–C) The expression level of gene StPPR371, StPPR219, StPPR113 and StPPR388 under150 mmol L−1 NaCl treatment (b) and 10% PEG6000 treatment (c), respectively. All bar charts were drawn in OriginPro 8.5.
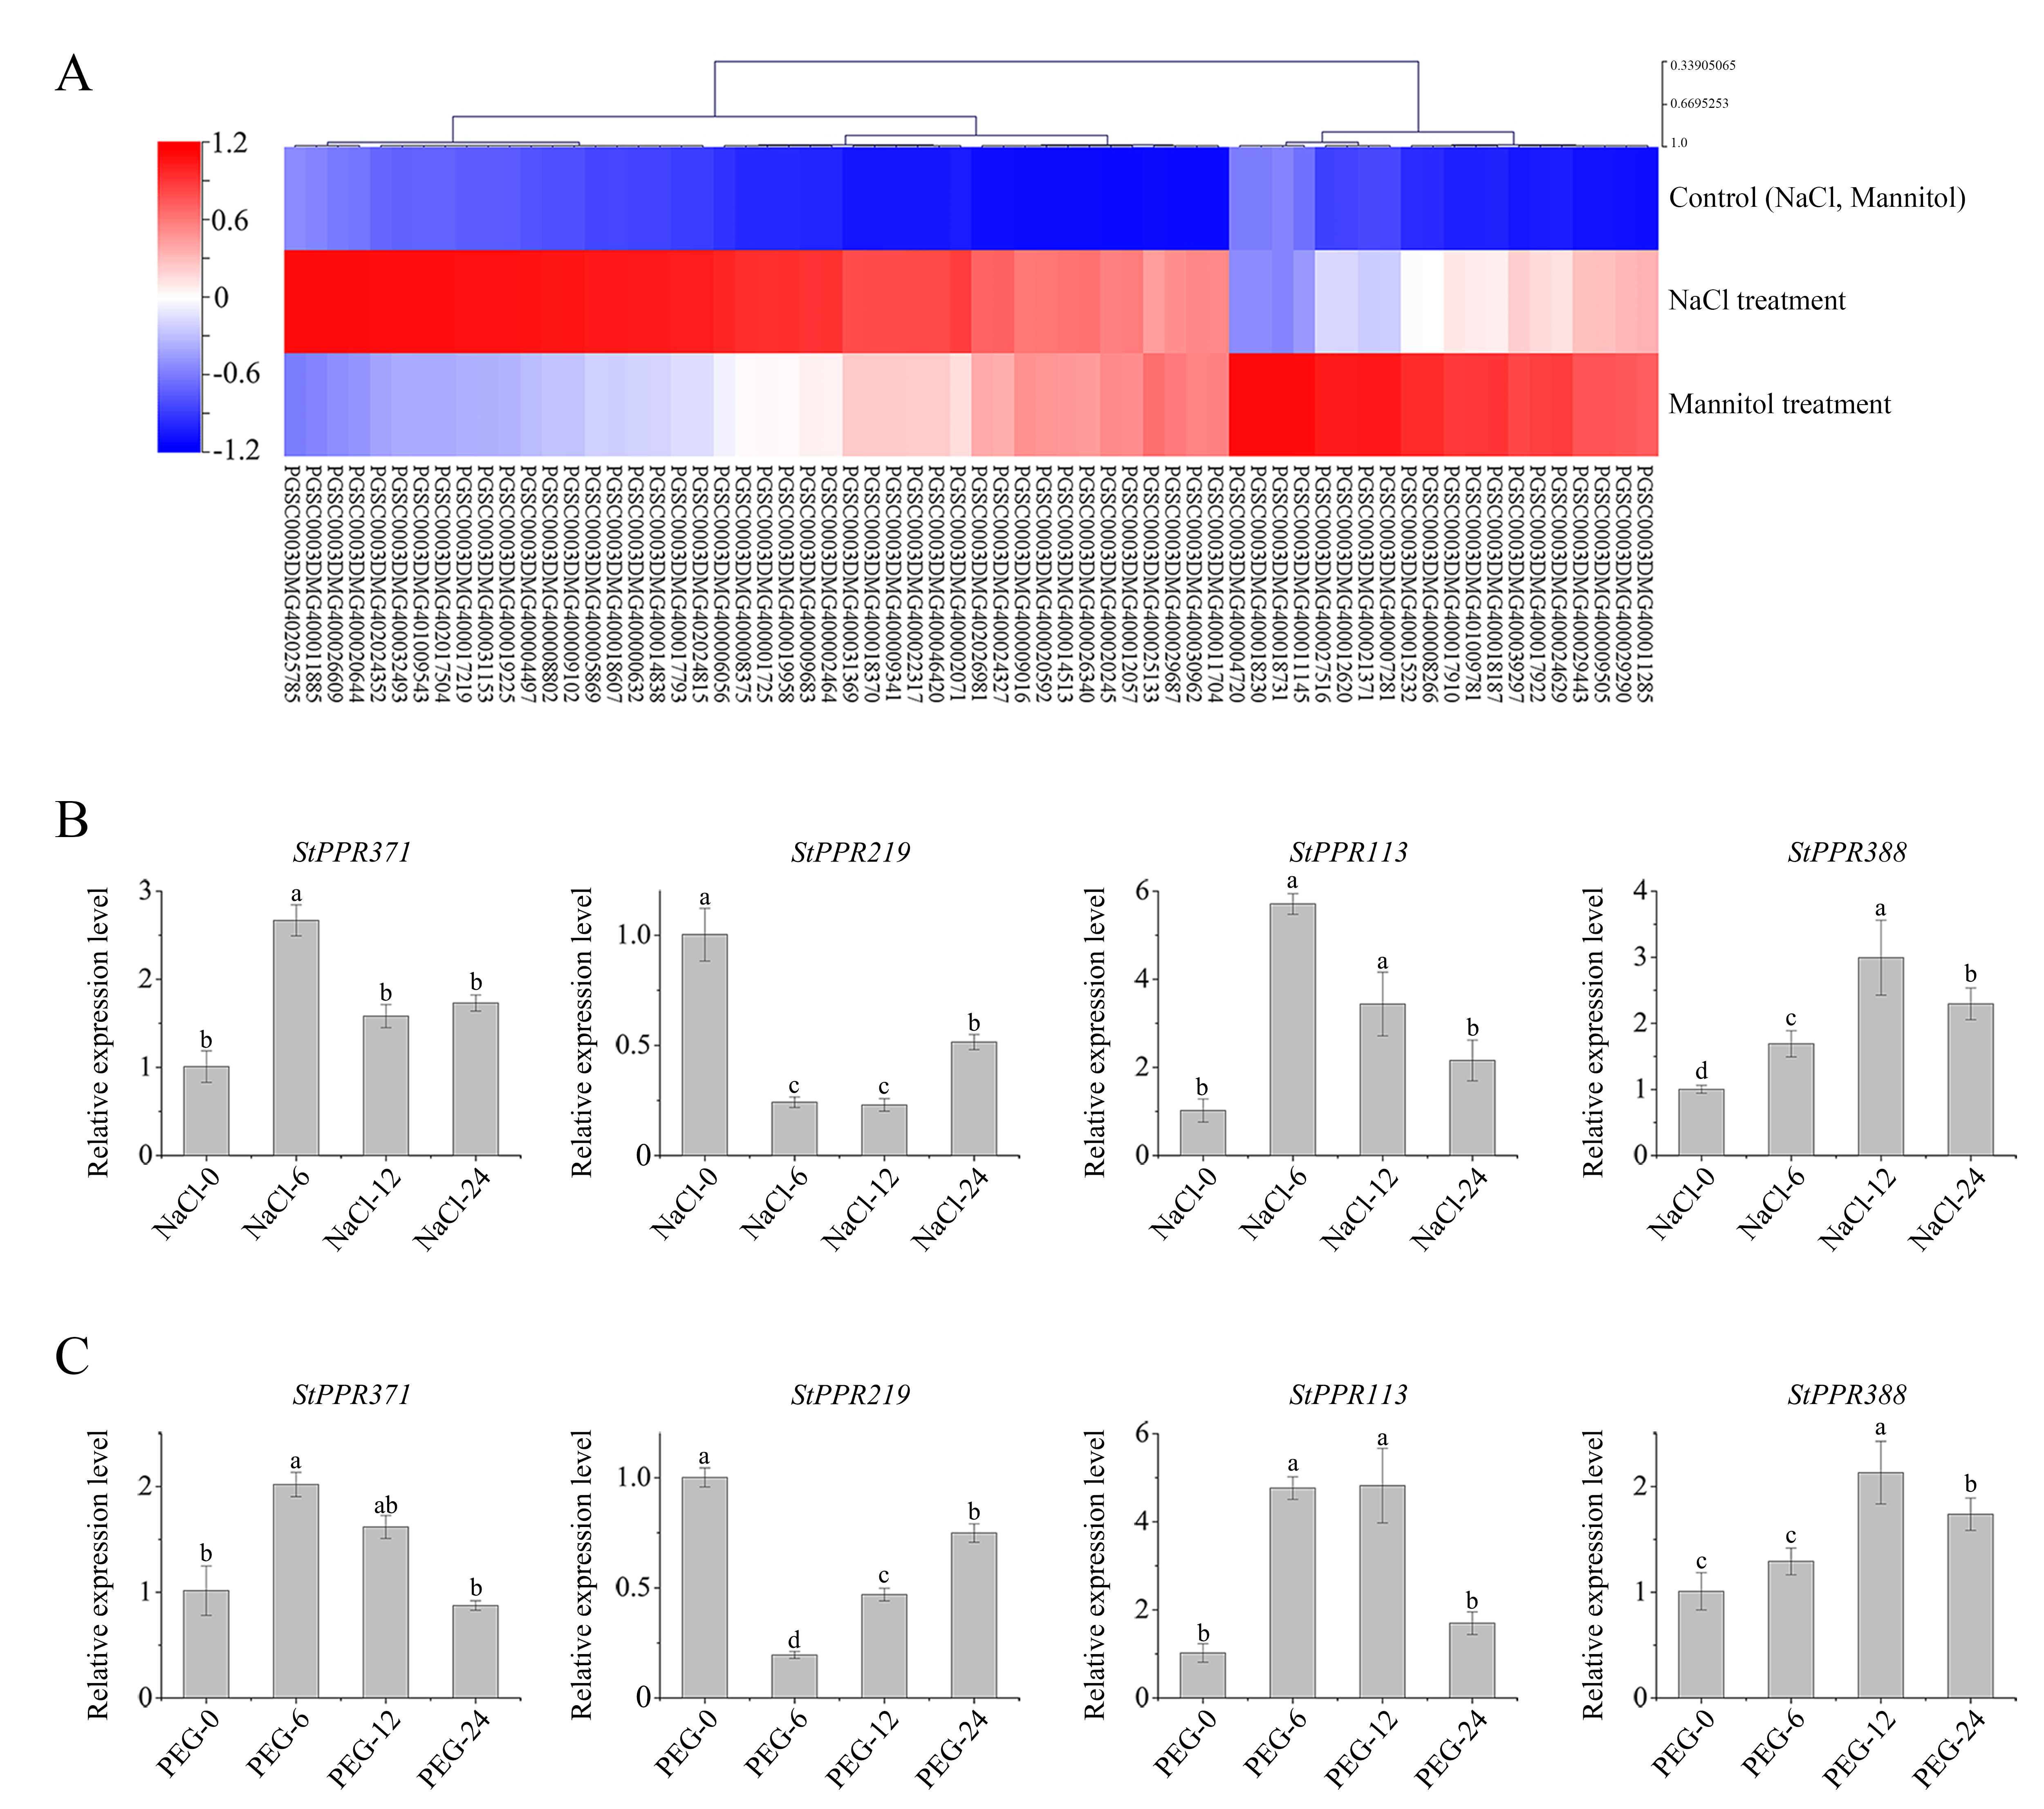
To verify the stress-induced expression of StPPR genes, we designed osmotic stress and salt stress experiments to detect four StPPR genes via qRT-PCR. Gene StPPR371 and StPPR113 were significantly up-regulated at 6 hours after 10% PEG6000 or 150 mmol L−1 Sodium chloride treatments, and returned at 24 hours (Figure 4B–C). Gene StPPR388 was induced to top expression level at 12 hours after both treatments. While, in contrast to the transcriptome, gene StPPR219 was down-regulated at 6 hours after treatments then increased slowly. Overall, these StPPR genes are involved in the abiotic stress.
. Subcellular localization
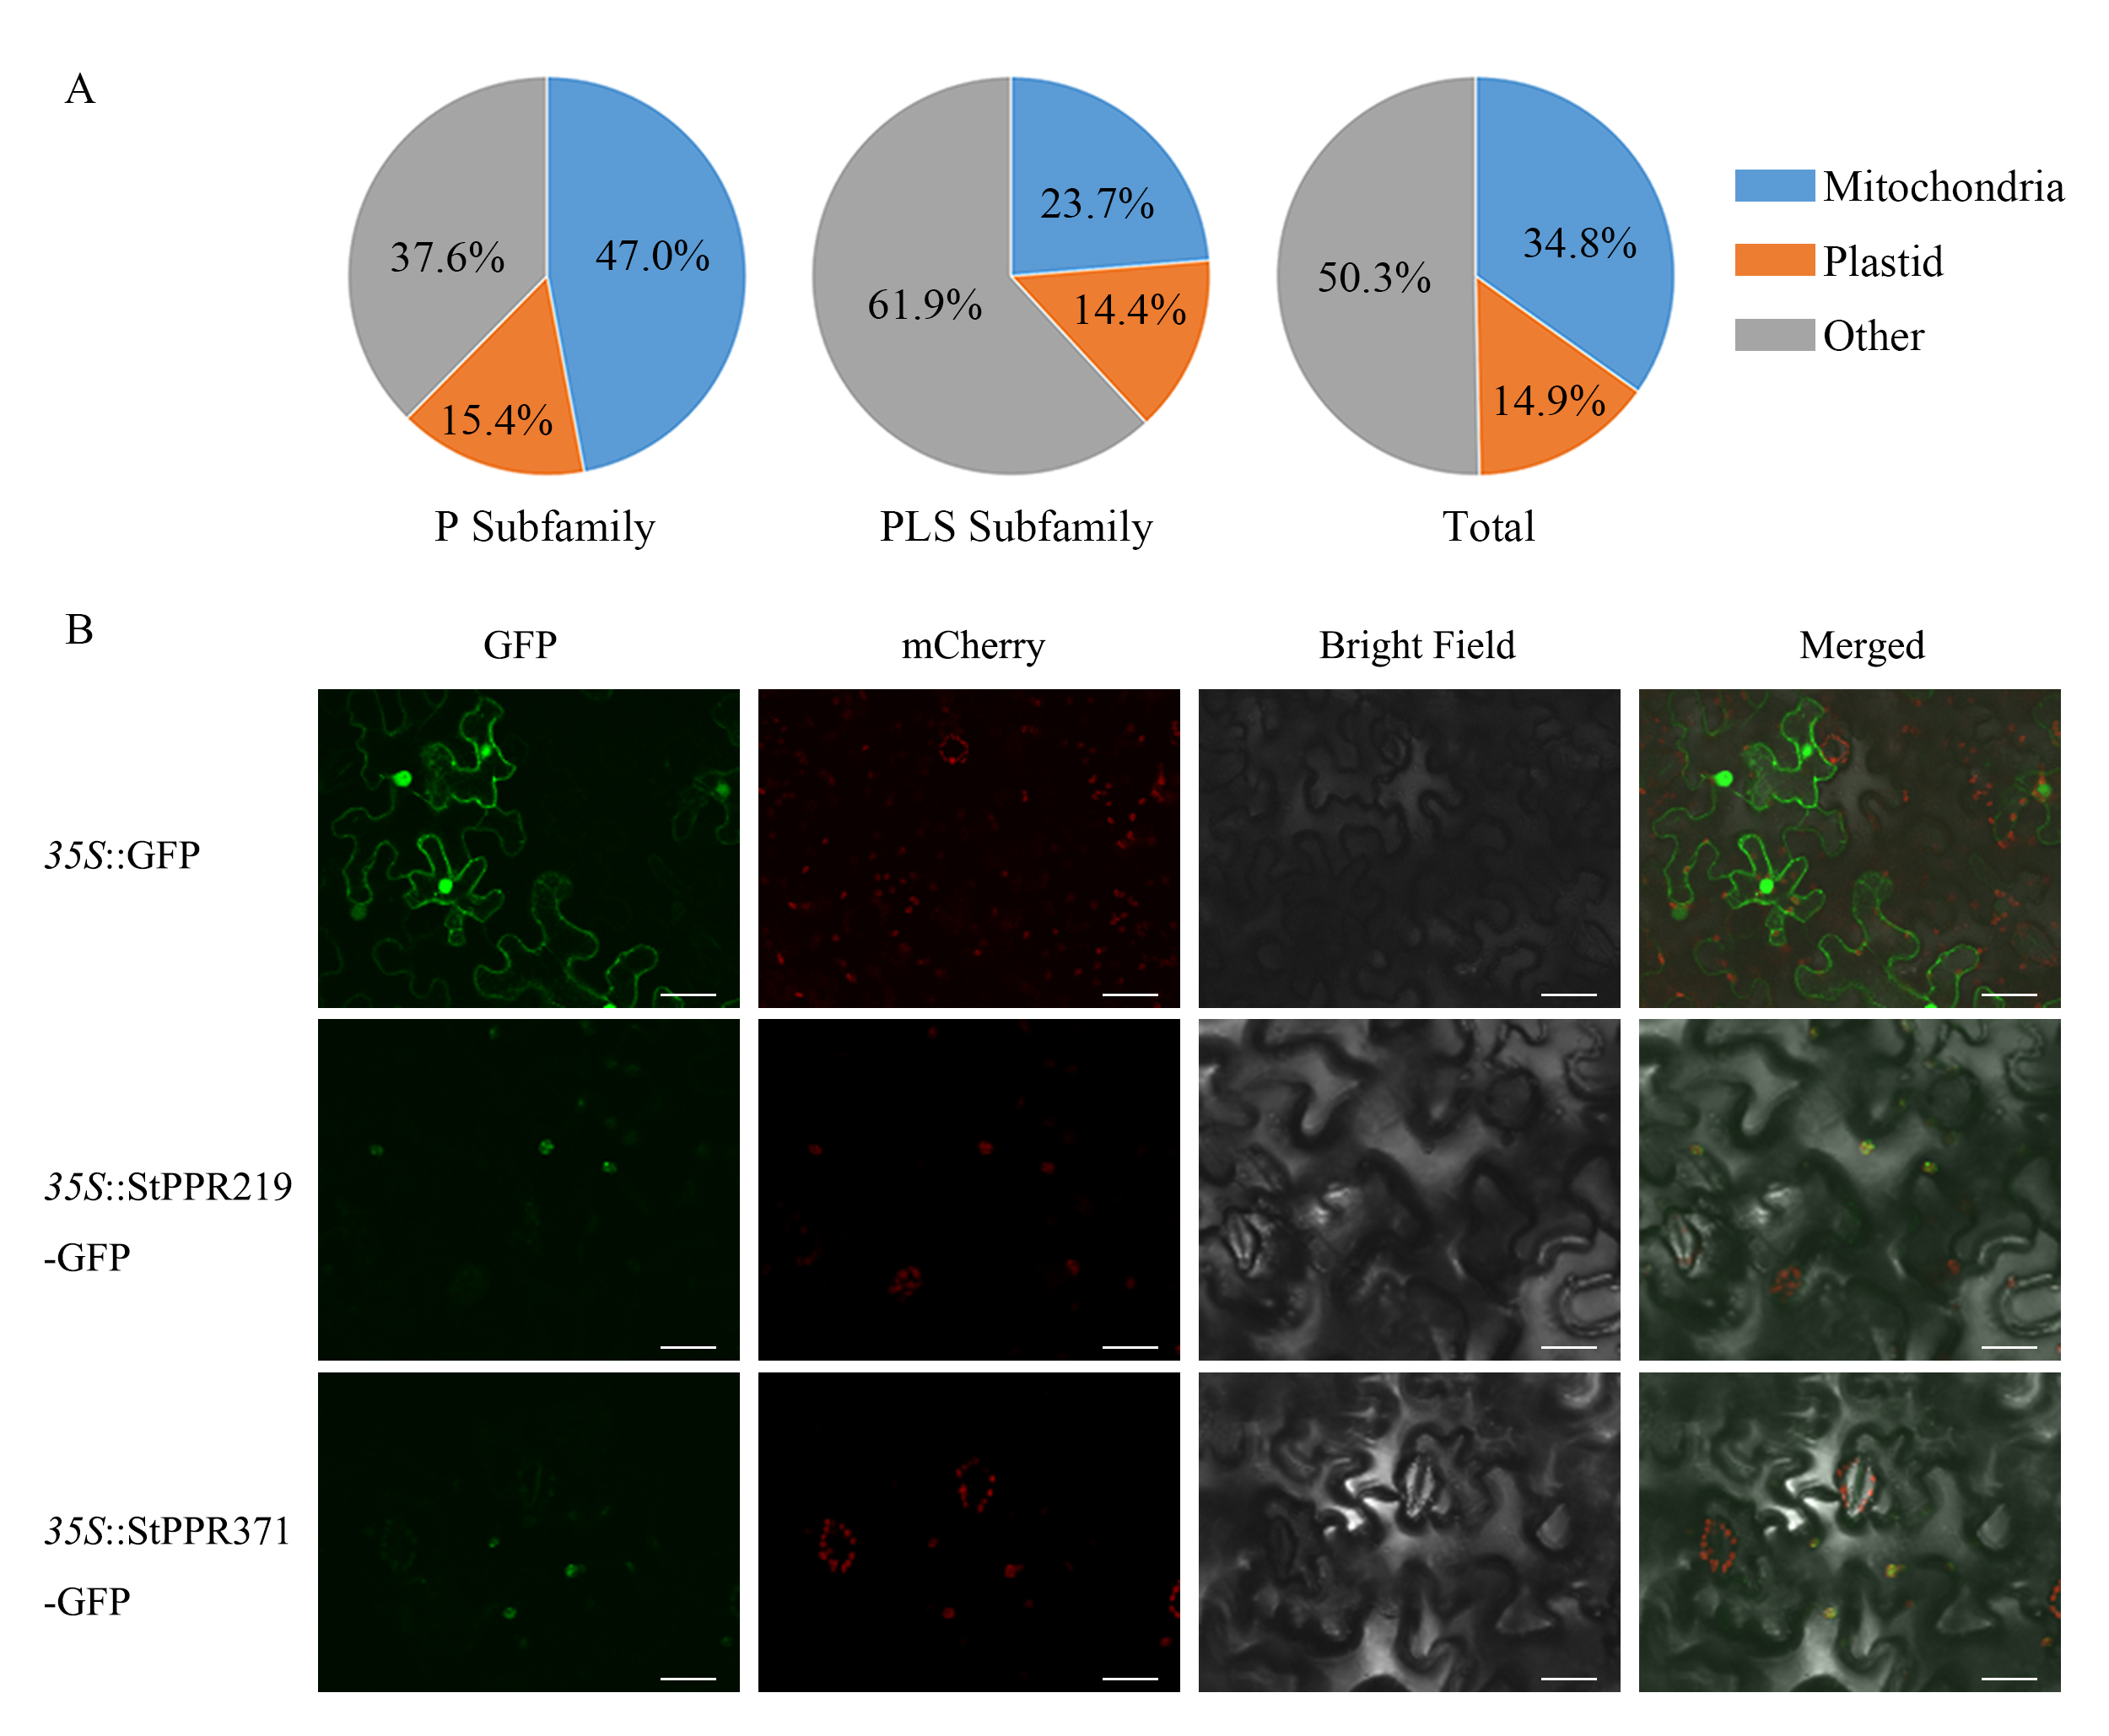
PPR proteins function in mitochondria or plastids. In this study, the results show that approximately half of StPPR proteins target mitochondria or plastids, with 62.4% of P-class proteins targeting mitochondria or plastids and only 38.1% of PLS-class (Figure 5A, Table S3). Moreover, we investigated the subcellular localization of StPPR219 and StPPR371 in tobacco using a green fluorescent protein (GFP) fusion expressed under the CaMV 35S promoter. Both fusion proteins were localized in the chloroplasts (Figure 5B) using Laser Scanning Confocal Microscopy (OLYMPVS FV3000), what wasconsistent with the result predicted by Predotar 1.04.
Figure 5
Subcellular localization of StPPR proteins. (A) Prediction of the subcellular localization by Predotar 1.04, and the pie charts were drawn in Excel 2016; (B) Two fusion proteins, StPPR219-GFP and StPPR371-GFP, were verified to localize to chloroplast via Confocal scanning microscopy. The GFP was used to scan the green fluorescent and mChery was used to the auto-fluorescence of chloroplast. The scale bar represents 40 µm.
. Discussion
In this study, we identified 491 StPPR members in the potato genome, incorporating 234 P subfamily members and 257 PLS subfamily members. Based on the research of PPR10 protein crystals, the polar conserved amino acids at the 5th and 35th positions of the five motifs (Figure 2B) suggest that their likely functions are recognizing and binding RNA bases (Shen et al., 2016; Yin et al., 2013). It is a clear result that P-class proteins and PLS-class proteins are divided into two branches (Figure 3A), implying a significant difference between the two subfamilies in sequence (Cheng et al., 2016). The tandem repeated P motif confers the function of P-class proteins to modify the RNA of mitochondria and plastids, while the conserved tandem, “(P1-L1-S1)n-P2-L2-S2” (Figure 2A), seems to enable the PLS protein to play a specific function in RNA C-to-U editing (Barkan & Small, 2014; Kwok van der Giezen et al., 2023).
There are 488 StPPR genes distributed on 12 potato chromosomes, and the majority of the StPPR members in terrestrial plants contain one or no intron, especially 92% of PPR genes in Arabidopsis (Lurin et al., 2004) and 84.5% of the StPPR genes in potato in this study (Figure 1C–D), implying that the expansion of the PPR gene family originated from the generation of retrotransposition, and few intron-rich PPR genes are defined as “ancestors” (O’Toole et al., 2008). while the result that higher plants have more PPR genes than lower plants further supports the expansion hypothesis of PPR in the process of species evolution (Fujii & Small, 2011; O’Toole et al., 2008).
Cytoplasmic male sterility, which is widespread in the genome of flowering plants, is generated by the interaction of the mitochondrial and nuclear genomes, resulting in the production of abnormal pollen in plants, and RFL genes will rescue this sterility (Chase, 2007). In this study, we scanned 16 putative potato RFL genes, which corresponded to the P-class gene clusters on chromosome 6 and the small RFL protein branch on the NJ tree. RFL genes are clustered into clusters in rice (Akagi et al., 2004), petunia (Bentolila et al., 2002), radish (Bentolila et al., 2002; Brown et al., 2003), and Arabidopsis (Geddy & Brown, 2007), and show a high level of sequence homology. The putative potato RFL genes identified in this study also have these properties. However, their function in potato CMS-RF system needs further study.
Some PPR genes respond to abiotic stress. The Arabidopsis PPR genes, SLOW GROWTH 2 (SLO2) and PENTATRICOPEPTIDE REPEAT PROTEIN FOR GERMINATION ON NaCl (PGN), regulate abscisic acid (ABA) signaling and drought stress or salt stress, and have functions related to the electron transport chain (Laluk et al., 2011; Zhu et al., 2014). Mutant pgn has reduced leafing and rooting at high concentrations of ABA and salt compared to wild type (Laluk et al., 2011). In addition, two PPR genes, THERMO-SENSITIVE CHLOROPHYLL-DEFICIENT MUTANT 10 (TCD10) and WHITE STRIPE LEAF 5 (WSL5), are required for chloroplast development under cold stress in rice (Liu et al., 2018; W. Wu et al., 2016). In this study, we analyzed the expression pattern of potato PPR under two abiotic stresses, and the results showed that the expression of many potato PPR genes was induced by salt stress and osmotic stress. Further qRT-PCR analysis verified the expression of four genes under salt stress and osmotic stress. StPPR371, StPPR113, and StPPR388 were up-regulated under both stresses, while StPPR219 was opposite to the transcriptome and was down-regulated under stress (Figure 4B–C). The subcellular localization of StPPR219 and StPPR371 proteins indicates that their response to stress may be related to chloroplasts. Although the molecular mechanism needs to be further explored, these analysis results will help to explore the molecular functions of these genes in the two stress processes.
. Supplementary material
The following supplementary material is available for this article:
Figure S1. Potato PPR-SMR members and evolutionary relationship. The tree was constructed in MEGA-X by the Maximum Likelihood method with the Jones–Taylor–Thornton model and set 1,000 bootstrap replications in MEGA-X. Identical shapes at the ends of branches indicate they belong to the same branch and the protein structures are predicted on the MEME-suite.
Figure S2. Structure of StPPR genes (UTR/CDS/intron). The result was visualized with genomic annotation in TBtools and most StPPR genes contain one or no introns.
Figure S3. Statistics of intron numbers in P-class gene and PLS-class gene in various species. There are fewer introns in PLS-class genes than in P-class genes in all species, and lower plants contained more intron-rich PPR genes.
Figure S4. Expression pattern of StPPR genes in eight tissues. The majority of PPR genes are expressed in the root and shoot apex, while fewer PPR genes are expressed in the stem, flower, and leaf. Heatmap was drawn by the MeV 4.9 package.
Table S1. Basic information of StPPR genes.
Table S2. StPPR genes described in this study.
Table S3. Subcellular localization prediction of StPPR proteins using Predotar 1.04.
Table S4. Primer sequences used in this study.
