. Introduction
Morphological variability of plants is an important mechanism that allows them to adapt to the immediate environment and, therefore, avoid the otherwise inevitable migration or extinction driven by climatic or selective pressures (Nicotra et al., 2010). Environmental factors that are known to influence morphological changes include temperature (Quint et al., 2016), precipitation (Castro-Díez et al., 1997), insolation (Kim et al., 2005), and even biotic factors, such as herbivory (Eisenring et al., 2020). However, plant populations often occupy large areas, continuous or disjoint, in which the pressures on individuals can differ significantly. Under such conditions, different populations and individuals can vary greatly in phenotypic and genetic diversity (Valladares et al., 2014), driven by processes like genetic drift and gene flow. Genetic drift is a stochastic process that changes the frequency of a gene variant, resulting in either increase or decrease of the gene pool (Rice et al., 2011). Gene flow, on the other hand, enables the introduction of new alleles, increasing variability within the population (Agrios, 2005). Sufficient variability within natural populations enhances their potential to endure and adapt to pressures induced by climate change and determines their ability to sense those changes and trigger an appropriate response (Fritz et al., 2018; Nicotra et al., 2010).
Morphological variability within the species is important evolutionary-wise as well, as it is one of the main sources of data for evolutionary pattern identification (Alcántara-Ayala et al., 2020). As proposed by West-Eberhard (2003), plants’ adaptation to novel conditions starts with a phenotypic response producing advantageous phenotype, followed by changes in allele frequency. Therefore, identification of variability within the species is crucial in understanding the evolutionary processes responsible for maintaining diversity and promoting speciation (Futuyma, 2017). Furthermore, the assessment of morphological trait variability also serves a practical application, as it is a resource- and time-friendly method for the estimation of a species’ genetic diversity (Khadivi et al., 2022).
Patterns of variability, however, are not uniform in all species. For instance, woody species exhibit high levels of intrapopulation variability, while differentiation between populations is significantly lower (Hamrick et al., 1992). Furthermore, pollination and dispersal mechanisms are also of great significance, as animal-pollinated and animal-dispersed species display high genetic and, therefore, morphological variability (Hamrick et al., 1992). Such species usually lack any form of population structure, as they generally do not follow the patterns of isolation by distance (IBD) or isolation by environment (IBE). This has been confirmed for various fruit-bearing species, like Sorbus aucuparia L. (Sulimanec et al., 2023; Yousefzadeh et al., 2021) and S. torminalis (L.) Crantz. (Demesure et al., 2000; Kučerová et al., 2010), Malus sylvestris (L.) Mill. (Chen et al., 2023), Prunus mahaleb L. (Jordano & Godoy, 2000) and P. spinosa L. (Leinemann et al., 2014). It was the latter-mentioned species that attracted our attention due to its wide distribution range and pioneer character.
Blackthorn (Prunus spinosa L., Rosaceae) is a deciduous shrub widely distributed across central and southern Europe, Asia Minor and northwestern Africa, where it grows in forest edges, thickets and unused arable land (Popescu & Caudullo, 2016). Current research on this species has mostly focused on the health benefits (Coppari et al., 2021; María Ruiz-Rodríguez et al., 2014; Negrean et al., 2023; Pinacho et al., 2015), particularly focusing on the antioxidative properties of leaf and fruit extracts (Marchelak et al., 2017; Sabatini et al., 2020). However, a number of scientific papers focused on the genetic variability (Brown et al., 2022; Halász et al., 2017; Leinemann et al., 2014; Mohanty et al., 2000, 2002), of blackthorn populations, as well as the morphological characteristics of the species (Depypere et al., 2007; Vander Mijnsbrugge et al., 2016). Blackthorn is a morphologically very variable species (Hanelt, 1997) whose variability is further affected by hybridization with cultivated forms (Vander Mijnsbrugge et al., 2016). Other species within the genus Prunus L. also display high levels of morphological differentiation, in particular, P. lycioides C.K.Schneid. (Hashemi & Khadivi, 2020); P. scoparia Schneider (Khadivi-Khub & Anjam, 2014; Moradi et al., 2020); P. avium (L.) L. (Rakonjac et al., 2014) and P. dulcis D.A.Webb (Nikoumanesh et al., 2011). High variation in species within the genus Prunus is often attributed to environmental conditions and phenotypic plasticity (Guzmán et al., 2018; Vander Mijnsbrugge et al., 2016) and genetic diversity (Erturk et al., 2009).
Considering its pronounced importance in meadow and forest ecosystems, and for the overall biodiversity, it is of the highest importance to explore the current condition of populations in-depth, which could provide the guidelines for the estimation of genetic variability and protection and conservation of blackthorn gene pool, as has already been done in some European countries (Kleinschmit et al., 2008; Vander Mijnsbrugge et al., 2005). As woody plants are long-lived organisms, the conservation of their diversity is a key factor in protecting the autochthonous populations (Vander Mijnsbrugge et al., 2005). Furthermore, in light of ongoing climate change, it is important to determine the dependence of fruit morphological traits on environmental conditions, as fruit morphology is significantly correlated with various climatic and habitat characteristics (Corelli-Grappadelli & Lakso, 2004; Lotan & Izhaki, 2013; Woznicki et al., 2019). According to all the above, the aims of this study were: (1) to describe the variation of fruit biometrics and shape parameters for blackthorn populations in the northwestern part of the Balkan Peninsula; (2) to verify whether fruit dimensions and shape of these populations change with geographical or environmental distances between populations.
. Material and methods
. Studied species
Prunus spinosa is a deciduous, insect-pollinated, and animal-dispersed, up to 5 m tall shrub. It occupies forest edges and openings, borders of agricultural landscape, and abandoned meadows, where it is one of the main species. Ecologically, it occurs on sunny, rocky slopes and versatile but fertile soils (Popescu & Caudullo, 2016). It usually forms a very dense canopy, containing many short shoots often transformed into thorns (Krüssmann, 1960). White flowers occur before leafing, from March to May. The fruits are up to 1.5 cm long globose drupes, purple in color, with greenish pulp. The fruits ripen from August to October. The stones are brownish and round, up to 9 mm long and 8 mm wide (Idžojtić, 2019; Krüssmann, 1960). It is important to note that this species bears fruit very rarely, as it is commonly affected by late frosts (Wanjiku & Bohne, 2022). It is a species with many potential uses, as all of its parts have some utilitarian value. Nevertheless, the most widely used are fruits, which are edible and can be processed into various products for human nutrition (Popescu & Caudullo, 2016; Tardío et al., 2006).
. Plant material
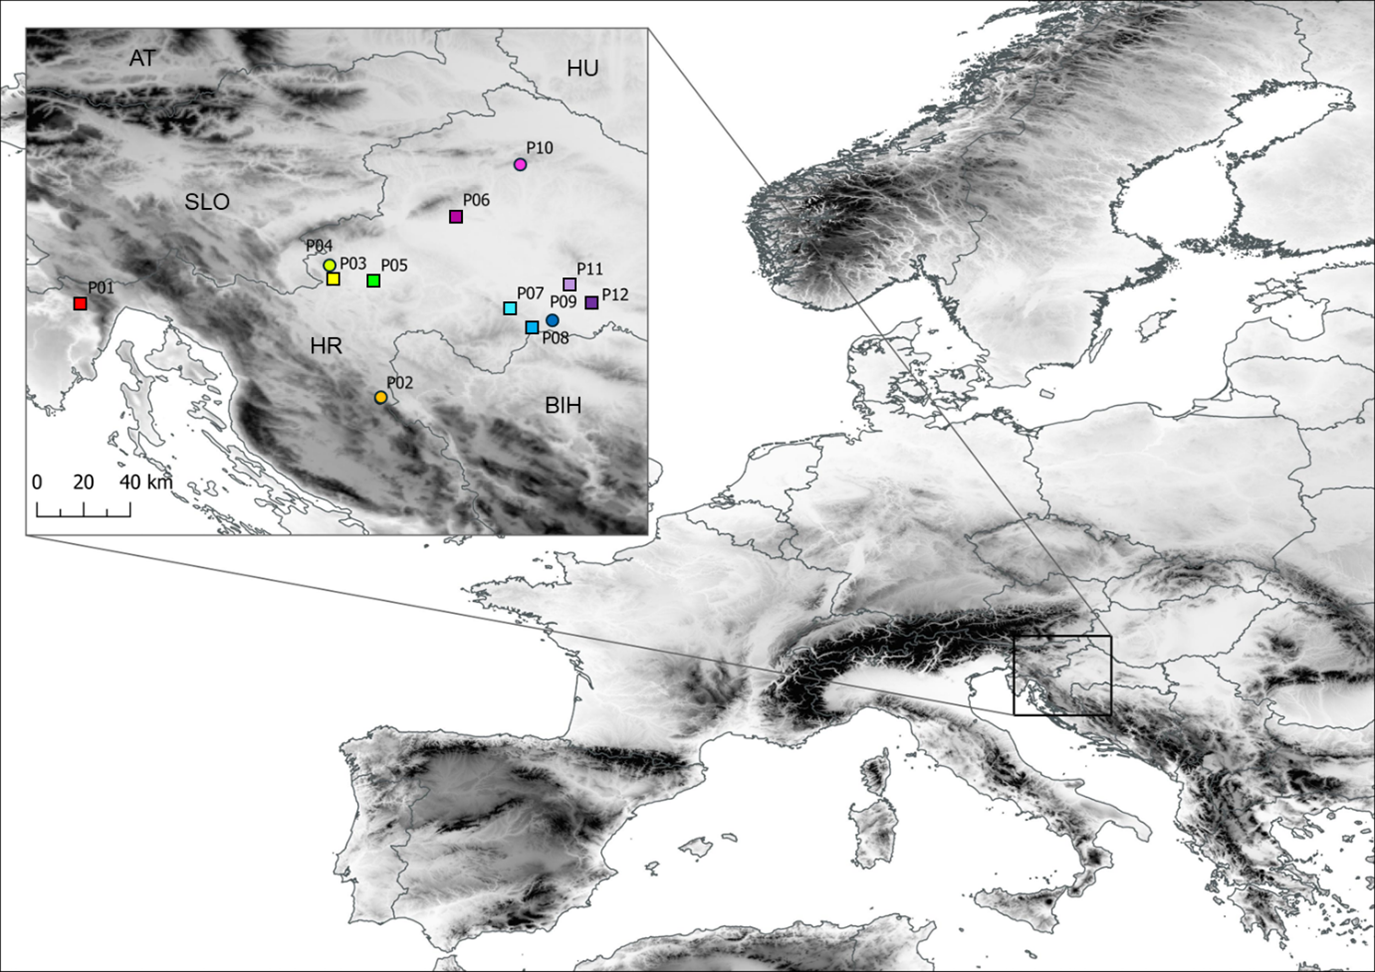
For the purpose of this research paper, 12 populations of blackthorn were selected (Figure 1, Table S1). These populations were located in the North-western part of the Balkan Peninsula, in the areas of high prevalence of this species in western and central Croatia. This area has suitable conditions for the abundant presence of this species, as there are many open habitats, hills, and abandoned agricultural areas. The researched area is characterized by heterogeneous environmental conditions, with annual mean temperature across studied populations ranging from 8.6 to 11.3 °C and annual precipitation in the range from 862 to 1,340 mm. The samples were collected in autumn, after the full ripening of the fruits. Within each population, four to seven shrubs were selected, with a total of 56 individuals represented in the study. From each shrub, approximately 500 g of fruits were put into plastic ziplock bags, which were immediately marked with identification codes. Ziplock bags were then stored in portable cooler bags and transported to the Molecular Biology Lab at the Department of Forest Genetics, Dendrology and Botany, Faculty of Forestry and Wood Technology, University of Zagreb.
. Morphometric fruit measurements
In order to conduct the morphometric analysis, 50 fruits were randomly selected from each shrub. In total 2,800 fruits were sampled and included in the analysis. Firstly, fruit mass (m) was weighed, using the 0.1 g precision scale (Adam EqipmentTM, LTB3602i), and fruit length (FL) and width (FW) were measured using a digital calliper (Alpha Tools®;, Bahag AG, Germany), with an accuracy of 0.1 mm. Afterward, the fleshy part of the fruit was mechanically removed from the stones. Stones were then scanned, using an A3-format scanner (MICROTEK ScanMaker 9800XL), at the resolution of 600 dpi (.TIF). Thus, created image files were further analyzed in the software package WinSeedle PRO (Regent Instruments Inc., Canada), designed specifically for measurements of various plant fruits and seeds. The measured traits included stone length (SL) and stone width (SW). The stone thickness (ST) was additionally hand-measured using the digital caliper. From the measured traits, the following ratios were calculated: fruit length/fruit width (FL/FW); stone length/stone width (SL/SW); stone thickness/stone width (ST/SW); and stone thickness/stone length (ST/SL). Finally, ten morphological traits were examined in order to assess the morphological variability within and among the populations.
. Statistics of fruit morphology
The data trend of the measured morphological traits was described using descriptive statistical parameters, for which the standard algorithms of the descriptive analyses were used (Sokal & Rohlf, 2012). The mean values (M), standard deviations (SD) and the coefficients of variability (CV%) were calculated on the individual populations’ level, as well as for the overall sample. In addition, Pearson’s correlation coefficients were calculated between all studied fruit traits. To determine the intra- and interpopulation variability of the analyzed blackthorn populations, the hierarchical analysis of variance (ANOVA) was used, followed by Tukey’s HSD test. Descriptive statistics and ANOVA analyses were carried out using the program package STATISTICA (Data Analysis Software System, version 13; TIBCO Software Inc.: Palo Alto, CA, USA, 2018).
. Populations’ structure
Population structure provides information about the distribution of variability between populations. To identify the divergence and structure of the studied populations based on the fruit morphological characters, multivariate statistical methods were used (McGarigal et al., 2000). In total, seven variables were included in the analysis, i.e., the highly correlated ones (r > 0.85) were excluded. Agglomerative hierarchical clustering algorithms were used to construct a tree diagram. Pairwise Euclidean distances were calculated, and cluster analysis was performed using the complete linkage method (Koutecký, 2015). In addition, to find the main dimensions that determine the morphological variation of fruits, principal component (PC) analysis was used across all individuals and seven studied morphometric traits. The biplot was constructed by two principal components showing analysed individuals and traits. The input data in multivariate statistical methods were previously standardized, i.e., standardization of characters to zero mean and unit standard deviation was performed prior to each multivariate analysis. All multivariate statistical analyses were carried out using the “MorphoTools” R scripts in R v.3.4.3 (R Core Team, 2016) by following the manual of Koutecký (2015).
. Correlations between morphological, geographical and environmental variables
To test correlations between morphometric, geographic, and environmental data, three matrices were calculated. To calculate the environmental distance matrix, climate data were obtained from the WorldClim 2 database with a spatial resolution close to a square km (Fick & Hijmans, 2017; Hijmans et al., 2005). First, to avoid redundancy, correlations among the 20 environmental (19 bioclimatic and altitude) variables for all studied populations were calculated to exclude the highly correlated ones (r > 0.85). Finally, nine bioclimatic variables and altitude were selected for the principal component analysis (PCA; Table S2 and Figure S1) and for the calculation of environmental distances. Environmental differences were calculated as the Euclidian distance between the population means for the first three principal components of the principal component analysis (PCA). Furthermore, Squared Mahalanobis distances between the populations were computed to obtain a matrix of morphometric distances among the studied populations. Geographic distances were calculated from the latitude and longitude of the site of sample collection. Finally, to assess isolation by distance (IBD) and isolation by environment (IBE), the response matrix (morphological differences) was compared to the two predictor matrices (environmental differences and geographic distance) using simple Mantel tests (Manly, 2007; Mantel, 1967; Smouse et al., 1986). The significance level was assessed after 10,000 permutations as implemented in NTSYS-pc Ver. 2.02 (Rohlf, 2005). In addition, Pearson correlation coefficients were calculated between all fruit and geographical and environmental traits.
. Results
. Traits’ and populations’ variability
Descriptive statistical analysis results for the analyzed fruit traits are displayed in Table S3 and Figures 2 and 3, for each individual population and the overall sample. The average fruit mass (m) was 1.71 g, and the average length (FL) and width (FW) were 13.45 mm and 13.18 mm, respectively. The length of the stone (SL) was, on average, 9.62 mm, with an average width (SW) of 7.6 mm and an average thickness (ST) of 5.69 mm. The most variable trait was fruit mass, with an average coefficient of variation of 28.67%, whereas the remaining variables were significantly less variable, with the lowest value of 7.77% (FL/FW) and the highest value of 14.09% (ST/SL).
Figure 2
Box and whiskers plots describing the variation in the fruit morphometric traits within the 12 studied blackthorn (Prunus spinosa L.) populations. The black line represents the average value, and the box borders show the standard deviation. The whiskers are used to indicate a 2× standard deviation. Populations acronyms as in Figure 1. Morphometric traits: m–fruit mass; FL–fruit length; FW–fruit width; FL/FW–fruit length/fruit width. Means marked with different letters were significantly different in ANOVA analysis, at p ≤ 0.05 level.
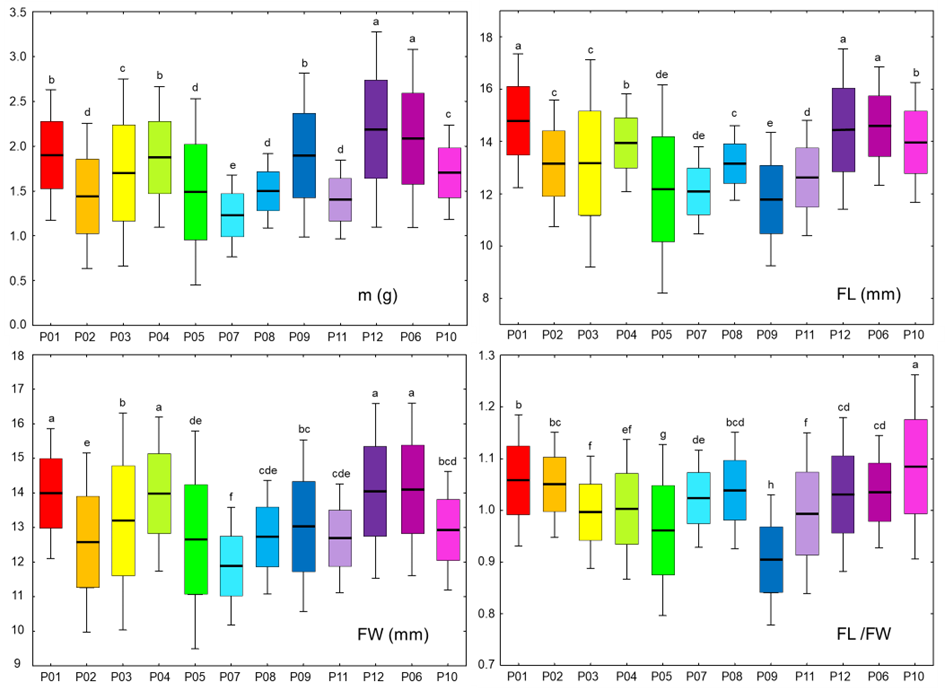
Figure 3
Box and whiskers plots describing the variation in the stone morphometric traits within the 12 studied blackthorn (Prunus spinosa L.) populations. The black line represents the average value, and the box borders show the standard deviation. The whiskers are used to indicate a 2× standard deviation. Populations acronyms as in Figure 1. Morphometric traits: SL–stone length; SW–stone width; ST–stone thickness; SL/SW–stone length/stone width; ST/SW–stone thickness/stone width; ST/SL–stone thickness/stone length. Means marked with different letters were significantly different in ANOVA analysis, at p ≤ 0.05 level.
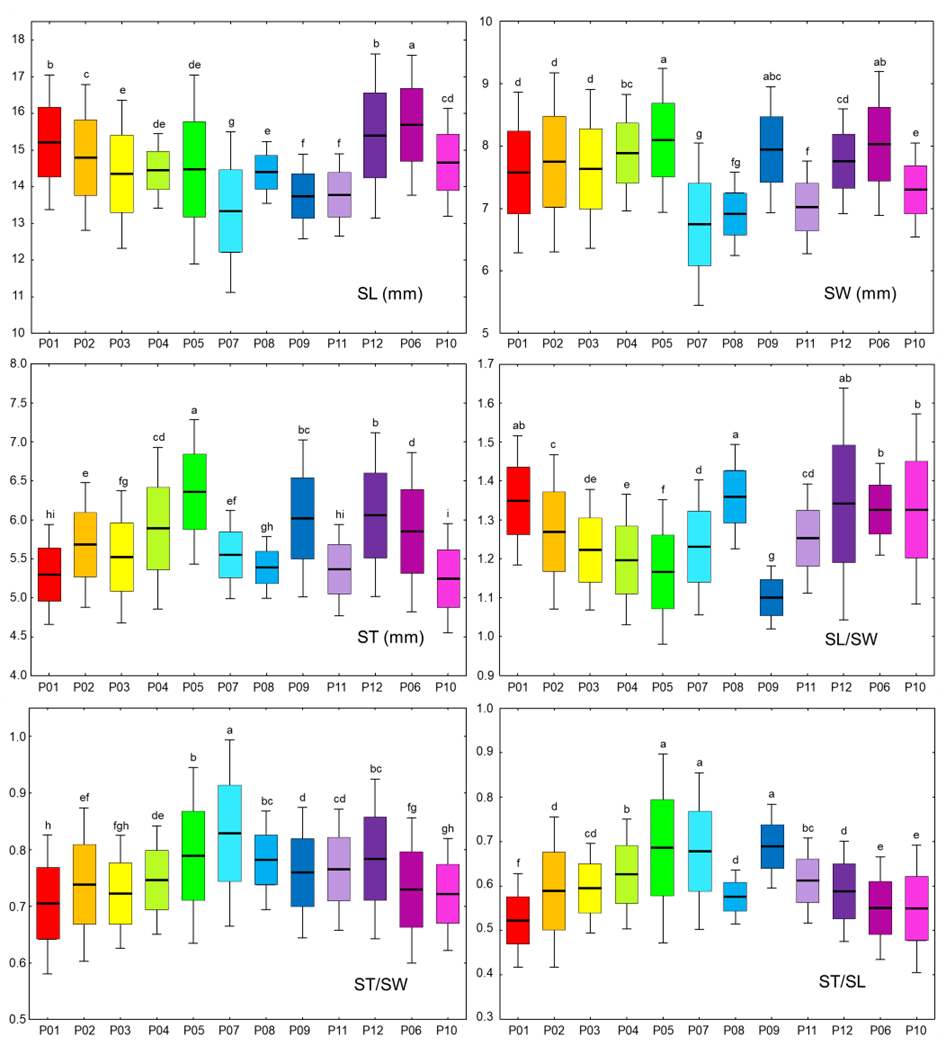
Central population P06 (Sesvete) and easternmost population P12 (Lipovljani) were noted for having the heaviest and widest fruits, as well as having the longest stones. Population P05 (Rečica) was characterized by having, on average, the widest and thickest stones. On the other hand, population P07 (Bijelnik) had, on average, the lowest values for four traits: fruit mass (m), fruit width (FW), stone length (SL), and stone width (SW). The shortest fruits were found in population P09 (Timarci), whereas the thinnest stone was noted for northernmost population P10 (Klanik). Observing the calculated ratios, it is clear that the westernmost populations, P01 (Lupoglav) and P02 (Plitvička jezera), as well as the northernmost population, P10 (Klanik), had the most oblong fruits, given that the fruit length to fruit width ratio (FL/FW) was 1.06, 1.05 and 1.08, respectively. On the other hand, the population with the most oblate fruits was P09 (Timarci), where FL/FW was 0.90. All populations had oblong stones, however, stone length to stone width ratio (SL/SW) was the lowest in population P09 (Timarci) (1.10), and the highest in populations P01 (Lupoglav) (1.35), P06 (Sesvete) (1.33), P08 (Kostajnica) (1.36), P10 (Kalnik) (1.33) and P12 (Lipovljani) (1.34). Westernmost population P01 (Lupoglav) had the lowest stone thickness to stone width (ST/SW) and stone thickness to stone length (ST/SL) ratios, at 0.70 and 0.52, respectively. In contrast, ST/SW was the highest in population P07 (Bijelnik) (0.83), whilst ST/SL was the highest in population P09 (Timarci) (0.69).
The most variable population was central population P05 (Rečica), with the highest coefficients of variation for the following traits: m, FL, FW, FL/FW, SL, and ST/SL. As the least variable population, the population on the Bosnian border P08 (Kostajnica) stood up, with a total of seven (m, FL, SL, SW, ST, ST/SW, and ST/SL) out of the ten lowest coefficients of variation found in this population.
Out of the total of 45 pairs of traits, nine pairs (FL/FW with m, FW, and SW; ST with FL and SL; SL/SW with FW, SW, and ST/SW; ST/SL with SW) did not demonstrate statistically significant correlations. Strong correlations, with correlation values above −0.7 or 0.7, were found for 13 pairs of traits (Table 1). Out of the 13 correlations, four were negative (ST/SL with FL, FL/FW, SL, and SL/SW) whereas nine were positive (m with FL, FW and SL; FL with FW and SL; FW with SL; FL/FW with SL/SW; SW with ST; ST/SW with ST/SL). In general, fruit length and width correlated positively with fruit mass. On the other hand, the shape and thickness of the stones were predominantly negatively correlated with fruit dimensions and shape.
Table 1
Pearson’s correlation coefficients between analyzed fruit traits. Morphometric traits: m–fruit mass; FL–fruit length; FW–fruit width; FL/FW–fruit length/fruit width; SL–stone length; SW–stone width; ST–stone thickness; SL/SW–stone length/stone width; ST/SW–stone thickness/stone width; ST/SL–stone thickness/stone length. n.s.–not significant at p > 0.05; * significant at 0.01 < p < 0.05; ** significant at 0.001 < p < 0.01; *** significant at p < 0.001. All the r-values above 0.85 are bolded.
The ANOVA reveals significant differences between and among populations for all of the measured morphological fruit and stone traits (p < 0.05) (Figures 2 and 3, Table 2). Intrapopulation variability accounted for 25%–50% of the total variability. In general, interpopulation variability demonstrated values lower than those of intrapopulation variability. As an exception, for two traits the intra- and the interpopulation variabilities accounted for equal parts of the total variability. The error component, i.e., the variability of fruits within each shrub, demonstrated values in the range of 24.64% for stone length (SL) to 56.37% for stone thickness to stone width ratio (ST/SW).
Table 2
Results of the hierarchical analysis of variance. Morphometric traits: m–fruit mass; FL–fruit length; FW–fruit width; FL/FW–fruit length/fruit width; SL–stone length; SW–stone width; ST–stone thickness; SL/SW–stone length/stone width; ST/SW–stone thickness/stone width; ST/SL–stone thickness/stone length. * significant at 0.01 < p < 0.05; ** significant at 0.001 < p < 0.01; *** significant at p < 0.001.
. Population structure
The first two PC axes are noted for having the Eigen-values greater than 1 (Table 3, Figure 4). The first PC accounted for 52.05% of the total variability, whereas the second PC explained 30.79%. The first PC was highly positively correlated to four traits (m, FL, FW, SL) and highly negatively correlated to one (ST/SL). In other words, on the right side of the diagram, shrubs with larger fruits and longer stones, as well as lower values of ST/S, are found, whereas, on the left half of the diagram, shrubs with smaller fruits, shorter stones, and lower values of ST/SL are found. The second PC was highly significantly correlated to traits SL and SW, i.e., on the upper half of the diagram, shrubs with thicker stones are found, whereas on the bottom half, those with thinner stones are noted.
Table 3
Pearson correlation coefficients between seven fruit morphometric traits and scores of the first four principal components. Morphometric traits: m–fruit mass; FL–fruit length; FL/FW–fruit length/fruit width; SW–stone width; ST–stone thickness; SL/SW–stone length/stone width; ST/SW–stone thickness/stone width.
Figure 4
Principal component analysis (PCA) of 12 blackthorn (Prunus spinosa L.) populations based on seven fruit morphometric traits. Populations acronyms as in Figure 1. Morphometric traits: m–fruit mass; FL–fruit length; FL/FW–fruit length/fruit width; SW–stone width; ST–stone thickness; SL/SW–stone length/stone width; ST/SW– stone thickness/stone width.
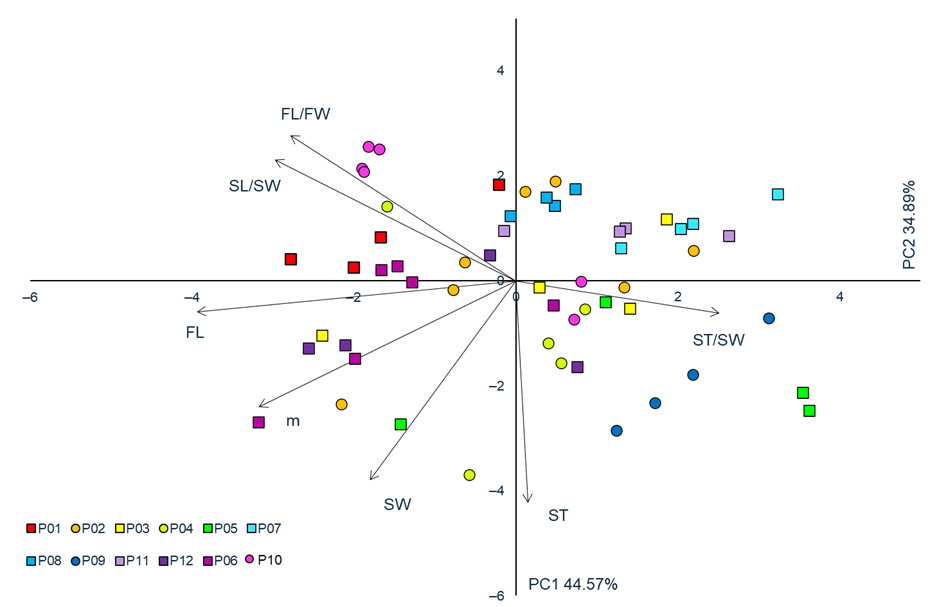
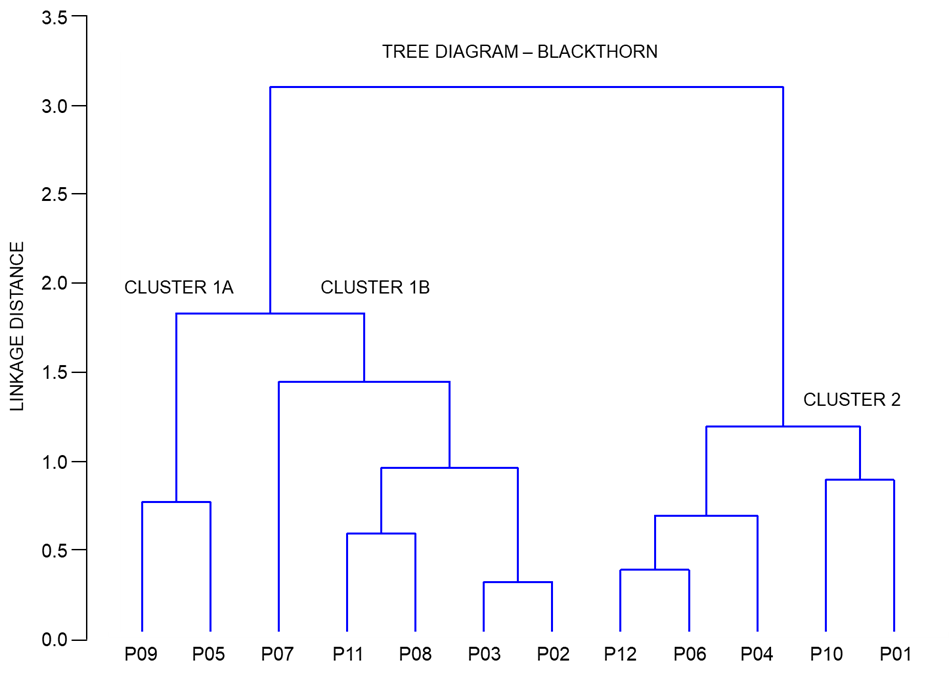
Figure 5 depicts a dendrogram, in which a clear separation of the populations into two groups can be seen. The first group consisted of central populations P09 (Timarci), P05 (Rečica), P07 (Bijelnik), P08 (Kostajnica), P03 (Vinski vrh), eastern population P11 (Moslavačka gora), and southernmost population P02 (Plitvička jezera), whereas the second group consisted of central populations P06 (Sesvete), P04 (Ozalj), northernmost population P10 (Kalnik) and westernmost P01 (Lupoglav) and easternmost P12 (Lipovljani) populations. Furthermore, the first group can be subdivided into two subgroups, with the first group encompassing central populations P09 (Timarci) and P05 (Rečica), and the second one central populations P07 (Bijelnik), P08 (Kostajnica), P03 (Vinski vrh), eastern population P11 (Moslavačka gora) and southernmost population P02 (Plitvička jezera).
Figure 5
Tree diagram of the cluster analysis based on seven fruit morphometric traits in studied blackthorn (Prunus spinosa L.) populations. The complete linkage method was used to join the clusters, and the Euclidean distance to define the distance between the studied populations. Populations acronyms as in Figure 1.
. Correlations between morphological, geographical and environmental variables
The analyzed populations showed non-significant correlations between both geographic and morphological distances (isolation by distance (IBD)), (r = 0.116841, p = 0.350156) and between environmental and morphological distances (isolation by environment (IBE)), (r = 0.002449, p = 0.984429).
Observing correlations between individual morphological traits and geo-environmental variables, very few significant correlations were detected (Table 4). Among 120 pairs, only seven showed significant, nevertheless weak correlations. The mean diurnal range (BIO2) showed a significant correlation with FL, FL/FW, SL/SW, and ST/SL, while precipitation seasonality (BIO15) proved to be significantly correlated to FL, SL, and ST/SW.
Table 4
The results of correlation analysis between fruit traits and geo-environmental parameters. Morphometric traits: m–fruit mass; FL–fruit length; FW–fruit width; FL/FW–fruit length/fruit width; SL–stone length; SW–stone width; ST–stone thickness; SL/SW–stone length/stone width; ST/SW– stone thickness/stone width; ST/SL– stone thickness/stone length. Significant correlations are in bold letters (p value < 0.05).
. Discussion
When the results of descriptive statistical analysis were observed, fruit mass stood out as the most variable trait. Other traits had, on average, significantly lower coefficients of variability, within range of 7.77 to 14.09%. Similar results have been previously published by authors researching the variability of blackthorn (Depypere et al., 2007) and other drupe-fruited plants, such as Prunus lycioides Spach (Hashemi & Khadivi, 2020) and P. scoparia Spach (Moradi et al., 2020). According to Rasch (1988, as cited in Depypere et al., 2007), coefficients of variation for the character studied can be interpreted as following: CV < 10%, small variability; 10% < CV < 20%, normal variability; and CV > 25%, high variability. In the case of blackthorn, only one trait was highly variable (m), four were normal (FL, FW, SL, ST/SL), and five were characterized by small variability (FL/FW, SW, ST, SL/SW, ST/SW).
Values obtained by fruit measurements in this research, when the length and width of fruits are concerned, were within the range of 1.2 to 1.5 cm. Herman (1971) and Idžojtić (2019) described fruits to be globose, with an overall size between 1 and 1.5 cm. The same dimensions are mentioned by Krüssmann (1960), although he indicated the shape to be globose to oblate and ovoid, which was the case in our research as well. According to Idžojtić (2019), the length and width of the stones of blackthorn vary between 7 to 9 mm, i.e., 6 to 8 mm. The average values for stone length in this research were slightly higher, with the stone length within the range of 8.3 to 10.7 mm and stone width falling within the previously mentioned range.
Depypere et al. (2007) conducted a more thorough study of stone dimension and shape variation for the taxa of Prunus, section Prunus. Their research encompassed five taxa, including the blackthorn, with samples collected in botanical gardens and wild habitats of Belgium, Czech Republic, Estonia, France, Mallorca, Romania, Russia, and Slovakia. The aforementioned authors thus reported blackthorn stone to be, on average, 8.8 mm long, 8.0 mm wide, and 6.1 mm thick. Average values in this research, when the width and thickness of stone are concerned, were somewhat lower, with width and thickness of 7.6 mm and 5.7 mm, respectively, whereas the length values were slightly higher, at 9.6 mm. However, it is important to note that what was considered as the stone width by Depypere et al. (2007), was considered as stone thickness in our research, and vice versa. Herein shown values have been adjusted to match our interpretation. Wider and thicker stones in their study could be attributed to more favorable site conditions, considering the majority of samples included in their research were collected from botanical gardens, which usually provide the best conditions for growing species.
As expected, the length and width of the fruit were highly correlated to fruit mass. In addition, the same trend was observed for stone size. Similar results have been reported by various authors and similar species, including Sorkheh et al. (2009) for P. lycioides; Khadivi-Khub and Anjam (2014), and Khadivi-Khub et al. (2016) for P. scoparia; Khadivi-Khub and Osati (2015) and Khadivi-Khub and Etemadi-Khah (2015) for cultivated almond, P. dulcis (Mill.) D.A.Webb. However, when stone thickness is considered, it was not statistically significantly correlated to its length or fruit dimensions. In other words, larger fruits are not necessarily fitted with thicker endocarps, which could be considered a desirable trait in drupe-fruit breeding programs. This would mean that larger blackthorn fruits, which boasted thinner stones, would have a higher percentage of fleshy mesocarp, a fact which would make them ultimately more desirable in industrial processing.
Based on the results of the hierarchical analysis of variance, intrapopulation variability was confirmed to be higher than that on the interpopulation level. In addition, in the majority of cases, the variability of fruits of a single shrub was lower than that of the variability of shrubs within each population. A similar pattern of total variance distribution was reported by other authors (Poljak et al., 2022; Xu et al., 2016) when fruit/cone morphological variability of woody taxa is concerned. However, this rule of variability distribution was not observed for variables FL/FW and ST/SW. For these two variables, the variability between shrubs of the same population was smaller than that within each individual shrub.
It is well known that blackthorn fruits are ingested and easily dispersed over longer distances by mammals and, to some extent, by birds (Vander Mijnsbrugge et al., 2013), especially in areas without major geographical barriers. According to Mohanty et al. (2002) this long-distance seed dispersal in P. spinosa can be efficient enough to decrease the genetic heterogeneity among populations and to erase phylogeographic genetic structures. Nevertheless, our results showed a high level of differentiation of blackthorn populations in the northwestern part of the Balkan Peninsula. Populations included in this research cover a range of different environmental conditions within a distance of about 215 km. Thus, morphological differentiation of the studied populations, due to isolation by distance (IBD) or environment (IBE) can be assumed. However, although we revealed significant population differentiation, both IBD and IBE proved not to have any significant impact on fruit morphology and populations’ structuring. The same pattern has been observed between geographic and genetic distances using the Mantel tests for AFLPs and cpDNA haplotypes between populations from Germany and southern and south-eastern Europe (Leinemann et al., 2014), which could therefore be expected in our populations as well. Leinemann et al. (2014) suggested that vegetative regeneration, in combination with founder effects, can influence the level of differentiation between blackthorn populations. Populations with the higher occurrence of vegetative propagation tend to be more differentiated from other populations compared to those that exhibit limited vegetative propagation. In addition, a small effective population size in a founding population is likely to carry only a fraction of the genetic variation of an originating population (Mitton, 2013), resulting in decreased genetic diversity and distinctive allele frequency patterns in the newly established populations (Kivisild, 2013). The consequent lack of geographical structuring based on morphological traits was confirmed for other animal-dispersed species as well, such as P. avium (L.) L. (Popović & Kerkez, 2016; Rakonjac et al., 2014) and Sorbus torminalis (L.) Crantz. (Bednorz, 2007). In addition, genetic studies of population variability of Prunus sibirica L. (Wang et al., 2014), P. africana (Hook.f.) Kalkman (Nzweundji et al., 2020), and S. torminalis (Demesure et al., 2000) also resulted in no geographical structuring of populations.
Fruit traits and geo-environmental parameters were weakly correlated and only a few of them were significant. All these correlations were related to oscillations in monthly temperatures and seasonality of precipitation, indicating that temperature fluctuations are mostly negative, and variability in precipitation throughout the year has a mainly positive influence on fruit length. However, as the Mantel test showed no significant overall influence of environmental conditions on fruit morphology, and obtained correlations are weak or very weak; these results should be taken with caution as they are most likely the result of coincidence. In addition, significant control of genetics over fruit size and shape should be taken into account (Wang et al., 2015), as some traits have a strong genetic inheritance (van der Knaap & Østergaard, 2018). For instance, a large proportion of phenotypic variability in peach (Prunus persica (L.) Batsch) has been explained by the single, major locus (Cirilli et al., 2021) indicating the possibility of the same case in our study, conducted on a related species within the same genus.
Based on the conducted research, which also represents the first blackthorn study in the northwestern part of the Balkan Peninsula, intra- and interpopulation variability of fruits’ morphological traits was quantified. Overall, the results suggest that the morphological diversity of populations is under the influence of multiple evolutionary processes simultaneously and is not shaped by geographical or environmental distances between populations. This research forms the basis of future research and can be used to create guidelines for protection of blackthorn in the region. Information on fruit dimensions size can be useful in the conservation of the gene pool of this species, as larger fruits usually contain larger seeds, which are positively correlated to germination rates, growth, and seedling survival (Mao et al., 2019); all of which are desirable properties in conservation or breeding programs. Nowadays, in Europe, wild fruit species are gaining greater attention, and conservation efforts have been ongoing in many countries. As many European countries are shifting to close to nature forestry, blackthorn could play an important role, as it is one of the most important species in forest succession. Therefore, in the future there could be increased demand for suitable genetic material of this species, which will find use in afforestation programs across Europe (Turok et al., 1996).
. Supplemenatry material
The following supplementary materials are available for this article:
Table S1. Geographic coordinates, altitudes, and nine bioclimatic variables for 12 blackthorn (Prunusspinosa L.) populations.
Table S2. Pearson correlation coefficients between altitude and nine bioclimatic variables and scores of the first four principal components.
Table S3. Descriptive statistical parameters for studied fruit morphometric traits.
Figure S1. Biplot of the principal component analysis (PCA) based on altitude and nine bioclimatic variables.
