Introduction
For many years, molecular analysis based on polymerase chain reaction (PCR) in combination with morphological and phylogenetic analyses have been used in taxonomic studies (Hyde et al.,2013; Jayasiri et al.,2015; Liew et al.,2000; Lücking et al.,2014; White et al.,1990). In mycology, species identification usually relies on sequencing of the nuclear ribosomal internal transcribed spacer (ITS) region (Bellemain et al.,2010; Bridge et al.,2005; Horton & Bruns,2001; Martin & Rygiewicz,2005; Seifert,2009), the formal primary fungal barcode with the highest probability of correct identification of a broad group of fungi (Schoch et al.,2012). To multiply highly diversified rDNA regions, the universal ITS1/ITS4 primers, which amplify the ITS1 and ITS2 fragments along with the 5.8S ribosomal subunit, located between the sequences encoding the small (SSU) and large (LSU) subunits of the ribosomal operon are used (White et al.,1990). Species are identified by comparing the sequences of the analyzed isolates with sequences deposited in international databases, such as the International Nucleotide Sequence Database (INSD) (http://www.insdc.org/) and User-Friendly Nordic ITS Ectomycorrhiza (UNITE) database, considered to be the largest database (Nillson et al.,2019; Yahr et al.,2016). They provide access to the National Center for Biotechnology Information (NCBI) (https://www.ncbi.nlm.nih.gov/), European Nucleotide Archive (ENA) (https://www.ebi.ac.uk/ena/), or DNA Database of Japan (DDBJ) (https://www.ddbj.nig.ac.jp/index-e.html), where over 100,000 ITS sequences are deposited. One should be aware that apart from a huge number of correctly identified species, there are sequences deposited there with technical errors, incorrectly assigned to the species, atypical chimeric ITS sequences, and also data on verification only to the level of type, family or type, which makes reliable species identification problematic (Hongsanan et al.,2018; Nilsson et al.,2009,2014). The ITS region is not equally variable in all groups of fungi (Nilsson et al.,2008) The lack of sufficient ITS variability can be a problem, especially in some species-rich genera of Ascomycota (Seifert,2009), such as Alternaria, Aspergillus, Cladosporium, Penicillium, and Fusarium, where identification to the species level based on the ITS region may be difficult (O’Donnell & Cigelnik,1997; Pryor & Michailides,2002; Samson et al.,2014; Schubert et al.,2007; Skouboe et al.,1999). Due to the possibility of ambiguous results, identification based on rDNA ITS is usually completed by morphological feature observations and sequencing of other loci such as actin (ACTB), plasma membrane ATPase (ATP1A1), calmodulin (CAM), translation elongation factor 1-alpha (EEF1A1), the second largest subunit of RNA polymerase II (RPB2), chitin synthase (CHS), and β-tubulin (TUBB) (Aveskamp, Verkley, et al.,2009; Bensch et al.,2018; Houbraken, Visagie, et al.,2014; Lawrence et al.,2013; Samson et al.,2014; Stielow et al.,2015; Visagie, Hirooka, et al.,2014, Vitale et al.,2011; Vu et al.,2019). Despite criticism (Kiss,2012), ITS sequences have been shown to be useful in delineating many fungal species and are commonly used in identification and analysis of the molecular diversity of fungi found on various plants, inhabiting soil, air or human tissues (Baturo-Ciesniewska et al.,2017; Chehri et al.,2011; Ingle,2017; Irinyi et al.,2015; Meyer et al.,2019; Nilsson et al.,2014; Pusz et al.,2018; Visagie, Hirooka, et al.,2014), and also for development of species-specific PCR primers, e.g., for Fusarium spp. (Mishra et al.,2003).
Because the reliable species identification of Ascomycota fungi is essential for diagnosing plant diseases, verifying air quality and the effectiveness of agronomic practices, or analyzing the relationship between microorganisms, our goal was to use specific examples to verify the extent to which ITS sequence analysis can be used to identify pathogens and saprobionts. Additionally, we wanted to highlight confusions and problems related to such identification in practice, as well as our attempts to solve these problems, and details that could be helpful in specific cases.
Material and Methods
Material
Isolates of Ascomycota members that were the scope of these studies were obtained in various regions of Poland, originating from plant material and air (Table 1) and were part of the collection gathered from 2015 to 2018.
Samples from the air were collected with the Air Ideal 3P Traceability system onto potato dextrose agar (PDA) (Biocorp, Poland) plates and incubated at room temperature (22 °C) for 7 days. Fragments of plants (leaves, stems, drupes, needles, and roots) with symptoms of fungal presence, raisins, and sclerotia from Sclerotinia spp. symptomatic plants were disinfected in 0.5% NaCl for 10 s, rinsed with sterile water, and then grown on PDA plates (Difco, USA) in the same conditions as samples from the air. The colonies that appeared on the medium were separately transferred to PDA slants (Difco) and initially identified based on macroscopic and microscopic observations. For molecular analyses, we selected 105 isolates initially recognized as potentially diverse ones based on features on PDA plates such as color, structure and growth rate of mycelium, presence/absence of spores, spore structure and development, and the color of the medium. The specimens (DNA and lyophilized mycelium) that were documented in this study were stored in the laboratory of the first author.
Table 1
Isolates of Ascomycota analyzed on the basis ofthe ITS region sequences.
Isolation and Preparation of DNA for Analysis
Individual isolates (105) were grown on PDA plates (Difco). After 1–2 weeks, depending on the growth rate of the isolates, three discs of 5-mm ø medium overgrown with mycelium were excised and transferred to potato dextrose broth (PDB) (A&A Biotechnology, Poland) plates, protected with Parafilm M, and incubated in the dark for 5–7 days at 23 °C. DNA was extracted according to the modified Doyle and Doyle (1990) method from 30 mg of mycelium previously rinsed in sterile water, filtered, and initially drained with a Büchner funnel, blotting paper, and vacuum pump. Samples were lyophilized in a CoolSafe lyophilizer (Scanvac, Denmark) and homogenized with quartz beads and sand in a MagnaLyser homogenizer (Roche, Switzerland). Extraction buffer (900 μL) containing 5.0% cetyltrimethylammonium bromide (CTAB), 0.5 M ethylenediaminetetraacetic acid (EDTA), 5.0 M NaCl, 1.0 M Tris-HCl (pH 8.0), β-mercaptoethanol, and 2.0% polyvinylpyrrolidone (PVP) was used. In the following steps, phenol, chloroform, isoamyl alcohol, as well as ethyl alcohol were added. The concentration of DNA suspended in 100 μL ddH2O was measured fluorometrically (Quantus; Promega, USA).
PCR Assays
The ITS regions were amplified with ITS1 and ITS4 primers (White et al.,1990) in an Eppendorf EP Mastercycler (Eppendorf, USA), in 37.5 μL of PCR Core Kit reagent (Qiagen, USA) reaction mixture. The final concentration of reagents was as follows: 1× buffer, 1× Q solution, 1.0 mM MgCl2, 0.2 mM dNTP, 0.6 pM ITS1/ITS4, 0.5 U Taq polymerase, and 2 ng DNA template. The PCR began with an initial denaturation step of 5 min at 94 °C, followed by 35 cycles of 94 °C for 1 min, an annealing temperature of 52 °C for 1 min and 72 °C for 2 min, followed by 5 min at 72 °C for a final extension. The presence of PCR products was verified by electrophoretic separation of 2 μL of the postreaction mixture in tris-borate-EDTA (TBE) buffer on a 1.2% agarose gel (Pronadisa, Spain) stained with SimplySafe (EURX, Poland).
Sequencing of ITS Regions and Data Analysis
The amplification products were purified and sequenced by Genomed (Poland). The sequencing of the ITS regions of forward and reverse strands of amplified fragments of each isolate was performed twice, as two separate replicates. A FinchTV 1.4 sequence alignment editor was used to analyze the obtained sequences. Multiple sequence alignment (ClustalW) analysis was performed in a MEGA7 software (Kumar et al.,2016) to compare sequences and prepare our own sequences for deposit in GenBank. For species identification, we used E-value and percent identity parameters of the basic local alignment search tool (BLASTn) in NCBI.
Additionally, we compared sequences in the UNITE community (https://unite.ut.ee/analysis.php). The species identification of Trichoderma spp. was also confirmed by analyzing the sequences of ITS regions in TrichOKEY ver. 2.0 (http://www.isth.info/tools/molkey/). Analyzed sequences were deposited in GenBank.
The Kimura-two-parameter model (Kimura,1980) was used to generate maximum likelihood trees from ITS rDNA sequences in MEGA7 to demonstrate the variation in the ITS regions in the species and genera studied. Bootstrap analysis with 1,000 replications was performed to evaluate the node support of the generated tree.
Additional Identification with Species-Specific Primers and Morphology
The sequencing results were supported and confirmed by morphological identification on PDA, synthetic nutrient-poor agar (SNA), and Czapek–Dox agar (Sigma-Aldrich, USA) with mycological keys and based on information from publications according to taxon-specific features (Andersen & Thrane,1996; Andersen et al.,2009; Barron,1972; Bensch et al.,2012,2018; Chlebicki,2008; Crous & Groenewald,2013; Crous et al.,2014; Domsch et al.,1980; Houbraken, de Vries, & Samson,2014; Houbraken, Visagie, et al.,2014; Jaklitsch,2009,2011; Jaklitsch et al.,2006; Lawrence et al.,2014; Leslie & Summerell,2006; Marcinkowska,2016; McKenzie,2013; Pastor & Guarro,2008; Samuels et al.,2006; Vajna,2002; Williamson et al.,2007; Woudenberg et al.,2013); nomenclature from the Catalogue of Life (http://www.catalogueoflife.org/) and Index Fungorum (http://www.indexfungorum.org/) was followed.
For Fusarium isolates, we confirmed the results of ITS sequence analysis in PCR assays with 12.5 μL of PCR Core Kit reagents (Qiagen) at the same reagent concentration as in the reaction for ITS regions with species-specific primers and annealing details listed in Table 2.
Table 2
Names, sequences, annealing conditions, and references of primers for Fusarium species analyzed in species-specific PCR assays.
Results
The comparative analysis of ITS sequences of our isolates with the databases significantly contributed to relatively reliable species identification of 83 isolates from different taxa, such as Arthrinium arundinis, Beauveria bassiana, Diaporthe oncostoma, Epicoccum nigrum, Nigrospora oryzae, Rosellinia corticium, and Sordaria fimicola, described below and listed with their accession numbers in Table 1. For most of them, it was necessary to confirm the molecular identification by observing morphological features and their origin.
Identification of Aspergillus fumigatus was not problematic. In contrast, the sequence of the A1-16A isolate was problematic and was finally determined as Aspergillus sp., which was identical with Aspergillus niger and A. tubingensis. Morphology analysis was found to be insufficient in this case. Serious problems in identification were not observed in Trichoderma spp., except for two isolates. BLASTn analysis qualified them simultaneously to a few different species including T. koningii, T. paraviridescens, T. viridescens, T. viride, and Trichoderma sp. for Tk7-16A and Trichoderma sp., T. koningiopsis, T. paraviridescens, T. atroviride, T. samuelsii, and T. viridescens for T45L-18Ip. TrichOKEY v. 2.0 limited the choice to the two species – T. koningii and T. viridescens; finally, using morphological features, we decided to classify the first one as T. koningii. For the second isolate, there were too many doubts; thus, the identification remained at the genus level. The correctness of the identification of the rest of our Trichoderma isolates, i.e., T. asperellum, T. atroviride, T. citrinoviride, T. harzianum, and T. viride was confirmed by TrichOKEY v. 2.0 and microscopic observations.
Alternaria spp. isolates required additional verification based on morphology. BLASTn analysis diagnosed four isolates as A. infectoria; however, the sequences were also identical to several other species as A. triticina or A. kordkuyana. For eight sequences, BLASTn pointed to A. alternata. However, these sequences also showed 100% identity with some sequences of A. tenuissima and even with one sequence of Aspergillus niger. The presence of dark-brown conidia in chains confirmed the identification as A. alternata.
Isolates macroscopically classified to the genus Botrytis were finally assigned to B. cinerea. Bc1S-18Ip and Bc10S-18Lp also showed 100% identity to B. fabae, B. tulipae, or B. eliptica and even with Sclerotinia slerotiorum. However, after taking into account their origin and morphology, both were classified as B. cinerea. Such features were also helpful to confirm the BLASTn results for Boeremia exigua (Phoma exigua) isolates. Observation of conidia structure allowed the classification of Cladosporium cladosporioides, in which sequences were identical to single representatives of C. perangustum, C. pseudocladosporioides, or C. subuliforme.
Molecular identification of some Fusarium spp. representatives, i.e., F. graminearum, F. oxysporum, and F. sporotrichioides did not raise serious doubts; nevertheless, the identification was confirmed through specific PCR assays. Fusarium avenaceum and F. tricinctum required additional and in-depth microscopic verification based on micro- and macroconidia. Despite the fact that they differed from each other by two nucleotides, their sequences matched both species in the database. BLASTn identified the one slow growing Fusarium sp. with pale pink mycelium and thin macroconidia as F. lateritium. Due to the lack of species-specific primers, it was confirmed with morphological features.
Out of 14 isolates from the genus Penicillium, only eight were classified to the species level: three isolates as P. glabrum, two as P. miczynskii, and one isolate each as P. digitatum, P. swiecickii, and P. glaucoalbidum. BLASTn results were consistent with verification based on morphology. Sequences of other isolates were 100% identical with two or more sequences of different Penicillium species or sequences described as Penicillium sp. In such cases, we limited identification to the genus alone. As an example, PE8-16A and PE11-16A were simultaneously verified as P. bialowiezense and P. brevicompactum.
The identification of some of our isolates was confusing where sequences were found to be identical to the sequences deposited in NCBI under more than one species name, a synonymous species, or were present and outdated. BLASTn clearly indicated Diaporthe eres for our sequences, which should be named, according to the currently valid nomenclature, as Phomopsis velata. Diplodia sapinea should be named as Sphaeropsis sapinea, Phoma macrostoma as Didymella macrostoma, Thysanophora penicillioides as Penicillium glaucoalbidum, and P. soppii as P. miczynskii.
Twelve isolates were classified only to the genus level, due to their 100% identity with several species in the database or confusing BLASTn analysis results, without the possibility of their clarification based on additional data. Such situations were noted for one Trichoderma spp., one Aspergillus sp., six Penicillium spp., two Colletotrichum spp., three Lophodermium spp., two Phoma spp., and single isolates from the genera Neoascochyta and Phacidium. For example, the Colletotrichum sp. (C2L-18Ip) sequence showed 100% identity with C. salicis, C. acutatum, or C. gloeosporioides. We limited classification to the genus level primarily due to the lack of conidia that could be decisive for the identification of the species. For the same reason, reliable identification of Phacidium sp. (P2-17Pc) isolated from needles was impossible. Our sequence was identical to two Phacidium calderae sequences originating from Arbutus unedo and Pistacia terebinthus, and differed by 2 bp from single sequences of Phacidium fennicum or P. lacerum. The origin suggested one of the last two, but in the absence of sporulation it was impossible to verify this assumption.
The identification of two Sclerotinia sclerotiorum isolates was clear, whereas for Sclerotinia spp. representatives obtained from legumes, interspecies variability was observed and they were finally identified as S. trifoliorum. They showed 100% identity with a few sequences of S. trifoliorum or differed by 1 bp from some S. trifoliorum (G→T) and S. sclerotiorum (C→T) in the database. St1-15Tp also shared an identical sequence with S. sclerotiorum (MH857810). Variability between our sequences and those in the NCBI database were also noted for Sydowia polyspora. Four of our isolates of this species varied from each other by 1–2 bp, but they were not morphologically distinct. Sp8L-17Pc also differed by one nucleotide (G→A) from the sequences available in NCBI, as well as Aureobasidium pullulans (T→C) and Penicillium glaucoalbidum (G→A). For the last two isolates, the morphology, and for the first one, also the origin, clearly confirmed the correctness of the BLASTn identification. Intraspecific variability among our Sclerotinia trifoliorum and Sydowia polyspora sequences was visible on the dendrogram (Figure 1), as well as for B. cinerea, where Bc1S-18Ip and Bc6-16A differed from Bc10S-18Lp and Bc28L-18Ps by one nucleotide (A→T); A. infectoria, where Ai12S-18Ig differed from the other three isolates by 10 nucleotides; or E. nigrum, where En29L-18Ps and En59L-18Rr isolates differed from the other six isolates by one nucleotide (T→C). Nucleotide composition within isolates from B. exigua, C. cladosporioides, and N. oryzae species was not diversified, which was also reflected in their graphical display.
Figure 1
Dendrogram constructed based on the ITS rDNA sequences of 100 isolates using the maximum likelihood method based on the Kimura-two-parameter model in MEGA7.
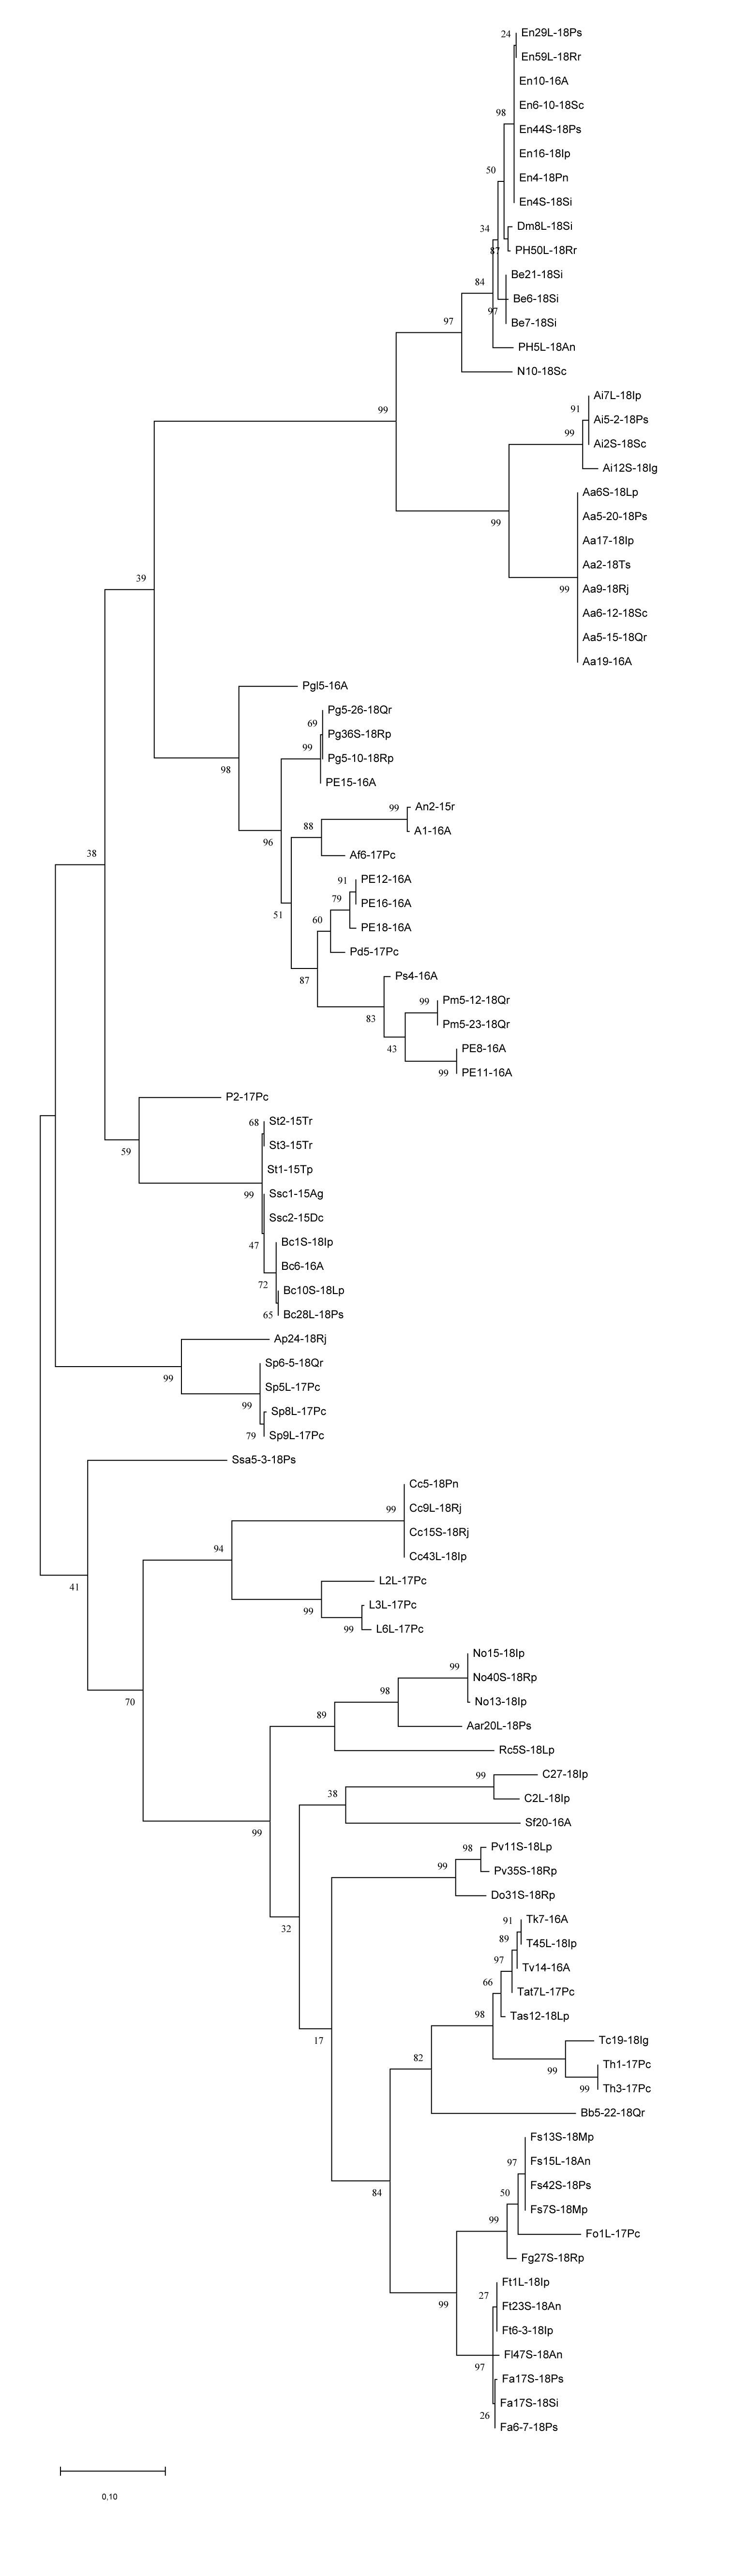
The dendrogram clearly showed the diversity and similarity between isolates of the same genus or species. Species of the genus Alternaria were clustered together, with a clear distinction between A. alternata and A. infectoria. This was also true for Aspergillus and Trichoderma species. Fusarium isolates showed a clear distinction between F. avenaceum, F. tricinctum, and F. sporotrichioides. Also within the genus Penicillium isolates were grouped according to species identification – P. glabrum and P. miczynskii separately, and two isolates simultaneously verified as P. bialowiezense and P. brevicompactum together. Similarly, Sclerotinia isolates were clearly distinguished as S. trifoliorum and S. sclerotiorum.
Some results of the BLASTn analysis were not correct. A few of our isolates, successfully identified to the species level, additionally showed 100% identity with sequences described in the database as an isolate from Ascomycota, belonging to one of the families, or even as “uncultured fungus” or “fungal sp.”
Despite efforts aimed at purifying colonies, through repeated DNA isolation and sequencing several times, it was not possible to classify two isolates into any taxonomic unit, due to the presence of degenerate nucleotides. Three isolates remained unidentified due to their 100% compatibility of their sequence with few different species. An example was a nonsporulating isolate whose sequence matched 100% to Phacidiopycnis washingtonensis, Phoma mali, and Phacidium coniferarum (syn. Allantophomopsiella pseudotsugae).
Discussion
We were able to determine the species of nearly 80% of our isolates. Among them were those for which BLASTn analysis was potentially sufficient to identify a sequence with confidence; however, for most sequences, the analysis of additional data was helpful and complementary. Species identification of some isolates did not raise serious doubts, despite the fact that the nucleotide composition of their ITS sequences were identical to other single species of the same genus in databases or varied slightly between representatives of the same species. This was not surprising since ITS is known to show certain variability, even within species (Nilsson et al.,2008). An example in our population was S. polyspora, where one-two nucleotide differences among its sequences were also noted by Talgo et al. (2010).
Usually, observation of morphology is insufficient for species identification for most Alternaria spp. and molecular identification based on the primary fungal ITS barcode, and additional loci such as GPD, CAM, and/or ATP1A1 (Lawrence et al.,2013; Woudenberg et al.,2015) is necessary. However, A. tenuissima and A. alternata from the section Alternaria cannot be distinguished from each other only on the basis of their ITS regions (de Hoog & Horré,2002) and sequences of standard housekeeping genes, because molecular variation within this section is minimal (Andrew et al.,2009). Somma et al. (2019) suggested that the number of defined Alternaria species should be reduced and mentioned species, along with two other species, should be merged into the defined species A. alternata. Despite the morphological similarities within the genus Alternaria, for these two species, observation of sporulation is crucial because the light, golden-brown conidia that grow individually or in short chains, distinguish A. tenuissima from A. alternata which produces longer chains of dark brown conidia with shorter beaks (Domsch et al.,1980; Pastor & Guarro,2008). The possibilities of distinguishing A. alternata from the Alternaria section and A. infectoria from the Infectoriae section results from their relatively large diversity. There are suggestions to consider a taxonomic re-evaluation of the Infectoriae section that, for the morphology and genetics of the species included, could be defined as a different fungal genus from Alternaria (Somma et al.,2019).
Moreover, identification of C. cladosporioides based on ITS sequences should be supported by additional analysis. Bensch et al. (2018) described the ITS sequences of Cladosporium species as a locus with limited resolution below the genus level in contrast to analyses of partial ACTB and EEF1A1 sequences. Expectedly, our sequences were identical to other members of the C. cladosporioides complex, which consists of species with very similar morphology; however, surface ornamentation of conidia within this complex species is quite variable (Barron,1972).
Host specialization may be a useful diagnostic feature for some species that develop on plants. We could have excluded Botrytis elliptica and B. tulipae, which, in contrast to polyphagous B. cinerea, are specialized pathogens, respectively, of lily and tulip (van Baarlen et al.,2004; Williamson et al.,2007). Considering the origin, we could clarify the identification of Lophodermium species isolated from symptomatic Pinus cembra needles. Reignoux et al. (2014) observed fruiting L. conigenum on broken branches, and L. pinastri, fruiting on naturally fallen needles; therefore, the origin of our isolate suggested L. pinastri.
Koukol et al. (2015), who analyzed the ITS rDNA region of species from this genus, found that at least five species can be recognized using the molecular basis, while all of those have been identified as L. pinastri on the basis of nonmolecular characteristics. In addition, they noted genetic differences between and within species and considered identification based on ITS sequences to be complicated. Thus, variability among our isolates could suggest that they probably belonged to different species.
According to Crous et al. (2014) and Tanney and Seifert (2018), pine needles are colonized mainly by P. fennicum and P. lacerum. The sequence of our isolate obtained from needles differed from the sequence of these two species by 2 bp. For some fungi, interspecific and even intraspecific diversity occurs at the level of several nucleotides; however, among some Phacidiaceae taxa, interspecific and even intergeneric variation of ITS sequences is often low. Some Phacidium species differ by 2 bp, while others share identical ITS sequences but are morphologically distinct (Tanney & Seifert,2018). The probability that our isolate was a representative of P. fennicum or P. lacerum was doubtful, although its origin suggested such identification. For Tanney and Seifert (2018), host and conidia dimensions are important determinants of the species. RPB2 sequence analysis was also helpful in identification, because some species differ by over a dozen bp in this region.
Knowledge of origin may also be helpful in the identification of the Phoma exigua complex, within which the ITS region is considered to be insufficient to distinguish different species (Aveskamp et al.,2010). Marcinkowska (2016) reported the occurrence of five species of the genus Boeremia in Poland, out of 15 described by Aveskamp et al. (2010). Boeremia exigua is the most common and, unlike the other four, inhabits a wide spectrum of plants. This information, in addition to morphological details, was crucial to confirm the identification of B. exigua (P. exigua) indicated by BLASTn; however, probably in this case, the analysis of actin sequence would be appropriate. Aveskamp, Woudenberg, et al. (2009) noted that this gene can be considered for developing DNA barcodes for Phoma species.
Chaverri and Samuels (2003) believe that ITS regions may be of limited use in the characterization of Trichoderma spp. However, we identified the majority of our Trichoderma spp. isolates into species similar to Błaszczyk et al. (2011). Doubt in the identification of T. koningii, which was simultaneously classified to different species from the Viride clade grouping, apart from T. koningii, T. viridescens, and T. viride (Jaklitsch & Voglmayr,2015), may be due to the fact that an accurate species identification based on morphology is difficult and frequently results in the misidentification and propagation of errors in databases (Druzhinina et al.,2005). Samuels et al. (2006) noted that ITS sequences of T. koningii show a very low degree of variability and were used to develop a species-specific oligonucleotide barcode that was integrated into TrichOKEY. Robbertse et al. (2017), who analyzed Trichoderma spp. problematic in identification with ITS sequences, concluded that more attention should be given to single copy protein coding genes. Specific primers designed for some Trichoderma species, gathered from the literature by Kredics et al. (2018) would be useful in the confirmation of species identification based on the rDNA ITS sequence.
Aspergillus species are generally considered to be difficult to identify on the basis of ITS sequences due to their similarity to each other, as well as to intraspecies variation, e.g., in A. fumigatus and A. niger isolates. Within both species, the sequences of isolates can vary up to five nucleotides (Henry et al.,2000) Therefore, a secondary barcode or identification marker usually is recommended to identify an Aspergillus culture to the species level with confidence. Also, distinguishing A. niger from A. tubingensis can be confusing due to their similar morphology and habitat. Both species are darkly pigmented species from the genus Aspergillus section Nigri. SNPs analysis of the CAM sequences proved to be helpful in distinguishing these two species that together form an A. niger “aggregate” clade (Samson et al.,2014). In addition, Susca et al. (2007) developed species-specific primers based on the CAM gene that amplify fragments for A. niger only.
The morphological identification of Penicillium genus members is confusing and requires observation on diverse media and cultures under different temperature conditions (Visagie, Houbraken, et al.,2014) This is poor support for species differentiation based on ITS regions, which are also of little use for species identification (Schoch et al.,2012; Skouboe et al.,1999) and work well in qualifying strains to sections, and only sometimes enable species identification (Houbraken, Visagie, et al.,2014). For closely related P. bialowiezense and P. brevicompactum (Peterson,2004) isolates, the analysis of the TUBB locus could be decisive (Scott et al.,2008). Sometimes, the origin of the isolate can be informative. Penicillium glaucoalbidum is regarded as one of the causes of needle decay (van Maanen & Gourbiere,1997); thus, its origin from the air in the coniferous forest completed our results of morphology observation and BLASTn analysis.
Although the identification of Fusarium spp. based on the ITS region sequence is common, it may pose difficulties that were found over 20 years ago, before the ITS regions were recognized as the primary fungal barcode (O’Donnell & Cigelnik,1997; Schilling et al.,1996). Identification is usually supported by observation of morphological features and analysis of housekeeping genes, such as EEF1A1 and TUBB for F. lateritium or F. oxysporum (González et al.,2019; Vitale et al.,2011) or is specified in species-specific PCR, as for most of our isolates. Results of ITS analysis for F. avenaceum and F. tricinctum were confusing because BLASTn indicated both species as the query sequence. This is due to the very close relationship of species found by Turner et al. (1998). However, in this case, observation of conidia is an easy distinguishing tool. Microconidia are not a diagnostic feature for F. avenaceum, while they are abundant for F. tricinctum (Leslie & Summerell,2006).
According to Freeman et al. (2002), species within the Sclerotinaceae possess almost identical rDNA sequences; therefore, the identification of Sclerotinia spp. on the basis of ITS regions may be problematic, which is found for S. trifoliorum. Therefore, additional molecular analyses, including analysis of the TUBB gene, are recommended for the differentiation of S. sclerotiorum and S. trifoliorum (Baturo-Ciesniewska et al.,2017; Vleugels et al.,2012). Baturo-Ciesniewska et al. (2017) showed that S. trifoliorum ITS sequences may differ from each other by one nucleotide, with guanine or thymine in position 120, but position 376 is always cytosine. Sclerotinia sclerotiorum has thymine in both the positions. Therefore, these two species differ from each other by one nucleotide and rarely by two nucleotides. This was also found in this study and contradicts the findings of Njambere et al. (2008). Nonetheless, clover rot is caused by both the mentioned Sclerotinia species and the symptoms are identical (Vleugels et al.,2012); therefore, this feature cannot be helpful in this case.
The identification of some sequences may be confusing because the same species in the database are classified under two different names. This is an example of a problem that arises when species have obsolete, or synonymous names, and are hidden under previous classifications (Ashelford et al.,2005; Bidartondo,2008; Robbertse et al.,2017; Ryberg, Nilsson, et al.,2008) (see also Catalogue of Life and Index Fungorum databases). Work on the introduction of unified names, according to the “one fungus: one name” principle, was described by Wijayawardene et al. (2017).
It is commonly known that the taxonomic credibility in public sequence databases is not ideal (Binder et al.,2005; Bridge et al.,2005; Nilsson et al.,2006). Identity of query sequences with the sequences defined as an isolate from Ascomycota, “uncultured fungus,” or “fungal sp.” may be confusing. The reason for the presence of such unidentified or insufficiently identified sequences in databases is possibly because obtaining an accession number by depositing the sequences in a public database is necessary for publication in most international journals, as they require that all sequences used in the manuscript to be available in such databases (Ryberg et al.,2009). Additionally, identity of a query sequence with one clearly different subject in GenBank should raise doubts, as seen in the case where our A. alternata sequences were identical to one A. niger (MK461010) sequence, based on BLASTn analysis results. This suggests probably a misnomer of the MK461010 sequence. Henry et al. (2000) found intraspecies similarity within A. niger at the level of 99%. The similarity of the mentioned MK461010 to our A. niger, as well as to other A. niger sequences from the database, was at the level of 90%. The same level of similarity was found between A. alternata and A. niger sequences other than MK461010.
Whoever has deposited sequences in the NCBI database knows that the author of the sequence itself determines the species affiliation. The consequence of the introduction of incorrectly identified sequences is the propagation of errors and mistakes because users adopt incorrect species names (Ko Ko et al.,2011; Nilsson et al.,2012).
The ITS region was regarded as the most appropriate fungal DNA barcode across a broad spectrum of fungi and was not critically evaluated until 2012 (Kiss,2012; Xu,2016). To increase the precision and reliability of results, specialized identification is usually supported by analyses of the already mentioned additional genes encoding different regions. Available primers for many markers usually amplify a narrow taxonomic range and vary depending on the genus being investigated (Crous et al.,2015). Different researchers applied various primers for different fungal taxa. For instance, for amplification of the TUBB region in Phoma spp., primer pairs TUB2Fd/TUB4Rd or BT2Fw/BT4Rd are used (Aveskamp, Verkley, et al.,2009), while in Penicillium spp. and Aspergillus spp., Bt2a/Bt2b are used (Samson et al.,2014; Visagie, Hirooka, et al.,2014). Stielow et al. (2015) developed universal, high-fidelity primer pairs for amplification of the EEF1A1 gene as secondary DNA barcodes for the fungal kingdom, additional to ITS rDNA as a primary barcode. While the ITS sequence database is plentiful, in the case of EEF1A1 gene sequences there may be problems in practice due to a considerably smaller number of deposited sequences and the absence of a reference database (Meyer et al.,2019). Robbertse et al. (2017) concluded that studies on single copy protein coding genes or even whole genome sequences should be emphasized. Until a major effort is realized, ITS sequences will continue to play an important role in fungal identification and classification (Vu et al.,2019).
Although we finally identified nearly 80% of our isolates based on the ITS region sequence comparative analysis with databases and taking into account morphological features, isolate origin, and also in some cases, species-specific PCR results, we can summarize that it was very labor-intensive and we directly experienced the limitations associated with the analysis of ITS regions. However, we found out, in a practical way, that analysis of sequences from this region significantly contributes to the identification of Ascomycota members, but for most sequences, use of the ITS region should be considered as a method that suggests/indicates a species or genus and needs to be supported by additional microscopic and molecular analyses.
Handling Editor
Dorota Hilszczańska; Forest Research Institute, Poland; https://orcid.org/0000-0002-4363-704X
Authors’ Contributions
ABC: collecting samples, fungal isolation, DNA extraction, conducting molecular analyses, morphological identification, data interpretation and conclusions, idea of the manuscript, writing the manuscript; WP: collecting samples, fungal isolation, morphological identification; KP: collecting samples, fungal isolation, morphological identification
