. Introduction
The intensification of crop management practices, including the extensive use of mineral fertilizers (Erisman et al., 2008; Tilman et al., 2002), has led to major increases in crop yields (Lu & Tian, 2017; Tilman et al., 2002; Cassman, 1999). Mineral fertilizers, commonly composed of ammonium nitrate, phosphates, and potassium salts, are used at the field scale to compensate for nutrient exports. However, the excessive and widespread use of mineral fertilizers is a major driver of changes in agricultural ecosystem dynamics (Storkey et al., 2010; Zhang et al., 2015). The application of fertilizers alters the nutrient limitations of vegetation subject to their effects (Aerts et al., 2003), leading to various environmental concerns related to ecosystem eutrophication (Cassman, 1999; Moss, 2008).
Weeds represent a significant challenge to crop yields in agricultural systems worldwide (Marshall et al., 2003), but due to their position on the base of the agroecosystems’ food chains, weeds also play a crucial role in supporting biodiversity within those ecosystems (Marshall et al., 2003; Storkey, 2006). Understanding weed responses to soil fertility levels is essential for guiding fertilizer strategies within integrated weed management (Di Tomaso, 1995) and for supporting both biodiversity conservation and alternative control methods (Travlos et al., 2018).
Mineral fertilizers can exert direct effects, depending on their dose and type, as well as indirect effects on weed flora by increasing crop competitiveness (Anderson et al., 1998; Cordeau et al., 2021; Pyšek & Lepš, 1991). Mineral fertilizers were shown to influence weed density and biomass (Anderson et al., 1998; Berquer et al., 2023; Little et al., 2021; Simard & Ziadi, 2024; Sweeney et al., 2008), as well as the floristic composition of the weed flora (Carlesi et al., 2020; Jiang et al., 2024; Moss et al., 2004; Pyšek & Lepš, 1991; Simard & Ziadi, 2024; Tang et al., 2014). The interactions between mineral fertilizer elements are crucial, as their combined effects can differ from their individual impacts (Marschner, 1995).
Nitrogen is the most critical nutrient supplied to crops (Sweeney et al., 2008) and is essential for protein synthesis, photosynthetic activity and vegetative development (Hawkesford, 2014; Kang et al., 2023). Therefore, nitrogen availability and uptake are critical factors regulating plant growth and seed production, with significant implications for the survival of spontaneous species and crop yields (Lawlor, 2002). Most weeds are highly efficient in nitrogen uptake (Blackshaw et al., 2003; Kumar et al., 2024), yet plant species vary in their nitrogen requirement, which partially explains their occupation of different ecological niches. Nitrophily significantly influences plant community variation along soil nitrogen gradients and has been shown to drive changes in weed communities, particularly during agricultural intensification (Smart et al., 2003). Research has shown significant differences in nitrophily and growth responsiveness to nitrogen among weed species (Blackshaw & Brandt, 2008; Kousta et al., 2023), as indicated by a plant nitrophily index, which correlates with the Ellenberg N score that reflects habitat preference (Moreau et al., 2013; Perthame et al., 2022). Consequently, nitrogen fertilizers tend to reduce the diversity of oligotrophic weed species, favoring nitrophilous species and thus homogenizing the flora in the field (Berquer et al., 2023; Pyšek & Lepš, 1991).
In contrast to nitrogen, the phosphorus available to plants represents only a small fraction of the total present in the soil (Gallet et al., 2003). Phosphorus promotes root and shoot development of weeds but the magnitude of response is species-specific (Blackshaw et al., 2004; Blackshaw & Molnar, 2009). Research indicates that weeds exhibit greater sensitivity to phosphorus levels compared to potassium levels (Freyman et al., 1989; Hoveland et al., 1976). Potassium is involved in the regulation of many metabolic processes, such as photosynthesis and plants’ ability to resist pest attack (Maurya et al., 2014). Potassium fertilizers can also lead to an increase in weed density and modify the composition of the flora in cultivated soil (Everaarts, 1992).
The evolution of soil fertility and weed flora composition is a slow and complex process to demonstrate (Esposito et al., 2023; Koocheki et al., 2009; Shekhar et al., 2014). The relative paucity of weed flora in intensive systems where herbicide use is regular can also make flora changes more difficult to demonstrate in the field. Furthermore, a detailed characterization of the weed flora must consider both the realized flora, i.e., that observed within the crop, and the potential flora, i.e., “all viable seeds present on or in the soil or associated litter” (Simpson et al., 1989), which reflects both the accumulation of a seed and bud bank and its potential future development (Mahé et al., 2021). The realized flora is influenced by the stochastic events of a given year, whereas the potential flora composition reflects the long-term cumulative effects of field management (Albrecht, 2003; Menalled et al., 2001). Consequently, the potential flora reflects the historical, current, and potential future dynamics of annual weed communities (Mahé et al., 2021). While the effects of farming practices on realized flora are well documented, the composition of the potential flora is less frequently characterized (Pan et al., 2020; Rotchés-Ribalta et al., 2017). Pan et al. (2020) investigated the long-term effects of mineral fertilization on the soil weed seed bank and demonstrated that mineral fertilization tends to decrease the species richness of the weed seed bank. Combining field vegetation surveys with the analysis of soil seedling emergence under controlled conditions provides an understanding of the link between potential and realized flora. Indeed, as only 4 to 15% of the weed seed bank typically germinates each year in arable fields (Ball & Miller, 1989), this limited germination underscores the need to examine both components to fully capture the weed community’s diversity and dynamics. Moreover, following the community assembly theory, examining ecological characteristics rather than species alone may provide further insights into plant community dynamics (Booth & Swanton, 2002).
Another major challenge in studying the fertilization impact on weed flora is isolating its effects from other agricultural practices, as experiments focusing solely on fertilizers are rare. These difficulties can be countered by various experimental approaches. Long-term experimental trials allow the analysis of slow ecosystem processes while limiting sources of uncontrolled variation (Min et al., 2018; Tang et al., 2014; Yin et al., 2005). For example, the Broadbalk wheat experiment, initiated in 1843 in the United Kingdom, is one of the earliest long-term agronomic trials. It highlights the importance of such studies in understanding ecological and agronomic processes essential for sustainable agriculture (Poulton et al., 2024). This experiment has, among other objectives, investigated the effects of prolonged fertilization treatments on the weed flora in winter wheat systems managed without chemical control (Moss et al., 2004).
The present study was conducted within the framework of a long-term experiment that has been running for over a century, making it one of the longest-running investigations into the effects of differential mineral fertilizer applications (N, P, K) on crops. The fertilization treatments evaluated in this study include NK (combination of nitrogen- and potassium-based fertilizers), NP (combination of nitrogen- and phosphorus-based fertilizers), NPK (combination of nitrogen-, phosphorus-, and potassium-based fertilizers), PK (combination of phosphorus- and potassium-based fertilizers), and an unfertilized Control. The objective of this study is to evaluate the impact of long-term combinations of nitrogen, phosphorus, and potassium fertilizers on weed species communities, considering both the realized and potential flora. Our overarching hypothesis is that differential long-term fertilizer regimes have driven a divergence in the weed flora composition, both in the standing vegetation and in the soil seed bank. Specifically, we aim to 1) compare weed species richness, density, and composition between NK, NP, NPK, PK, and Control (no fertilization) treatments; 2) test if nutrient-rich treatments host more nitrophilous weed communities; and 3) investigate the similarity between the potential and realized weed flora.
. Materials and methods
. Long-term experimental trial
The study was conducted within a 0.5-ha long-term trial initiated in 1896 at the Gembloux Agro-Bio-tech faculty (50° 33’ 50.78’’ N lat, 4° 41’ 55.49’’ E long) (Belgium) on silty loamy soil and under an oceanic temperate climate with an average annual temperature of 10.3°C and precipitation of 864 mm per year (Climate Wallonia, 2025). The primary objective of this trial was to determine whether pure mineral fertilization of monoculture could replace crop rotations in maintaining the production potential. The experimental design was based on Liebig’s law of minimum (Van der Ploeg et al., 1999), which states that plant growth is constrained by the scarcest essential nutrient, regardless of the abundance of others. Five fertilization treatments are compared: no fertilizer and various combinations of N, P, and K.
Initially, between 1896 and 1931, the experiment was focused on the comparison of potato (Solanum tuberosum L.) crop monoculture with three other monocultures: mustard (Brassica juncea (L.) Czern.), faba bean (Vivia faba L.), and rye (Secale cereale L.). In the second phase, the experiment was dedicated to the comparison of potato crop monoculture with potatoes under crop rotations (1930–1974). Since 1975, winter wheat (Triticum aestivum L.) has been cultivated continuously across the entire trial area, and the experiment has focused solely on the comparison of fertility potential. While similar fertilization treatments have been applied since the initiation of the experiment in 1896, the precise fertilizer doses were adapted to match the crop production potential. In the present trial, optimal rates of essential nutrients were supplied, with K2O at 160 kg ha–1 (as potassium chloride), P2O5 at 120 kg ha–1 (as triple superphosphate), and N at 150 kg ha–1 (as ammonium nitrate). In the Control treatment, no fertilizer has been applied at any point since the establishment of the trial (1896). Specific application rates and timing of fertilizers applied on winter wheat are detailed in Table 1 for each treatment. According to recent work by El-Mejjaouy et al. (2025), soil analyses conducted after harvest (November 2020) revealed substantial variation in soil nutrient concentrations among the fertilization treatments. Available P ranged from ca. 55 mg kg–1 in NK to ca. 130 mg kg–1 in PK, while total P increased from ca. 750 mg kg–1 (NK) to >1000 mg kg–1 (NPK, PK). Total N remained relatively stable across treatments (0.09–0.10%), with a slight increase under NPK. Potassium levels showed the strongest response to K addition, rising from ca. 110 mg kg–1 in NP to >330 mg kg–1 in PK. Herbicides are applied uniformly once per season, without additional weeding. The herbicide application history, including compounds and active ingredients used over the past decade, is summarized in Supplementary Tables S1 and S2. To prevent contamination between plots and ease block identification, the plot edges are treated regularly with non-selective herbicides. All plowing and crop protection operations are conducted as usual, except for the fertilizer applications.
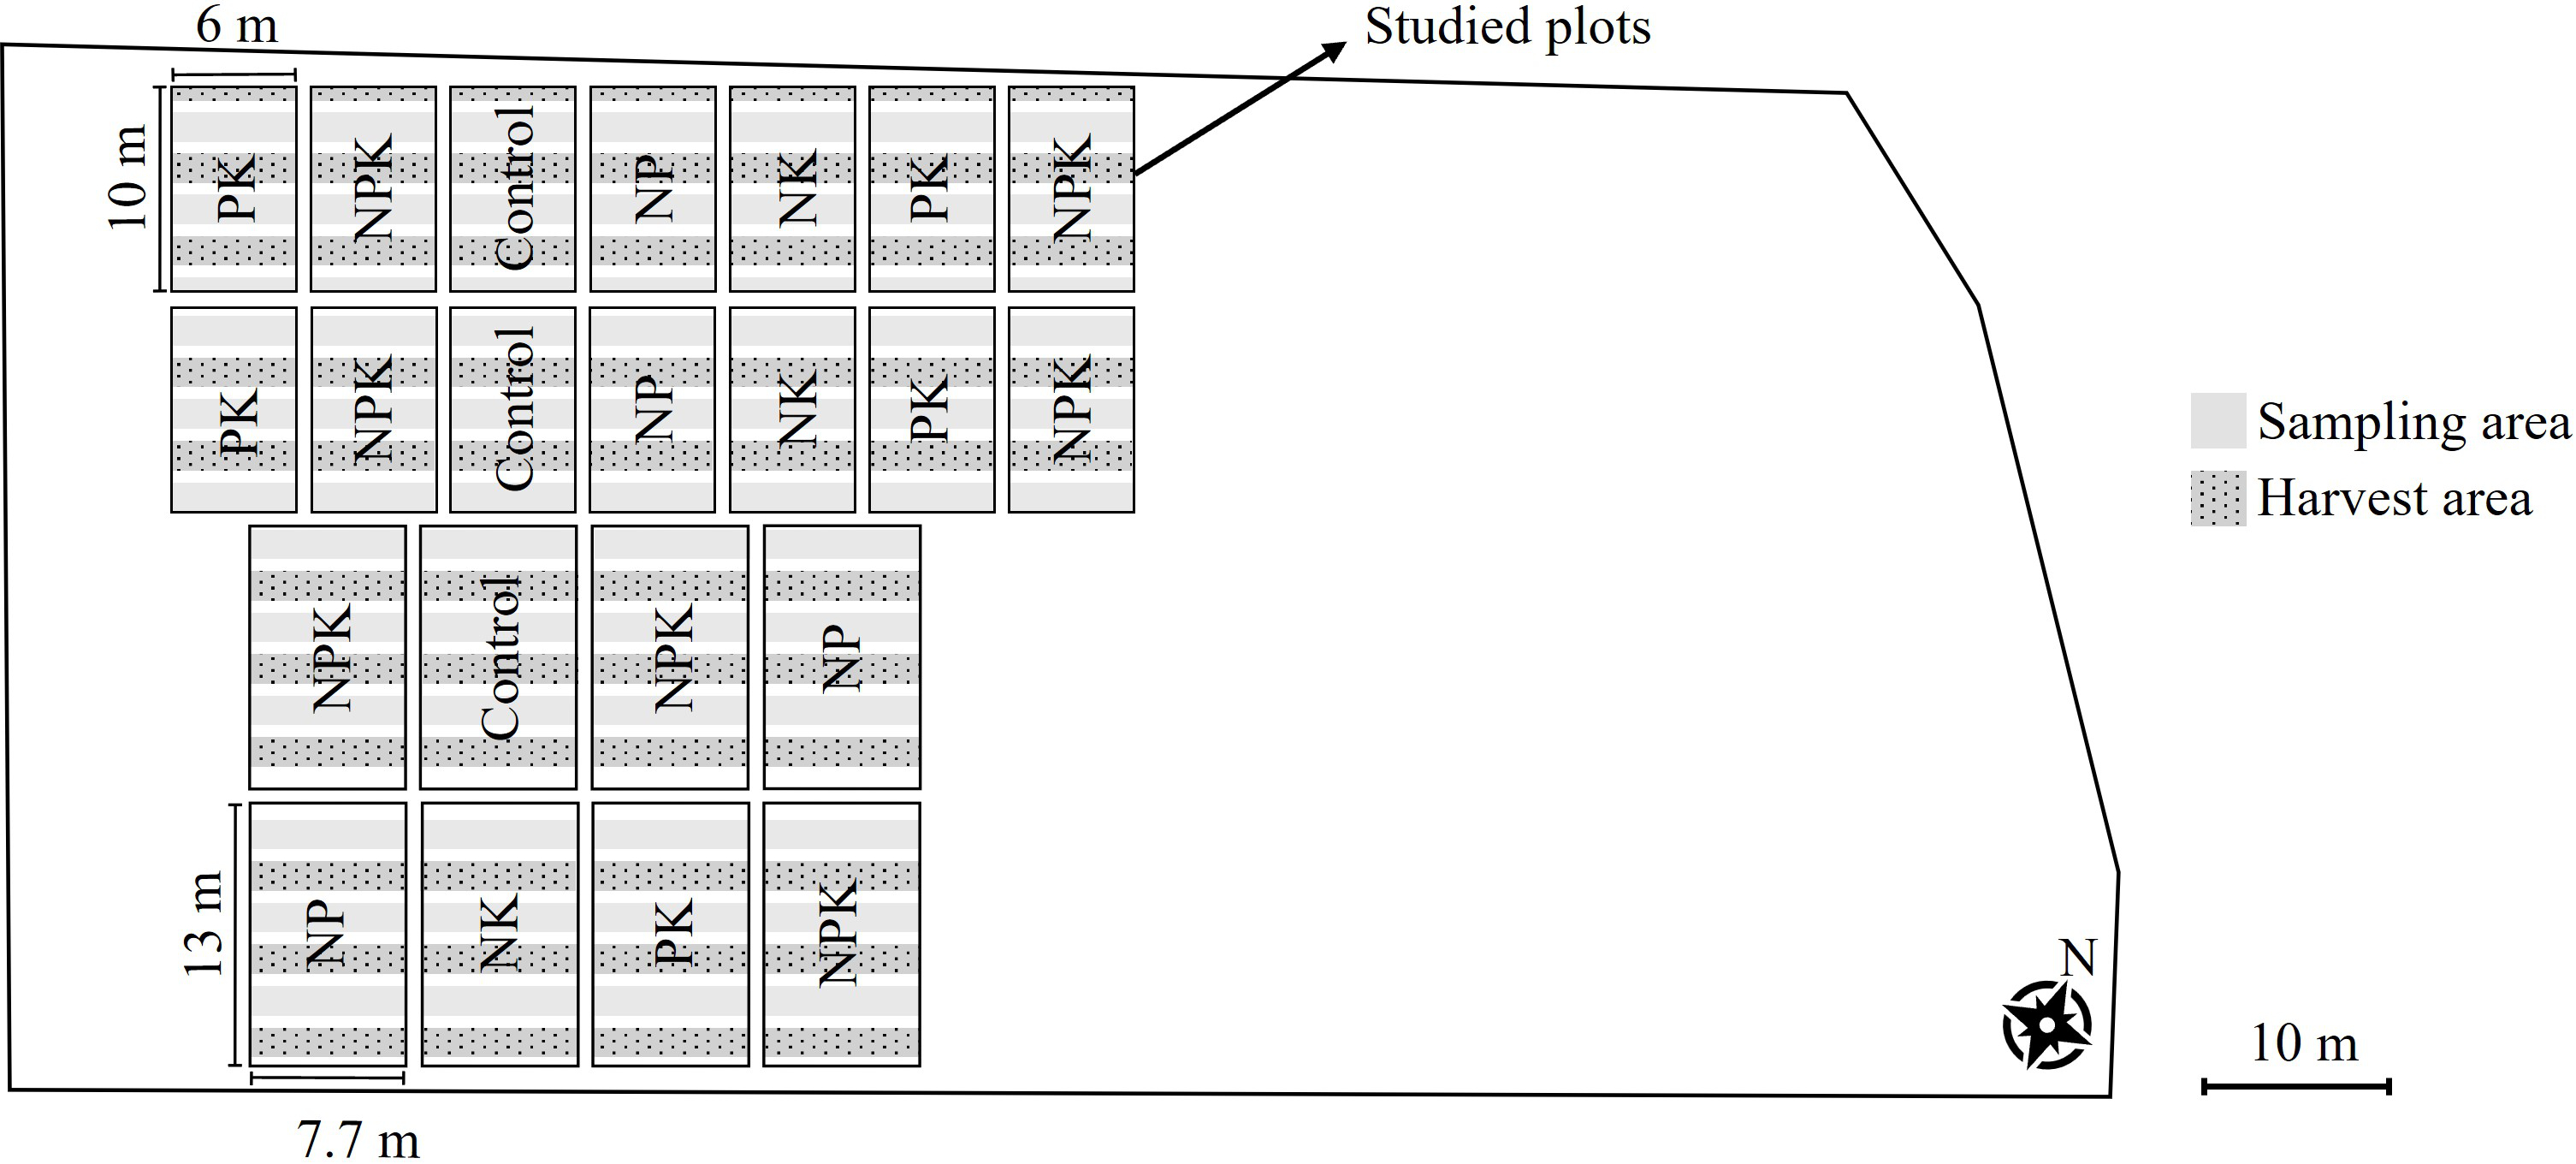
Two sections of the trial co-exist on the experiment site (Figure 1). The first section consisted of two sets of ten plots, each measuring 6 × 10 m, further subdivided into five microplots (6 × 2 m). However, in 2015, the construction of new infrastructure resulted in the destruction of the first three pairs of plots (on the left side of Figure 1). The second section included 12 plots measuring 13 × 7.7 m and divided into six microplots (7.7 × 2 m), with three designated for harvest and three for sampling. In this section, the first four plots were also destroyed due to infrastructure development (on the left side of Figure 1).
The present study was conducted on a 0.14 ha area covering the retained plots.
During the studied growing-season (2020–2021), winter wheat was sown uniformly at a density of 400 grains m–2 on November 13, 2020. Herbicide was applied on April 19, 2021, consisting of 0.3 kg ha–1 of product (9 g kg–1 Iodosulfuron-methyl-sodium, 47 g kg–1 Mesosulfuron-methyl-sodium (45 g kg–1 Mesosulfuron-methyl), 23.75 g kg–1 Thiencarbazone-methyl-sodium (22.5 g kg–1 Thiencarbazone-methyl), 135 g kg–1 Mefenpyr-diethyl (Safener)). Herbicides were applied with an adjuvant consisting of 1 liter per hectare (L ha–1) of 842 g L–1 esterified rapeseed oil. Fertilizers were applied on March 13, April 14, and June 2, 2021. The crop was harvested on August 26, 2021. The application rates of mineral fertilizers are described in Table 1.
Table 1
Fertilizer application rates (expressed as N, P₂O₅, and K₂O), timing, and winter‑wheat grain yield (15 % humidity) for each fertilization treatment applied during the 2020–2021 growing season.
. Weed flora sampling
Since the trial involves an unequal number of plots per treatment (Figure 1), and all plots within a given treatment can be considered homogeneous due to the identical treatment practices since 1896 and their proximity to each other (sharing exactly the same pedoclimatic conditions), stratified sampling was used, with each fertilization treatment treated as a separate stratum.
Figure 1
Scheme of the current experimental design. The large polygon is cultivated uniformly with winter wheat, similar to the studied plots. Individual plots within the trial are subjected to different fertilization treatments.
For each treatment (NK, NP, NPK, PK, and the Control), nine 50 × 50 cm quadrats were randomly placed across the retained plots. A survey of the realized flora was conducted in the quadrats before the first weeding operation, from April 7 to April 18, 2021, during which each weed plant was identified and counted. Total density was expressed as the number of weed individuals per square meter. Concerning the potential flora analysis, a composite soil sample was collected from each quadrat during the same period by pooling four samples, each taken with a 2 cm diameter and 20 cm depth soil auger, from the four corners of the quadrat. After collecting, soil samples were stored in a cold room at 4°C for one to three weeks prior to the setup of the seedbank experiment. The potential flora composition was assessed using the seedling emergence method. Soil samples were spread on seedling trays (20 cm × 30 cm × 12 cm) over potting mix. Seedling emergence was monitored in a room at 18–20°C with an average light intensity of 570 lux; from April 15 to July 15, 2021. Trays were kept water-saturated by watering them twice a week. All emerging seedlings were identified following Mamarot and Rodriguez (2014), counted, and removed. Total density was then calculated based on the dimensions of the soil auger and expressed as the number of individuals per square meter. Specific mean densities in the realized and potential flora across fertilization treatments are provided in Supplementary Tables S3 and S4.
. Statistical analysis
The realized and potential flora were analyzed separately to compare species composition and weed density in communities subjected to different long-term fertilization treatments. Each species was characterized by its germination period to assess whether germination seasonality affects weed community composition. Germination periods were obtained from Mamarot and Rodriguez (2014) and the EcoFlora database (Fitter & Peat, 1994).
Species diversity of the communities was assessed by calculating the mean number of species in each treatment (species richness) using the vegan package (Oksanen et al., 2024). One-way ANOVA on the total weed density and species richness according to the fertilization treatment was conducted, followed by Tukey’s post-hoc test for significant group differences. To meet the assumption of residual normality, the weed density data for both the realized and potential flora were log-transformed.
Non-metric multidimensional scaling (NMDS) ordinations were performed using the metaMDS() function of the vegan package (Oksanen et al., 2024) to visualize variations in community structure among fertilization treatments for both the realized and potential flora data. Species density values were used to calculate Bray-Curtis dissimilarity, with 500 restarts set to halt iterations. The significance of fertilization treatments in shaping community structure was tested with a permutation-based multivariate analysis of variance (PERMANOVA) on the Bray-Curtis distance matrix, with 999 permutations, implemented via the adonis() function from the vegan package (Oksanen et al., 2024). Pairwise comparisons between treatments were conducted using the pairwise.adonis() function from the vegan package (Oksanen et al., 2024).
To test if mineral fertilization promotes a more nitrophilous weed flora, community weighted means (CWMs) of Ellenberg nitrogen indicator values were calculated as follows:
where n is the total number of species per quadrat, i is the identifier of a single species, El is the Ellenberg nitrogen indicator value (Ellenberg, 1974) from Fitter and Peat (1994), and P is the relative abundance of the species (density of species i divided by the total weed density of the quadrat). CWMs of the different fertilization treatments were compared using a non-parametric Kruskal-Wallis test (Ostertagová et al., 2014), followed by Dunn’s post-hoc to assess significant group differences. This analysis was performed separately for both the realized and potential flora using the FSA package (Ogle et al., 2023).
The proportions of weed species density for the realized and potential flora under different fertilization treatments were visualized using a stacked bar chart, enabling the analysis of differences between the realized and potential flora across treatments. For each treatment, the proportion of a given species was calculated by dividing its mean density by the total mean density. Germination periods were, once more, included in the analysis.
All statistical analyses were performed in R, version 4.3.2 (R Core Team, 2013), and p = 0.05 was taken as the threshold for significance.
. Results
Regarding the realized flora, mean weed density in the PK (199.6 ± 67.6) and Control (264.4 ± 52.1) treatments was significantly higher than in all the N-fertilized plots (NK = 124.9 ± 47.0; NP = 101.8 ± 22.7; NPK = 120.0 ± 54.7) (p < 0.001) (Figure 2). However, no significant differences in mean weed density were observed for the potential flora (mean weed density = 12484.78 ± 6374.11, p-value = 0.511). In terms of species richness, no significant differences were found between the treatments for either the realized (mean species richness = 5.11 ± 1.071, p = 0.357) or potential flora (mean species richness = 6.044 ± 2.28, p = 0.699). In the realized flora, mean species richness ranged from 4.8 ± 1.2 species in the NK treatment to 5.7 ± 0.9 species in the Control. For the potential flora, values ranged from 5.4 ± 1.9 species in the NK treatment to 7.0 ± 2.5 species in the Control. Mean species richness and density across fertilization treatments, including standard deviation and range values, are provided in Supplementary Tables S5 and S6 for both the realized and potential flora.
Figure 2
Weed species density of realized flora in winter wheat across fertilization treatments. Vertical bars represent standard deviation (n = 9). Different letters indicate significant differences among treatments (Tukey’s test, p < 0.05). The right panel shows temporal patterns of seed germination for each species across seasons, with colors matching those used in the left panel. The species germination times provide additional information to interpret the results and will be addressed in the discussion section. Species names are represented using EPPO codes (https://gd.eppo.int/).
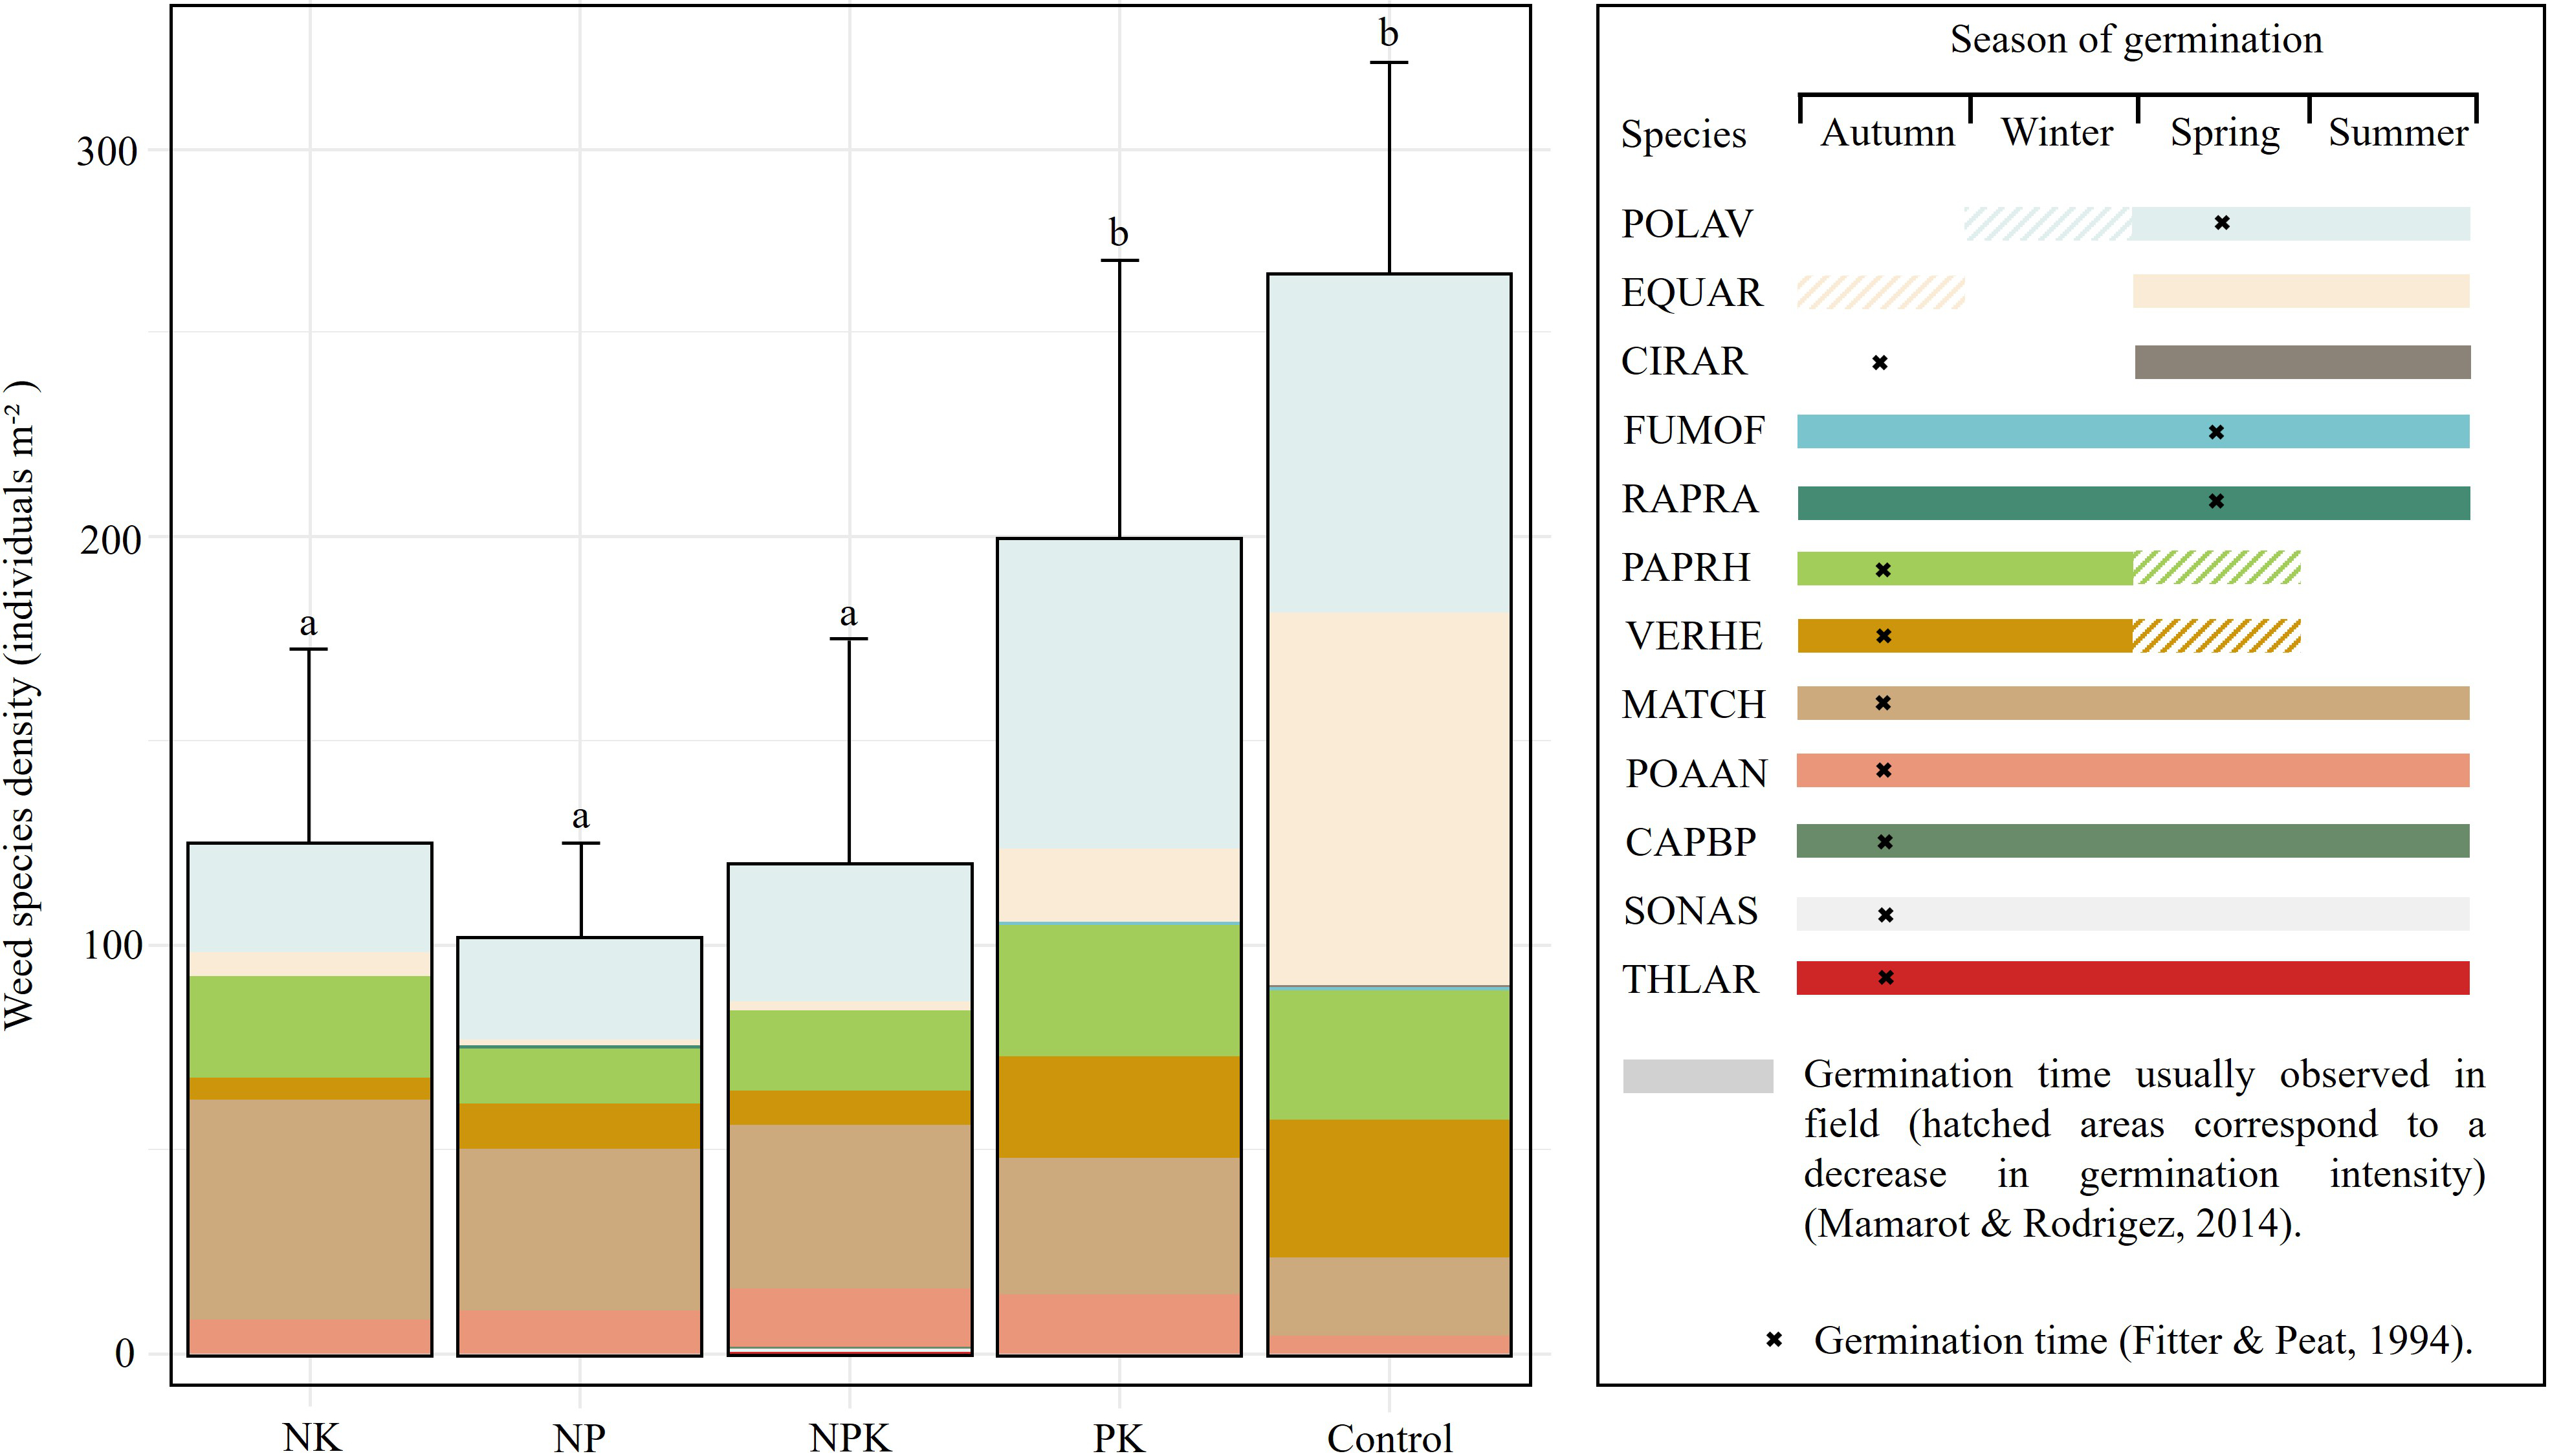
A total of 12 weed species from seven botanical families were identified in the realized flora, with species composition varying across the treatments (Supplementary Table S3). The stacked bar chart (Figure 2) illustrates the relative contribution of different species, while the right-hand panel highlights their germination periods throughout the year, revealing notable temporal diversity. Some species, such as Polygonum aviculare L. (POLAV) and Equisetum arvense L. (EQUAR), germinate primarily in spring, whereas others, e.g., Fumaria officinalis L. (FUMOF) and Raphanus raphanistrum L. (RAPRA), exhibit extended germination periods from fall to spring. However, the majority of species in the realized flora, including Thlaspi arvense L. (THLAR), Papaver rhoeas L. (PAPRH), Veronica hederifolia L. (VERHE), Matricaria chamomilla L. (MATCH), Poa annua L. (POAAN), Capsella bursa-pastoris (L.) Med. (CAPBP), and Sonchus asper (L.) Hill. (SONAS), display a germination peak during autumn.
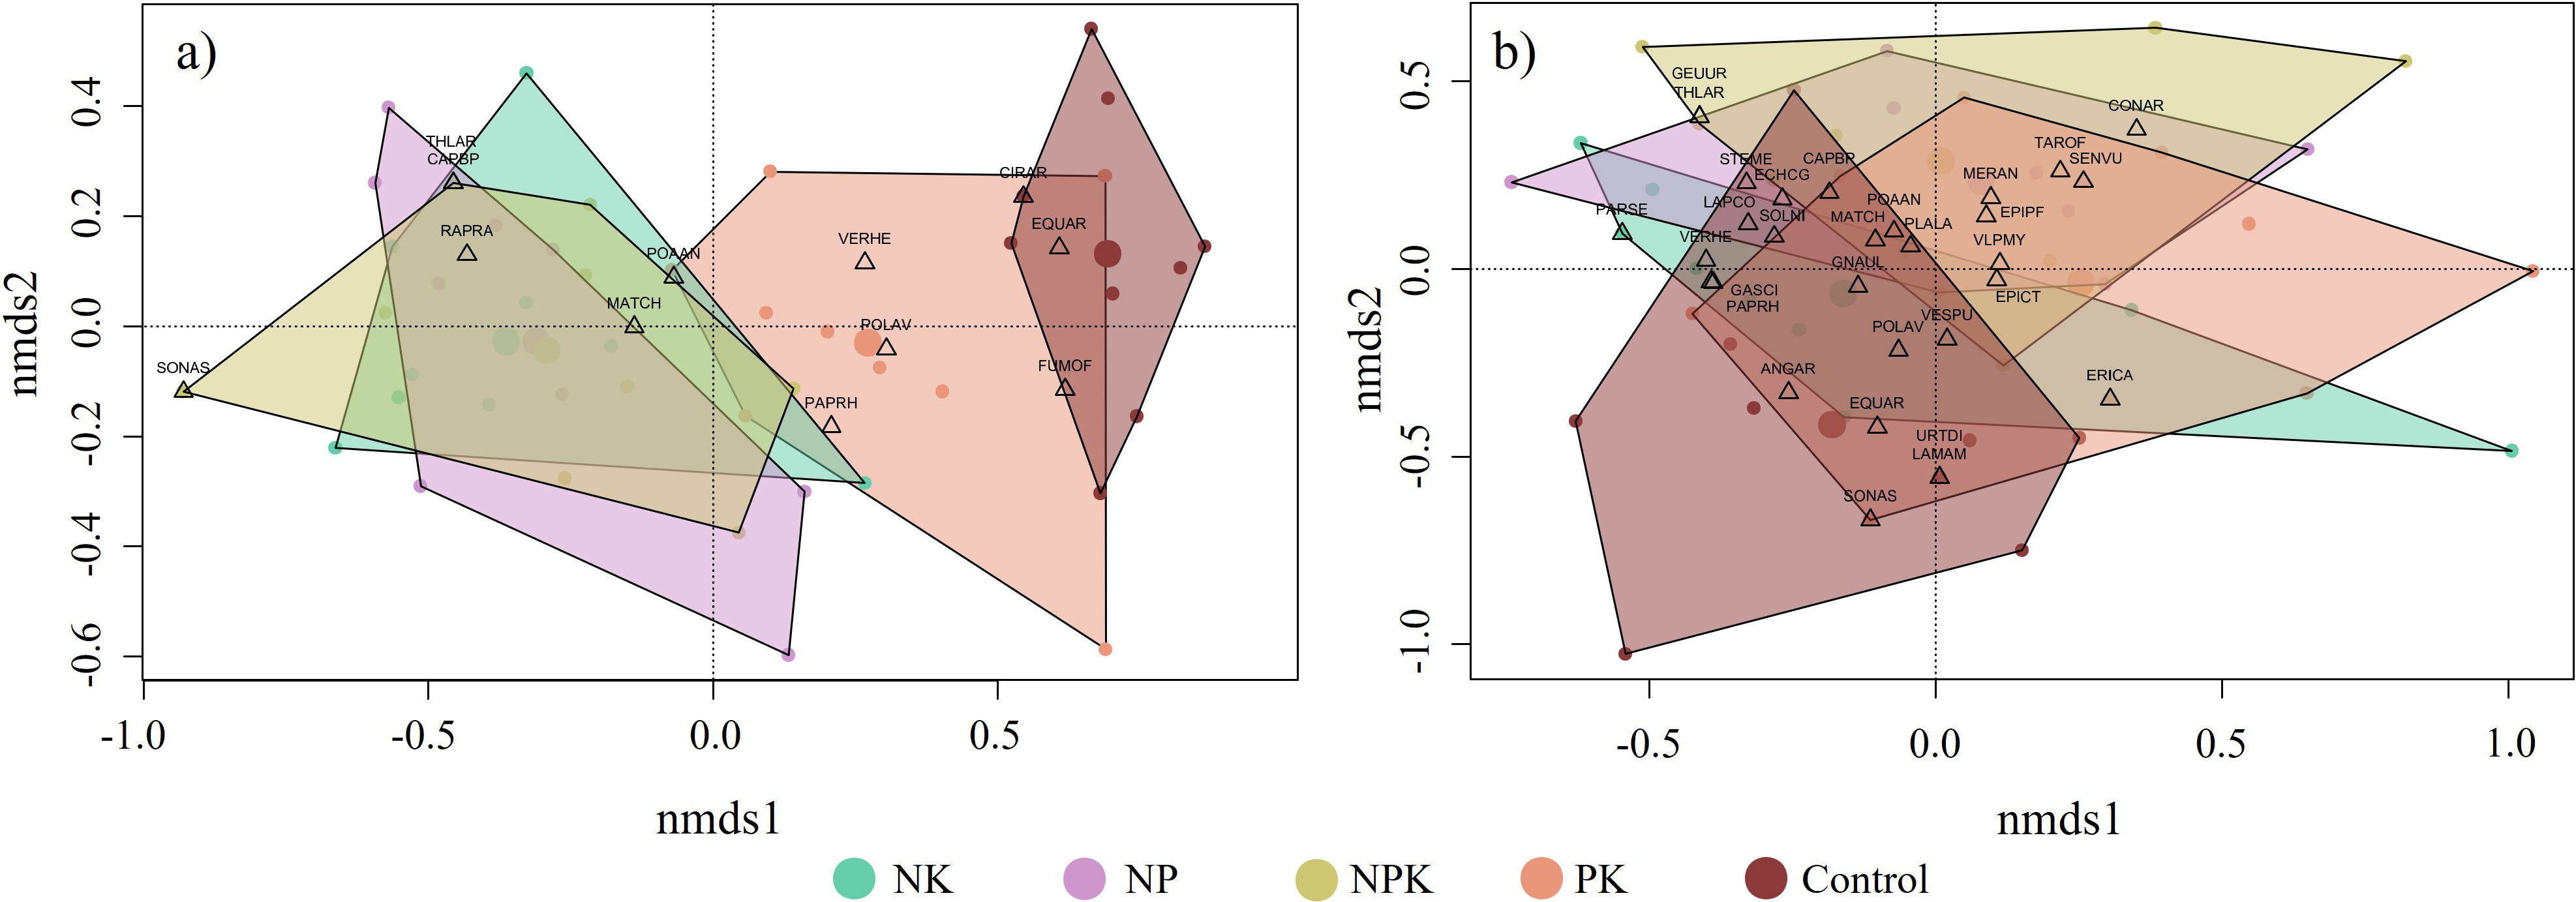
The NMDS analysis reveals distinct community structure patterns across different fertilization treatments in both the realized (k = 2, stress = 0.1573, non-metric fit (R2) = 0.862) (Figure 3a) and potential flora (k = 2, stress = 0.2343, non-metric fit (R2) = 0.659) (Figure 3b). Regarding the realized flora, PERMANOVA results confirm this significant effect of fertilization on community structure (R2 = 0.442, F = 7.914, p < 0.001). Indeed, pairwise comparisons show that the Control treatment displays a distinct community structure compared to the N-fertilized treatments (adjusted p < 0.05), while the PK treatment exhibits an intermediate structure being significantly different from the NPK and NK treatments (adjusted p < 0.05). The NMDS analysis also highlights significant associations between particular species and fertilization treatments, with EQUAR linked to the Control treatment and POLAV associated with the PK treatment. Species associated with nitrogen-containing treatments include MATCH, THLAR, and CAPBP. Regarding the potential flora, the community differentiation according to the fertilization treatment is less pronounced. Indeed, the PERMANOVA results (R2 = 0.170, F = 2.0524, p < 0.001) indicate that the fertilization treatments explain a smaller proportion of variance in the potential compared to the realized flora, as reflected in the R2 values. Nevertheless, non-fertilized weed communities tend to be distinct from those subjected to mineral fertilization, as indicated by pairwise comparisons showing significant differences between the Control treatment and the NK, NPK, and PK treatments (adjusted p < 0.05).
Figure 3
Non-metric Multidimensional Scaling (NMDS) ordination of the realized (a) and potential (b) flora communities based on density data under different fertilization treatments. Each color represents a fertilization treatment, dots represent communities surveyed in a 50 × 50 cm plot, and species are represented by triangles. The centroid of each treatment is shown as a large dot. Species names are represented using EPPO codes (https://gd.eppo.int/).
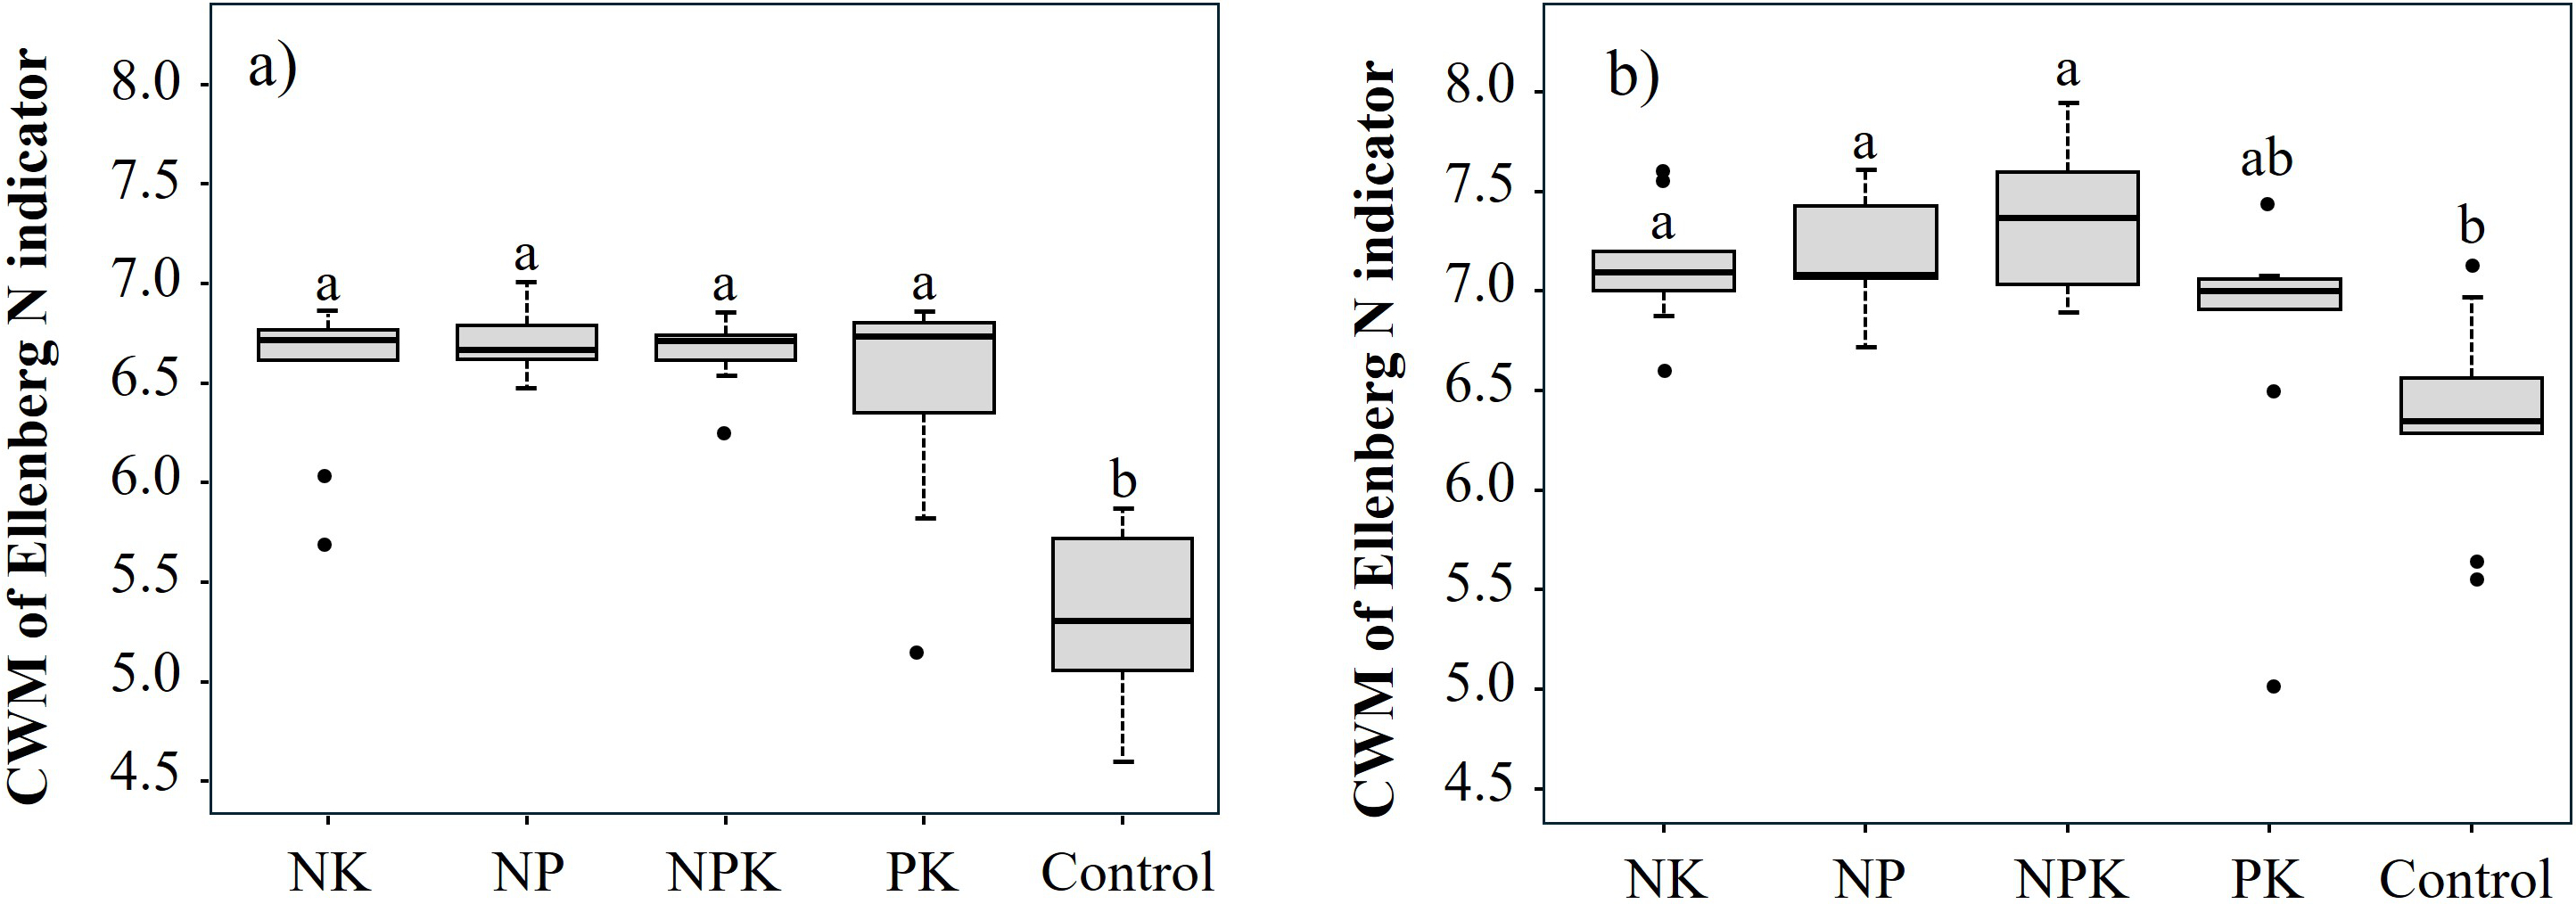
Regarding the realized flora, the CWM of the Ellenberg N indicator was significantly lower in the Control treatment (5.33 ± 0.432) than in the fertilized treatments (NK = 6.55 ± 0.380; NP = 6.70 ± 0.156; NPK = 6.67 ± 0.166; PK = 6.45 ± 0.577) (p < 0.001) (Figure 4a). A similar trend was observed in the potential flora, with the PK treatment showing an intermediate CWM value (6.76±0.702) between the nitrogen-fertilized treatments (NK = 7.13 ± 0.311; NP = 7.18 ± 0.282; NPK = 7.33 ± 0.357) and the Control (6.35 ± 0.500) (p < 0.01) (Figure 4b).
Figure 4
Boxplots of Ellenberg N indicator value (Fitter & Peat, 1994) community weighted means for the realized (a) and potential (b) flora across fertilization treatments. Different letters indicate significant differences among treatments (Dunn’s test, p < 0.05).
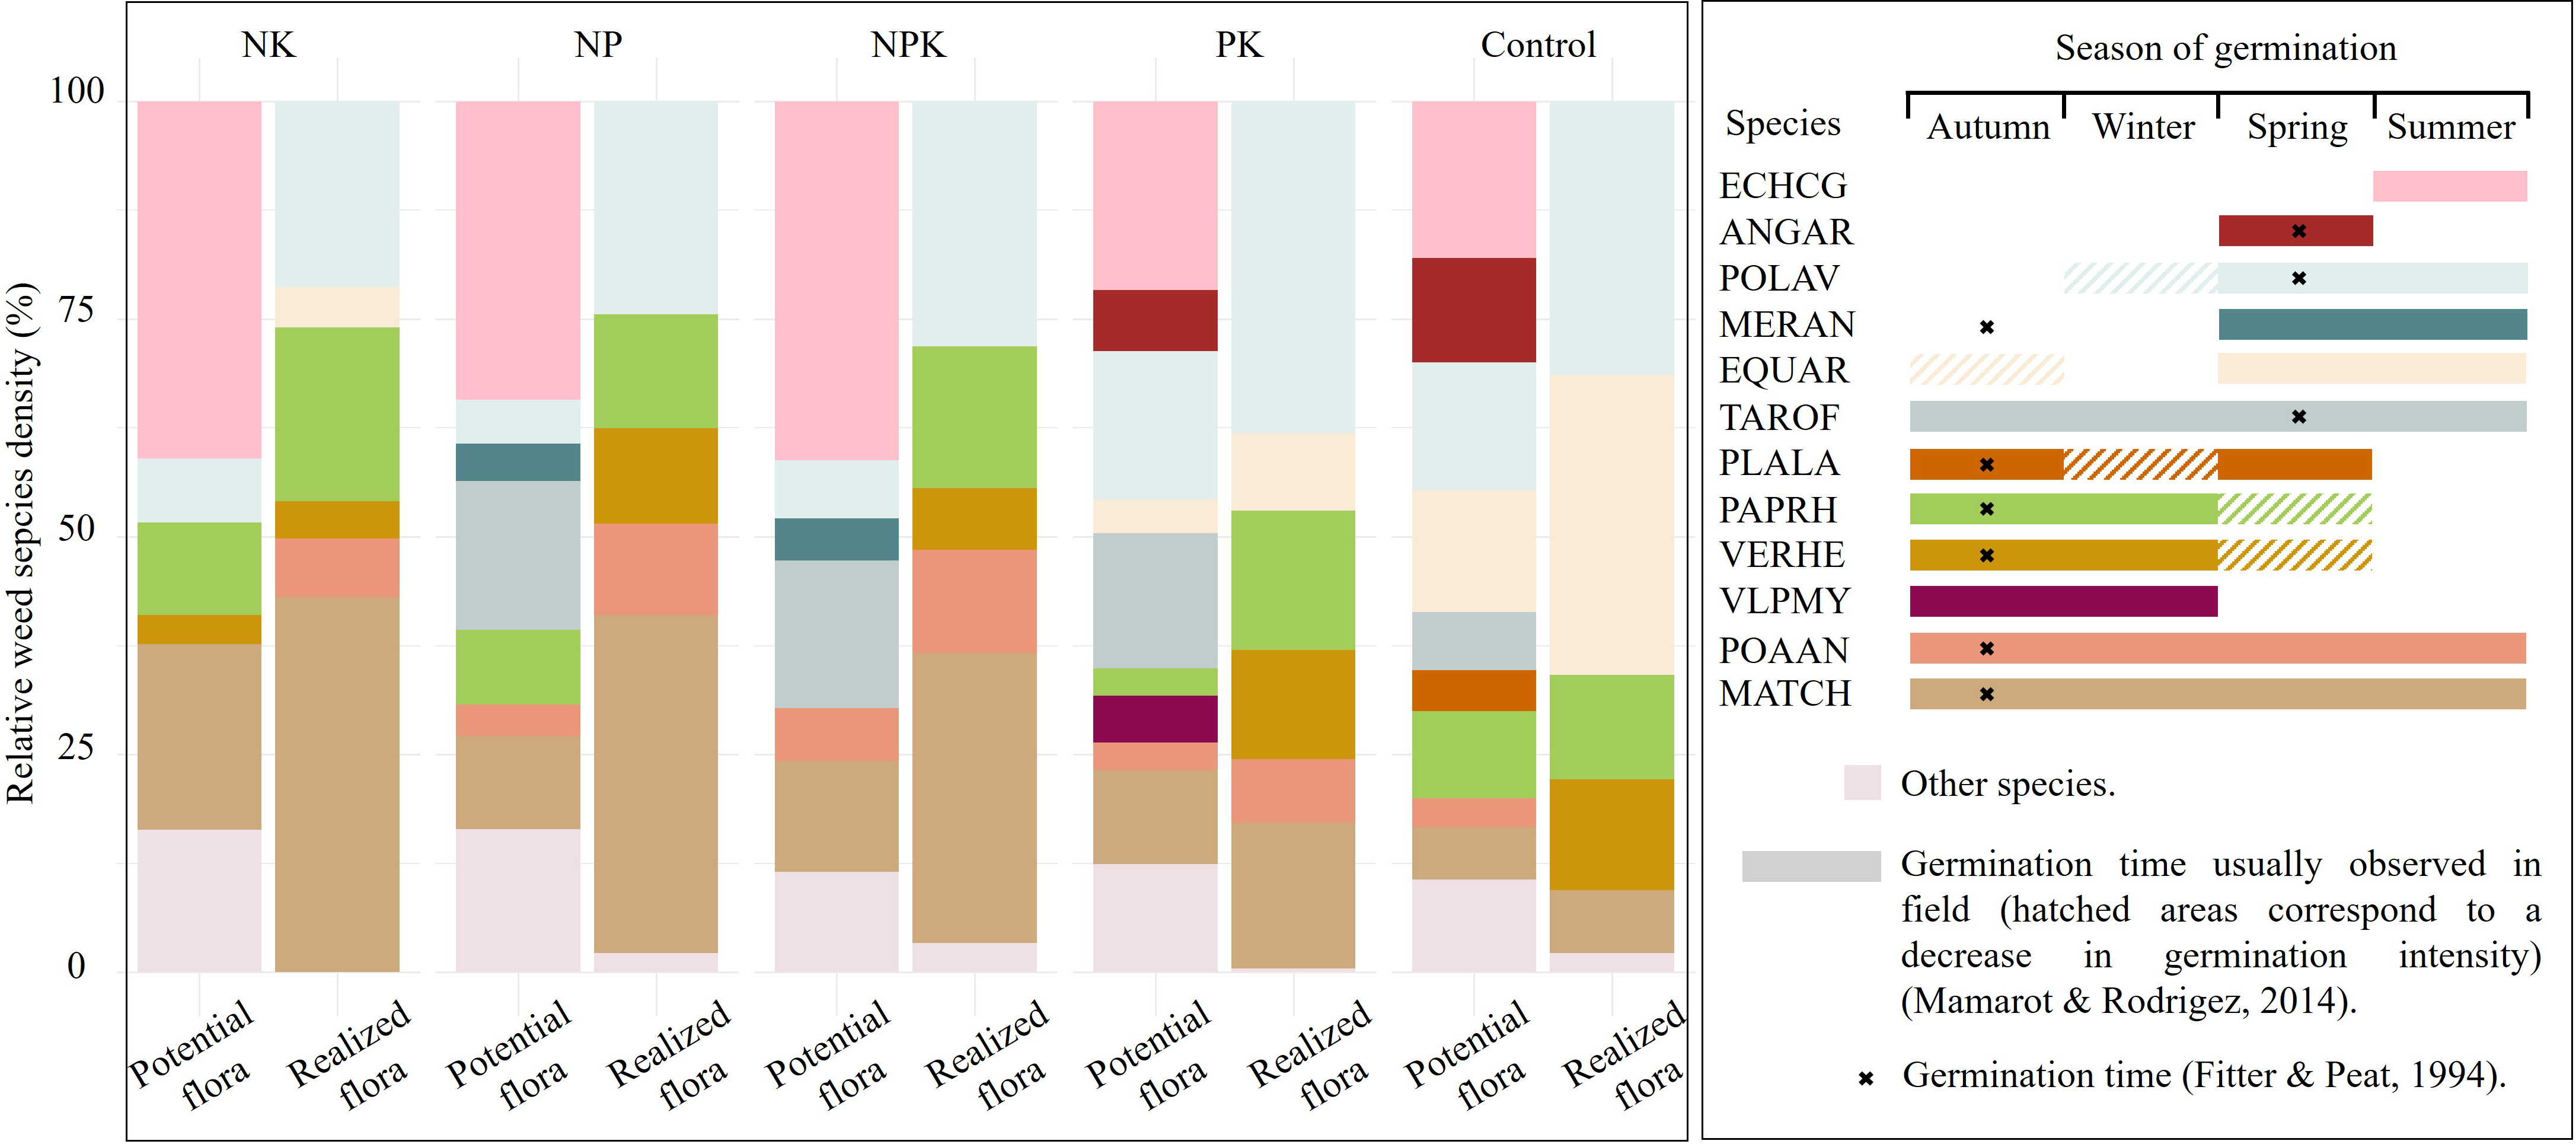
In total, 30 weed species from 18 botanical families were identified in the potential flora (Supplementary Table S4). The species composition varied between the realized and potential flora (Figure 5). Differences in relative species proportions highlight the selective expression of certain species from the potential flora. The potential flora contains a higher proportion of spring germinating species (e.g. Echinochloa crus-galli (L.) Beauv. (ECHCG), Anagallis arvensis L. (ANGAR), POLAV, Taraxacum officinale F.H. Wigg. (TAROF)) compared to the realized flora, a trend observed across all fertilization treatments.
Figure 5
Relative weed species density of realized and potential flora across fertilization treatments. «Other species» includes species whose density represents less than 3% of the total weed density within a given treatment. The right panel shows temporal patterns of seed germination for each species across seasons, with colors matching those used in the left panel. The species germination times provide additional information to interpret the results and will be addressed in the discussion section. Species names are represented using EPPO codes (https://gd.eppo.int/).
. Discussion
The realized weed flora observed in our study exhibited relatively low species richness, a common outcome in herbicide-treated agricultural systems (Grundy et al., 2011). This pattern is particularly evident in continuous wheat monocultures, where the flora often consists of a specific cohort of species associated with the crop, influenced by agricultural practices and seasonal variations. However, wheat monoculture provides limited sources of variability unrelated to the studied factor, as crop rotation and agricultural operations have remained consistent for decades, thus enhancing the reliability of our results (Lande et al., 2000). The ecological dynamic of weed communities in herbicide-treated crops is still complex to understand because weed communities in those crops are a function of the herbicide’s specificity and annual efficacy (Moss et al., 2004). Since low species richness can obscure potential differences between treatments, it is unsurprising that we detected no clear treatment-specific differences in species richness (Lande et al., 2000; Moss et al., 2004).
On the contrary, the total weed density of the realized flora differed significantly across the treatments, with plots without N inputs exhibiting higher weed densities. This pattern confirms previous findings (Berquer et al., 2023; Jiang et al., 2024; Tang et al., 2014; Wang et al., 2023), which similarly reported higher weed densities in nitrogen-free treatments. In the same pedo-climatic conditions, Lacroix et al. (2025) quantified the weed control efficiency of various levels and techniques of weeding in winter wheat. They found out that, even without specific control of weeds, the natural competition imposed by a properly managed and fertilized winter wheat crop could reach up to 40%. The addition of N and, to a lesser extent, P and K, certainly affected crop growth, with winter wheat in nitrogen-free plots showing significantly reduced development. This is demonstrated by the lower yield observed in treatments without nitrogen fertilization (Table 1). Indeed, a lack of available N has been shown to reduce leaf development (Dornbusch et al., 2011), resulting in higher light availability at the soil level in the Control treatment and, to a lesser extent, in the PK treatment. This increase in light can act as a dormancy-breaking mechanism and further enhances soil temperature, which also tend to induce the germination mechanism (Travlos et al., 2019; Botto et al., 1998). These factors likely contributes to the greater abundance of spring-germinating species, such as POLAV, observed in the Control and PK plots (Batlla & Benech-Arnold, 2014). In spring, while low soil light levels in the N-treated plots limited new germinations, weed germination was markedly more abundant in the N-free treatments. These additional spring-germinating seedlings account largely for the higher total weed density in the N-free plots.
The higher abundance of EQUAR in the Control and PK treatments can also be attributed to the indirect effects of fertilization and the species’ ecological traits. This perennial species is characterized by its extensive rhizome system, which can penetrate deeply into the soil and send out shoots every year (CABI, 2021). This species also exhibits a notable resistance to the majority of commonly used selective herbicides (Cloutier & Watson, 1985). The lower density of EQUAR observed in the N-fertilized treatments aligns with findings from the Broadbalk long-term experiment at Rothamsted (Moss et al., 2004) and a long-term crop rotation experiment with varying N supply levels by Andersson and Milberg (1998), who also noted that this species grows poorly in dense stands, likely due to its sensitivity to direct competition for light (CABI, 2021). This adaptation to light conditions can be attributed to its unique photosynthetic system, which includes non-photosynthetic scales at the nodes and photosynthetic stems (CABI, 2021). It has also been shown that tuber production is favored by low nitrogen supply and high light intensities (Andersson & Lundegårdh, 1999), i.e., conditions corresponding to the direct and indirect effect of the absence of N-fertilizer.
This demonstrates that communities are influenced not only by the nutrient affinity of weeds but also indirectly by fertilization, as low fertility alters morphological responses of crops (Perthame et al., 2022), which in turn modifies micro pedoclimatic conditions that shape weed communities, as confirmed by Tang et al. (2014).
In terms of species composition and community structure, there was a clear differentiation influenced by nutrient additions, especially N. This effect is mainly due to the prevalence of species like EQUAR in the Control and PK treatments and, to a lesser extent, POLAV and PAPRH, as well as the increased abundance of nitrophilous species like VERHE in the N-fertilized treatments. Overall, the Control treatment supported a less nitrophilous flora than the nutrient-enriched treatments, with N-treated plots showing similar community structure, while the Control plot was distinct in the NMDS analysis. The PK treatment showed an intermediate profile. Our results are supported by the existing literature, which indicates that high nitrophilous species are often among the most competitive and favored in nutrient-rich systems (Padgett & Allen, 1999; Sweeney et al., 2008; Travlos et al., 2019).
While the realized flora consisted of only 12 species, 30 species were recorded in the potential flora. Despite this higher species count, no marked difference in the potential flora species richness and total density was found between the fertilization treatments. This aligns with the findings of Cordeau et al. (2021), who also reported no marked differences in seed bank density and species richness across fertilization regimes in a maize (Zea mays L.) – alfalfa (Medicago sativa L.) rotation. The differentiation in the floristic composition and community structure within the potential flora was less pronounced than in the realized flora, yet the Control treatment remained distinct. This distinctness is partly due to the abundance of species like EQUAR in the Control and PK treatments, as observed in the realized flora, along with species that are not at all present in the realized flora. The presence of EQUAR in the potential flora can be attributed to its primary reproduction via rhizomes (Williams, 1979), with the majority located in the upper 25 cm of the soil, making them accessible through our sampling methods. It has been demonstrated that an increase in nitrogen supply and a reduction of light availability decreases the rhizome dry weight (Andersson & Lundegårdh, 1999). Consequently, EQUAR is less present in the bud bank of N-fertilized plots. Our results also aligns with Andersson’s (1997) findings of a 30-year-old fertility experiment of a cereal-oilseed crop rotation showing that the shoot growth of EQUAR was favored in N-free fertilization despite a large amount of P and K.
Approximately three-quarters of the species identified in the realized flora were also found in the potential flora, while the remaining three species (Cirsium arvense (L.) Scop (CIRAR), FUMOF, and RAPRA) were present in very low densities. It is plausible that these species are present in the seed bank but went undetected due to low densities and the potential flora sampling method.
In the potential flora, we identified realized flora species germinating in autumn, such as MATCH, POAAN, VERHE, and PAPRH, which occasionally produce seeds despite herbicide treatments. Additionally, in the potential flora, we identified spring-germinating species, such as POLAV, also present as seedlings in the realized flora. These species, germinating relatively late in the cropping cycle (Cloutier & Watson, 1985; Courtney, 1968; Marshall, 1986), are likely to exhibit limited development and, despite notable density, are unlikely to contribute substantially to the weed community biomass (Ross & Harper, 1972).
The potential flora also contained species absent from the realized flora, including strictly spring or summer germinators such as ECHCG, TAROF, Mercurialis annua L. (MERAN), and ANGAR, which rarely germinate in autumn crops like winter wheat (Hald, 1999; Narayana Rao, 2021; Vavrek et al., 1997). Only a small fraction of the weed seed bank germinates in the field, mainly due to resource availability (light, temperature, water) (Travlos et al., 2019) and crop type. Notably, the substantial seed count of ECHCG in the potential flora is intriguing given the recurrent winter cropping. Germination along treated borders post-herbicide application could have allowed seed production in late summer, potentially leading to seed dispersal during harvest and establishment caused by late harrowing (Narayana Rao, 2021). Indeed, this species is known for its high seed production capacity, enabling rapid establishment of large populations (Rojas-Sandoval & Acevedo-Rodríguez, 2014).
. Conclusion
In conclusion, this study confirms that long-term fertilizer applications significantly affect both weed density and composition but have no impact on species richness in winter wheat monocultures continuously cultivated for decades under herbicide management. These effects result from both direct and indirect mechanisms, as evidenced by the species’ nitrogen affinity, and their germination periods. Specifically, long-term nutrient scarcity, limiting crop growth, allows the development of spring-developing flora in winter wheat, thus affecting community structure and density. This impact is primarily driven by a few species that develop differently in nitrogen and non-nitrogen treatments, with PK treatments showing intermediate effects. Density and composition differences were most apparent in the realized flora, while the potential flora also exhibited a comparable, though lesser, degree of differentiation.
. Supplementary material
The following material is available for this article:
Tables S1 and S2. The herbicide application history, including compounds and active ingredients used over the past decade.
Tables S3 and S4. Specific mean densities in the realized and potential flora across fertilization treatments.
Tables S5 and S6. Weed density (individuals m–2) and species richness of the realized and potential flora under different fertilization treatments, expressed as mean ± standard deviation and range.
Abbreviations list
ANGAR – Anagallis arvensis L.
CAPBP – Capsella bursa-pastoris (L.) Med.
CIRAR – Cirsium arvense (L.) Scop.
CONAR – Convolvulus arvensis L.
ECHCG – Echinochloa crus-galli (L.) Beauv.
EPICT – Epilobium ciliatum Raf.
EPIPF – Epilobium parviflorum Schreb.
EQUAR – Equisetum arvense L.
ERICA – Erigeron canadensis L.
FUMOF – Fumaria officinalis L.
GASCI – Galinsoga quadriradiata Ruiz et Pav.
GEUUR – Geum urbanum L.
GNAUL – Gnaphalium uliginosum L.
LAMAM – Lamium amplexicaule L.
LAPCO – Lapsana communis L.
MATCH – Matricaria chamomilla L.
MERAN – Mercurialis annua L.
PAPRH – Papaver rhoeas L.
PARSE – Petroselinum segetum (L.) Koch
PLALA – Plantago lanceolata L.
POAAN – Poa annua L.
POLAV – Polygonum aviculare L.
RAPRA – Raphanus raphanistrum L.
SENVU – Senecio vulgaris L.
SOLNI – Solanum nigrum L.
SONAS – Sonchus asper (L.) Hill.
STEME – Stellaria media (L.) Vill.
TAROF – Taraxacum officinale F.H. Wigg.
THLAR – Thlaspi arvense L.
URTDI – Urtica dioica L.
VERHE – Veronica hederifolia L.
VESPU – Verbascum pulverulentum Vill.
VLPMY – Vulpia myuros (L.) C.C. Gmel.
CWM – Community Weighted Mean
ha – hectare
k – number of dimensions
lat – latitude
long – longitude
NMDS – Non-metric multidimensional scaling
PERMANOVA – Permutation-based multivariate analysis of variance
