. Introduction
Ficus carica L., commonly known as the fig tree, is a deciduous shrub native to the Middle East and Western Asia (Mawa et al., 2013). It is cultivated in 218,729 ha and distributed in 54 countries. Its yearly mean yield is 6.5 t ha−1 (FAO- STAT, 2021). The world’s total fig production was estimated at approximately 1.4 million t in 2020 (FAO- STAT, 2021).
Ficus carica fruits (figs) are enclosed infructescences with a hollow succulent receptacle (Mawa et al., 2013). The demand for fresh figs has recently attracted much attention due to their potential health-promoting benefits (Ayuso et al., 2022). The increased market is explained by the fact that figs are a reliable source of fiber and phenolic compounds, mainly proanthocyanidins, furanocoumarins, and phenolic acids (Badgujar et al., 2014; Francini et al., 2021; Soni et al., 2014; Wang et al., 2017). Figs are used to develop functional foods and beverages, contributing to a healthier human diet. In addition, figs are eaten by 1,274 bird and mammal species, and many of them disperse fig seeds (Shanahan et al., 2001).
Currently, Ficus carica is cultivated in many horticultural regions around the world. Also, several studies have been carried out on the behavior of this fruit tree under different environmental conditions, and particularly some of them are focused on dry conditions (Ammar et al., 2020a, 2020b; Mardinata et al., 2021). Thus, the current knowledge of the photosynthesis rates in fig trees under different soil water contents indicates that this species exhibits a remarkable ability to adapt to varying moisture levels (Ammar et al., 2020a, 2020b; Mardinata et al., 2021). Fig trees are well adapted to dry and moderate soil moisture conditions (Crisosto et al., 2011; Gholami et al., 2012). They can display a range of mechanisms through photosynthetic activity (Osakabe et al., 2014).
When soil water availability is unlimited, trees of the Ficus carica species show well-hydrated root systems that facilitate nutrient uptake, supporting excellent photosynthetic performance (Fernández-Pavía et al., 2020; Gordon et al., 2022). Thus, fig trees have increased photosynthetic rates due to enhanced stomatal conductance (gs), allowing higher carbon dioxide (CO2) uptake and subsequent assimilation under such a soil moisture condition (Mardinata et al., 2021; Xu et al., 2016).
On the other hand, under conditions of limited water availability, fig trees exhibit specific adaptive strategies, such as stomatal regulation and changes in leaf morphology (Ammar et al., 2022; Zafer Can & Aksoy, 2007). These mechanisms help to reduce water loss through transpiration and improve water-use efficiency. As a result, fig trees can maintain relatively high photosynthetic rates even at low soil moisture levels (Ammar et al., 2022); therefore, it appears this species exhibits resilience to drought stress.
In summary, the Ficus carica species appears to possess adaptive strategies to maintain photosynthetic activity under water-unlimited and water-limited availability conditions. Nonetheless, further research is needed to unravel the intricate molecular, biochemical, and physiological mechanisms underlying these responses and to explore the specific gene networks involved in the ability of fig trees to thrive under different soil water contents (Lobo et al., 2022). This knowledge can contribute to improved agricultural practices and better management of water resources in fig cultivation, mainly if proper genotypes are identified for each horticultural region. In addition, this crop may be an excellent alternative to drought-prone areas or with low water availability worldwide.
In this context, such knowledge can contribute to the development of fig tree drought-resistant varieties in the face of changing climate conditions. Therefore, we hypothesize that Ficus carica L. plants will present a crucial negative correlation between proline content and at least a physiological variable. As a consequence, the aims of this work were (i) to identify a possible adaptive response to mitigate the negative effects of drought and enhance the ability of plants of six Ficus carica L. genotypes under study to survive once they were subjected to extreme drought and (ii) to identify outstanding fig tree accessions under such a situation.
. Material and methods
. Study site and plant material
The experiment was conducted in the experimental area of the Unidad Regional Universitaria de Zonas Áridas of the Universidad Autónoma Chapingo (Bermejillo, Durango, México), located at 103°36′07″ N and 25°53′43″ W. Its altitude is 1,119 m above sea level. The average annual rainfall is 258 mm, and the mean annual evaporation is 2,000 mm. The regional climate is desert, with rain during the summer and winter (Medina et al., 2005).
The plants were collected from the Comarca Lagunera, which belongs to Durango and Coahuila states, México. The fig materials were obtained from backyards or wild sites. The “mother plants” were subjected to layering to obtain vegetative reproduction. The obtained layers were grown in 10 kg capacity pots filled with 9.5 kg of soil (soil characteristics: organic matter of 2.68 mg kg−1; pH of 8.8, and EC of 3.61 dS m−1). The soil used presented a field capacity (FC) of 33% and a permanent wilting point (PWP) of 20%. The fig accessions were adapted to pot conditions for three months; the pots were irrigated according to their water requirements (around 80% of the FC). During the experiment, the daytime mean air temperature was in the range of 29–46 ± 1 °C, the night-time mean air temperature was in the range of 20–24 ± 1 °C, and the daily mean relative humidity was measured in the range of 24–54 ± 3%. The air temperature and relative humidity were monitored during the experimental period using a high-accuracy humidity and temperature sensor (ORIA OUS-WA62®;).
. Experimental design
The experiment was arranged as a randomized block design with divided plot layouts with three replications. The experiment was conducted under semi-controlled conditions using 6-month-old local fig accessions (Arista, Ceballos, Fortuna, Guadalupe Victoria, and San Antonio) and one variety (Black Mission). To group the accessions and the variety, from now on, we call them “genotypes” (Table 1). The plants were divided into two groups; the first was grown at field capacity (FC) or water holding capacity (WHC), and the second was kept in water deficit (WD) conditions. The soil water content was recorded as Hydric Soil Potential (HSP).
Table 1
Identification and geographical location of Ficus carica L. accessions.
The WD condition was generated in the plants by stopping the irrigation. The experimental process started with all the plants at FC. The experiment was conducted during June and July 2022, corresponding to the vegetative plant stage. The pots were weighed every day at the same hour (10:00), and the FC pots were rehydrated as needed. The WD plants were subjected to a dehydrating period due to evaporation. During this time, the pots were evaluated to determine the daily water loss. The WD condition lasted seven days; at this time, at least 50% of the plants showed physical water stress evidence (leaves wilting and turgidity loss). The WD condition was measured at day 7 in the range of −2.1 to −3.6 MPa with a mean value of −2.7 MPa when the PWP was −1.5 MPa. Data were recorded daily during the experimental time.
Once the maximum WD was observed, the plants were irrigated. Then, they were evaluated in a recovery period at days 8, 11, and 15 after the experiment was started (i.e. days 1, 4, and 8 after irrigation was applied). During this recovery period, the plants were maintained at FC. The response variables were measured on day 1 (beginning condition), day 7 (the maximum stress condition), day 8 (24 h recovery), day 11 (medium recovery period), and finally, day 15 (maximum recovery period). All those measures were done in recently matured leaves; the sampling was done between 10:00 and 11:00 hour on sunny and clear days.
. Measurements
. Relative water content (RWC)
Leaves from each treatment were collected in wet chambers to prevent water loss during the transport time to the laboratory. The RWC was determined by considering fresh weight (FW), dry weight (DW), and turgent weight (TW). Foliar sections of 2 cm2 were measured (FW) and submerged in water at 4 °C for 12 h without light. Afterward, the weight was recorded (TW). The turgent leaf sections were dried at 80 °C for 24 h, and the DW was determined (U.S. SOLID, model USS-DSS) (Barrs & Weatherley, 1962). In the end, the RWC was calculated using the following formula:
. Gas exchange measurements
Mature leaves were used to measure photosynthetic rate (Pn, µmol CO2 m−2 s−1), stomatal conductance (gs, mmol H2O m−2 s−1), intercellular CO2 content (Ci, µmol CO2 mol air−1), and transpiration rate (E, mol H2O m−2 s−1). All the determinations were performed on sunny and clear days (from10:00 to 11:00 hour) using a portable infrared gas exchange analyzer (LI-COR 6400, Lincoln, NE, USA). The operative conditions were 400 ppm CO2 in the camera and active photosynthetic radiation (PAR) of 750 µmol m−2 s−1 at 25 °C cuvette temperature. The leaf samples were placed in the cuvette for about one minute for data collection before physiological parameters (Pn, E, and gs) were stabilized, as indicated by a low coefficient of variation. Three mature leaves from each replicant, exposed to sunlight, were measured from each accession and variety during the evaluation time.
. Determination of water-use efficiency (WUE) and intrinsic water-use efficiency (int-WUE)
WUE describes the ratio of Pn to water lost by the plant through transpiration (E) (Equation (2)) Photosynthetic water-use efficiency (also known as intrinsic or instantaneous water-use efficiency) was defined as the ratio of Pn to stomatal conductance (gs) (Equation (3)) (Tambussi et al., 2007):
. Solute content
Soluble sugar content (SSC) was determined with the Dubois et al. (1956) method. Then, 100 mg of nitrogen-frozen leaf tissue was diluted using distilled water (5 ml). This extract was mixed with phenol and concentrated H2SO4. The mix was tested using a spectrophotometer at A 490 nm (UV–VIS, Model 721, Shanghai Precision and Scientific Instrument Co; Ltd). SSC was calculated using a D-glucose standard curve and expressed as SSC mg g−1 FW.
Proline concentration (Pro) was determined according to Bates et al. (1973) with minor modifications. The nitrogen-frozen material (500 mg) was mixed with 5 ml of a 3% salicylic acid (C7H6O6S) solution. The mix was homogenized and centrifuged (6,000 rpm for 30 min at 10 °C). The reaction solution was mixed with 1 ml of glacial acetic acid and ninhydrin, the mixture was incubated at 100 °C for 1 h, and the reaction was stopped in an ice bath before extraction with 3 ml of toluene. The organic phase was read using a spectrophotometer at A530 nm. The Pro concentration was determined using L-Proline (Sigma Aldrich) and expressed as µMol Proline g−1 FW.
. Results
From the principal components analysis (PCA), we considered that the two first principal components were sufficient to explain the variation of the original data (174 observations and 10 variables) (Figure 1). They accounted for 65% of the total variation; PC1 explained 37.9%, and PC2 explained 23.9%. Based on this analysis, we can predict the response of the genotypes of Ficus carica under water deficit and rehydration process.
Figure 1
Distribution of the variables: hydric soil potential (HSP), relative water content (RWC), photosynthesis rate (Pn), stomatal conductance (gs), intracellular CO2 content (Ci), transpiration rate (E), water use efficiency (WUE), intracellular-water use efficiency (int-WUE), soluble sugar content (SSC), and proline concentration (Pro) in the orthogonal plane defined by the two first principal components extracted from 174 observations belonging to experimental pots of 6 genotypes of Ficus carica L.
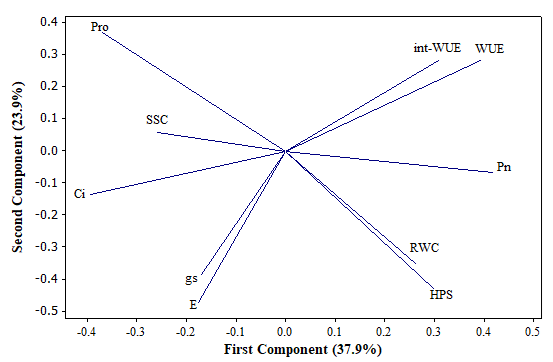
The structure of PC1 is composed of Pn, Ci, WUE, int-WUE, and SSC (Figure 1). The first group is positively intercorrelated (Pn, WUE, and int-WUE) as well as the other two (Ci and SSC). However, the members of the first group are negatively correlated with the members of the other. On the other hand, the structure of PC2 is clearly defined by E, HSP, gs, and RWC. Interestingly, they are positively correlated. Markedly, Pro exhibits similar absolute values of factor loading (0.369) in both principal components: negative in the case of the first principal component and positive in the other.
In general, the structures of the two first principal components indicate the following meaningful bivariate relationships. WUE, int WUE, and Pn show substantial increases; SSC is augmented as Ci does. When WUE, int-WUE, or Pn increased, SSC or Pro decreased. Moreover, RWC increased as the HSP did; RWC tended to be higher under the unlimited water conditions, and the Pro content decreased as each RWC and HSP increased.
Relationships between variables were obtained through Pearson correlations. A general analysis of the matrix of correlations allowed us to appreciate a strong relationship between the gas interchange variables (Ci, gs, and E) (Table 2). In addition, the correlations between the variables related to the water efficiency used (WUE and int-WUE) and photosynthetic variables (Pn, gs, Ci, and E) are notable. Furthermore, the strongest correlation was observed between HSP and Pro, which is a significant negative correlation.
Table 2
Matrix of Pearson correlation coefficients (r) between the variables: relative water content (RWC), net photosynthesis (Pn), stomatal conductance (gs), intracellular CO2 content (Ci), transpiration rate (E), soluble sugar content (SSC), proline concentration (Pro), water use efficiency (WUE), intracellular-water use efficiency (int-WUE), and hydric soil potential (HSP) from 174 observations belonging to experimental pots of 6 genotypes of Ficus carica L.
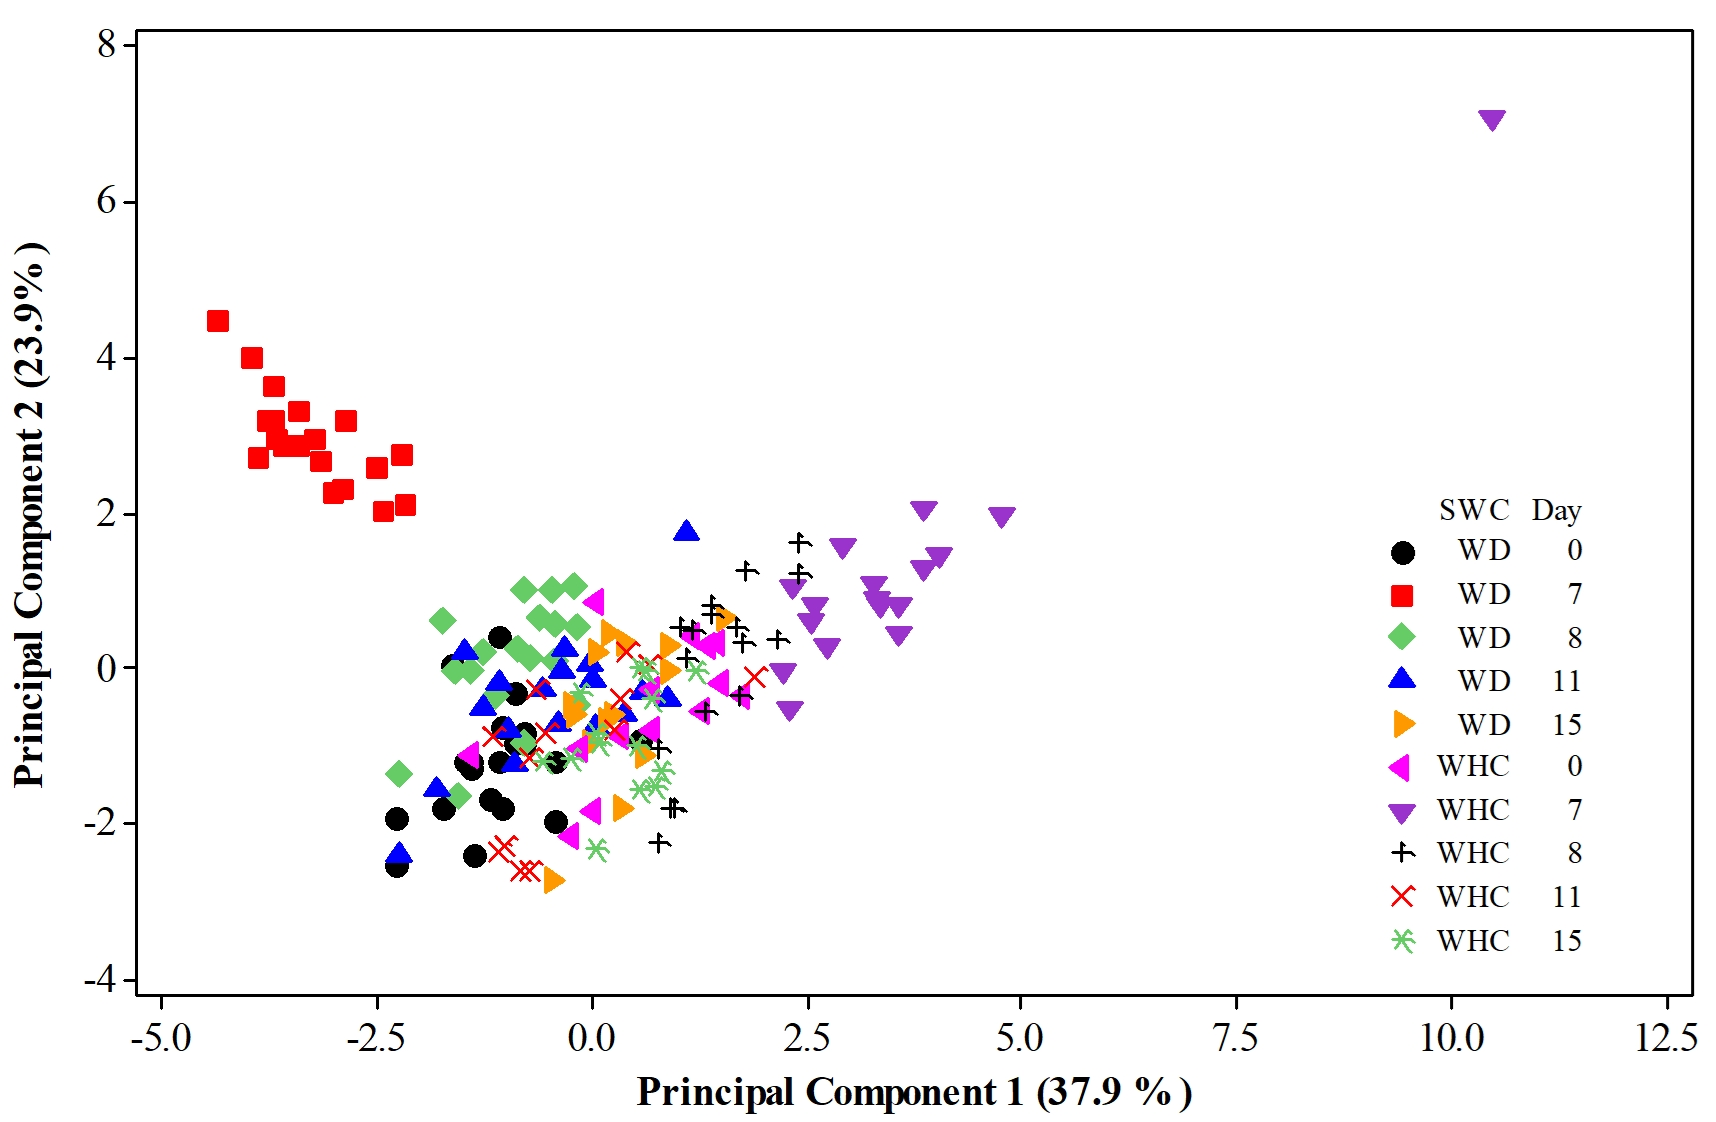
When the first two PCs account for a high percentage of the total variation, as in the current study case, a plot of PC1 versus PC2 may allow looking for a cluster of observations considering the involved factors and their levels. The distribution of the 174 observations in Figure 2 suggests at least three large groups. One cluster clearly belongs to observations involving the 6 genotypes under the WD condition on day 7 (located at the left-upper part of the graph denoted by red squares). The highest Pro contents mainly characterize this group if the distribution of variables in Figure 1 is considered. In addition, the Pro content, Pn, Ci, and SSC were strongly correlated with RWC (r = −0.572, p = 0.011), E (r = 0.595, p = 0.007), E (r = −0.566, p = 0.012), and Ci (r = −0.456, p = 0.049), respectively. The corresponding dependences were estimated through simple linear regressions analyses, and the results are as follows:
Figure 2
Distribution of 174 observations belonging to experimental pots of 6 genotypes of Ficus carica L. in the orthogonal plane defined by the two first principal components. Experimental plants were growing for 15 days under two soil water conditions, SWCs (WD refers to the Water Deficit condition, i.e. water being applied once the experiment started (day 1) but the application of water was performed 7 days later, while the water holding capacity (WHC) condition means maintaining such a level throughout the experimental period).
The Pro response depended strongly on RWC (p = 0.001). The Pn variable varied mainly from E (p = 0.001). In the case of the Ci variable, it presented important dependence with E and SSC as it is observed in the previous equations.
Another important group of observations is readily appreciated in the right-upper region of Figure 2 (marked by purple triangles). These observations are characterized mainly by the highest Pn, WUE, and int-WUE values. They all correspond to the 6 genotypes under the WHC condition on day 7. Notably, an extreme observation with the highest values of WUE and int-WUE and low values of gs and E belongs to the Guadalupe Victoria accession. In addition, this cluster of cases was characterized by strong correlations between gs and E (r = 0.459, p = 0.05) and gs and Ci (r = 0.507, p = 0.032). This implies significant dependences of E and Ci on gs as follows:
A third significant group of observations is located near the origin of the orthogonal plane defined by the two first principal components. This cluster is integrated by observations belonging to the remaining dates, i.e. days 1, 8, 11, and 15. This means that, in the present group, observations of all 6 genotypes are involved; interestingly, the observations belonging to the WD condition at days 8 and 11 are located in the left-central region. Markedly, the observations for the WD condition at days 8 and 11 showed important Pro and SS contents. In addition, the observations linked with the WHC condition are distributed in the right-central region of the graph.
. Discussion
Our working hypothesis proposed that Ficus carica plants will present an important negative correlation between proline content and at least a physiological variable. According to our research outcomes, Pro showed a fascinating negative correlation with RWC and Pn. Therefore, our working scientific hypothesis was confirmed.
It is widely known that many plant species have shown changes in proline concentration. This amino acid serves as an amino acid osmoprotectant in response to varying soil water availability (Gunnula et al., 2022; Szepesi & Szőllősi, 2018). In our study case, Ficus carica plants of 6 genotypes under hydric stress showed a high increase in Pro content on day 7 (Figure 2). Thus, such an increase in Pro as a compatible solute could help the plants to maintain cell turgor and osmotic balance during water stress (Ashraf & Foolad, 2007); it could play an essential role in protecting cellular structures from oxidative damage (Navasona et al., 2009). In other words, the accumulation of Pro in Ficus carica plants could be considered an adaptive response to mitigate the negative effects of drought and enhance the ability of plants of the 6 genotypes under study to survive under WD conditions. This idea is strongly reinforced by the evidenced important Pro dependence on RWC.
A separate analysis suggested that the six genotypes showed no significant differences in Pro contents under WD conditions on day 7 after the experiment started (data not shown). However, Guadalupe Victoria (368 µmol Proline g−1 FW) and Ceballos (318 µmol Proline g−1 FW) were the accessions with the highest Pro contents and, coincidently, both genetic materials showed the lowest RWC (64% and 60%, respectively). Markedly, the Ceballos accession was subjected to the strongest hydric soil potential (−3.6 MPa), i.e., extreme drought.
The cases characterized by the highest values of WUE, int-WUE, and Pn located at the right-upper part of the graph belong to the WHC condition on day 7 after the experiment started. Then, these fig trees exhibited the highest photosynthetic water-use efficiency. In addition, these specimens were characterized by significant dependences of E and Ci on gs.
In general, as HSP absolute values SWT increase (drier soil conditions), Ficus carica may experience a decrease in the RWC within its tissues (Zafer Can & Aksoy, 2007). This decrease is a result of a reduction of water availability in the soil being absorbed by the plant roots; in addition, this response follows similar principles to other species under water stress conditions (Osmolovskaya et al., 2018). The Ficus carica species regulates gs to minimize water loss by transpiration. The gs reduction also restricts the entry of carbon dioxide (CO2) into the leaf, leading to an increase in intracellular CO2 within the leaf tissues (Ammar et al., 2020b). It is important to note that Ficus carica responses may be influenced by various factors, such as the storage during plant development, the severity and duration of water stress, and the genotype characteristics (Gholami et al., 2012; Hayat et al., 2012).
Possibly, these Ficus carica plants effectively captured CO2 from the atmosphere and converted it into organic compounds (Kareya et al., 2020). Then, their efficient carbon assimilation may have led to the rapid consumption of intercellular CO2. In addition, they may have converted CO2 into other compounds rather than SS (Liu et al., 2016).
Although the six genotypes showed no significant differences in Pn under the WHC conditions on day 7 after the experiment started (data not shown), the link between high Pn, low Ci, and low SSC may suggest an efficient carbon assimilation and utilization system in Ficus carica plants. The Guadalupe Victoria accession notably showed the highest Pn (15.48 µmol CO2 m−2 s−1). Such a result indicates that this genetic material might possess an extraordinary ability to capture and use carbon effectively for growth and metabolic processes rather than storing it as sugars (Dietze et al., 2014; Geigenberger et al., 2005). In other words, the leaves of the Guadalupe Victoria accession trees might be operating with a higher water use efficiency without a penalty in terms of carbon gain, as pointed out by Ball and Passioura (1995).
This is a complex interpretation of cases located around the origin of the orthogonal plane defined by the two first principal components. Nonetheless, the appreciated subgroups allowed us to come up with some exciting ideas. For instance, the observations for the WD condition at days 8 and 11 showed important Pro and SS contents, possibly due to the efforts of the trees to express resilience to drought stress. This idea is strongly reinforced by the highest yield of proline on day 7, which is clearly appreciated in Figure 1 and Figure 2. Another idea that could support the effort of the fig trees to express resilience to drought stress involves the cases corresponding to the WD and WHC conditions on day 15, as they are clustered nearest the origin of the plane (all of them overlapped).
. Conclusions
Under conditions of limited soil water content (WD on day 7), fig trees exhibit a controlled reduction in stomatal conductance (gs) and transpiration (E) as well as augmentation in proline (Pro) and soluble sugar (SSC) contents. In addition, a possible adaptive response to mitigate the negative effects of drought and enhance the ability of the plants of the six genotypes under study to survive under WD conditions was evidenced through a significant negative correlation between Pro and relative water content (RWC). In this context, Guadalupe Victoria and Ceballos are outstanding accessions. They were the accessions with the highest Pro contents and the lowest RWC.
The evidenced links between high Pn, low Ci, and low SSC in fig trees growing under water holding capacity (WHC) suggest an efficient carbon assimilation and utilization system. In this context, the Guadalupe Victoria accession shows the highest Pn. In other words, this genetic material might possess an impressive ability to capture and use carbon effectively for growth and metabolic processes rather than storing it as sugars. The physiological studies are relevant for the effective selection of outstanding genotypes of perennial species for tolerance to limited water conditions. In addition, a study of the evaluation of yield and fruit quality of the outstanding genotypes is necessary to be conducted.
