. Introduction
Plant interbreeding is an important process that can play a significant role in evolution, since increasing the variability within species can eventually lead to speciation (Abbott et al., 2013; Arnold, 1997, 2006; Mallet, 2008; Rieseberg et al., 1993; Soltis & Soltis, 2009). Hybridization and introgression usually occur between related species that have not developed isolation mechanisms such as phenological barriers (Boratyński et al., 2003) or postpollination fertilization restrictions (Stacy et al., 2017). Occasionally, hybrid specimens survive despite the extinction or destruction of one of the parental species, forming populations of “orphaned hybrids” (Kornaś & Medwecka-Kornaś, 2002).
Hybridization between species within the same genus of the Pinaceae family is commonly found (e.g., Delgado et al., 2007; Gernandt et al., 2005; Kormuták et al., 2005; Krajmerová et al., 2016). Historically, morphologically-intermediate specimens of P. sylvestris L. and the taxa of the P. mugo Turra complex (P. mugo sensu stricto, P. uncinata Ramond, and P. uliginosa Neumann) in the wild state have been described as P. ×rhaetica Brügger (Businský & Kirschner, 2010; Christensen, 1987; Staszkiewicz & Tyszkiewicz, 1972 and literature quoted herein). Several biometric studies have been carried out to verify the presence of hybrid individuals or possibly entire hybrid populations of these pines (e.g., Benoit, 2020; Bobowicz, 1988; Boratyńska & Bobowicz, 2001; Boratyńska et al., 2003, 2008; Christensen & Dar, 1997; Neet-Sarqueda et al., 1988; Staszkiewicz & Tyszkiewicz, 1972; Venturas et al., 2013). These examinations confirmed the intermediate position of the hybrids when compared to the parent species using different morphological and anatomical characteristics, but also showed some ambiguity in their identification. Additionally, controlled crosses between P. sylvestris and taxa from the P. mugo complex (including P. uliginosa) showed greater success when P. sylvestris was pollinated by the P. mugo complex taxa than vice versa. The possibility of backcrossing of hybrids with both parental species has also been detected (e.g., Kormuták et al., 2005, 2017; Lewandowski & Wiśniewska, 2006 and the literature cited herein). Other studies on the hybridization of P. sylvestris and P. mugo generally related to isoenzymes and small sets of molecular markers (Jasińska et al., 2010; Kormuták et al., 2008; Lewandowski et al., 2002; Wachowiak et al., 2015, 2016; Wachowiak, Celiński, & Prus-Głowacki, 2005; Wachowiak, Lewandowski, & Prus-Głowacki, 2005; Wachowiak & Prus-Głowacki, 2008). Those studies were conducted in two different systems of contact zones: in small, isolated populations of P. mugo (or related taxa) surrounded by extensive populations of P. sylvestris (e.g., Kormuták et al., 2005; Lewandowski et al., 2002; Venturas et al., 2013; Wachowiak & Prus-Głowacki, 2008), or in relatively large populations of both species (e.g., Jasińska et al., 2010; Neet-Sarqueda et al., 1988).
The small relic populations of P. sylvestris, P. uliginosa, and P. mugo, although rare in nature, are especially valuable and provide unique insights into hybrid zones, as the effects of hybridization and introgression over many generations is preserved without or with a very limited inflow of genes from outside of the zone. Such a population is preserved in Błędne Skały, in the Stołowe Mountains National Park, where pine species and intermediate specimens grow on the peaks of Cretaceous sandstone rocks (Boratyński, 1978). Considering the developmental history of the vegetation in the Sudetes during the Holocene, it can be assumed that the population of both pine species was likely established in the Boreal period, approximately 8,000 years ago. The Pinus sylvestris pollen type, which includes the pollen of the P. mugo complex (Jankovská, 2004; Latałowa et al., 2004), has been consistently recorded in the Sudetes since the beginning of the Holocene (Glina et al., 2017; Malkiewicz et al., 2016; Treml et al., 2008). It has also been identified in the peat bogs of the Stołowe Mountains, such as Wielkie Torfowisko Batorowskie (Marek, 1998) and the bogs near Zieleniec (Madeyska, 2005), which are close to these mountains. The expansion of deciduous trees and subsequent spread of Norway spruce resulted in the formation of dense and shady forests limiting the access of the sunlight necessary for the effective regeneration of light-demanding pines. Consequently, P. sylvestris and P. mugo sensu lato could only survive in habitats inaccessible to trees such as elms, alders, or spruce (Baranowska-Kącka, 2013). A prime example of these sites in the Stołowe Mountains is the top of sandstone rocks on the peaks of Szczeliniec Wielki (Reczyńska et al., 2021). These sites are quite difficult to access, which means that it is unlikely they were used for browsing. Moreover, the extremely unfavorable site conditions prevented intensive forest management (Latocha & Migoń, 2018; Staffa et al., 1992), as did the forests on rocks in the other parts of Europe (Sandström et al., 2020).
Currently, pines phenotypically resembling P. sylvestris, P. uliginosa, and P. mugo sensu stricto grow on the rock tops of Błędne Skały. Given the effective production and dispersal abilities of pine pollen (e.g., Poska & Pidek, 2010; Sarvas, 1962, 1972), and the mating pattern within stands (Burczyk & Chałupka, 1997; Robledo-Arnuncio & Gil, 2005), the effectiveness of pollination and the influx of pollen from sources outside the population of Błędne Skały was likely very limited. Therefore, it is highly possible that the population of both taxa and their hybrids that formed in the Stołowe Mountains survived in situ for 7,000–8,000 years. In this context, the population of Błędne Skały is a unique and valuable model for studying the processes of hybridization.
A preliminary study conducted on 62 specimens of the pine population at Błędne Skały randomly sampled in the western part of the rock complex revealed a large percentage of hybrids. Individuals with the P. sylvestris phenotype were included, but there was a lack of hybrids resembling P. mugo or P. uliginosa (Sobierajska et al., 2020). From these preliminary results, we assumed that genes of P. uliginosa could have survived in other relic populations of Scots pine in the Stołowe Mountains, outside of Błędne Skały and Wielkie Torfowisko Batorowskie. Therefore, we applied simultaneous analyses of chloroplast and mitochondrial markers, and biometric studies of morphological characteristics of needles and cones and anatomical features of needles to search for traces of P. uliginosa in these areas. Specifically, we used chloroplast DNA markers to distinguish P. sylvestris individuals from P. mugo (along with P. uliginosa and P. uncinata) in mixed populations (Dzialuk et al., 2012, 2017; Wachowiak et al., 2000), mitochondrial markers to differentiate P. uncinata from other taxa of the P. mugo complex (Zaborowska et al., 2020), and phenotypic data to ascertain P. sylvestris, P. mugo, P. uliginosa, and P. uncinata with high probability (Boratyńska et al., 2014, 2015), but with no distinction of cryptic hybrids.
Using the above resources, the present study aimed to (i) search for cryptic hybrids with the P. sylvestris phenotype in relic populations of P. sylvestris in the National Park of the Stołowe Mountains outside Błędne Skały, (ii) verify the hybridization level in mixed P. sylvestris, P. uliginosa, and P. mugo population in Błędne Skały, and (iii) verify the level of genetic and phenotypic diversity and differentiation of relic populations of P. sylvestris in the Stołowe Mountains National Park.
. Material and Methods
. Material
Material for the study was gathered from Stołowe Mountains National Park. In addition to the mixed population from Błędne Skały, we sampled other presumably relic populations of P. sylvestris. Based on the field inspections, six populations were used in the study (Figure 1). We sampled 2-year-old needles and cones for biometry and 1-year-old needles for molecular analyses from 215 trees in total (Table 1). The geographical position of each tree was determined using GPS during material collection. The phenotype of each specimen sampled was determined based on the following morphological characteristics: growth form, number of trunks, thickness, form and color of the bark of trunks, density and arrangement of branches in the crowns, color of the needles, and form of the fully developed cone setting of 1-year-old cones (Bobowicz, 1988; Businský & Kirschner, 2010; Christensen, 1987; Christensen & Dar, 1997; Marcysiak, 2004; Neet-Sarqueda et al., 1988; Staszkiewicz & Tyszkiewicz, 1972).
Figure 1
Distribution of the studied populations (A) and trees (B–E) of Pinus sylvestris in the Stołowe Mountains National Park: (A) Populations and individual trees throughout the Park. Distribution of trees on: Błędne Skały (B); Szczeliniec Wielki (C); Głowa Króla (D); and Niknąca Łąka (E).
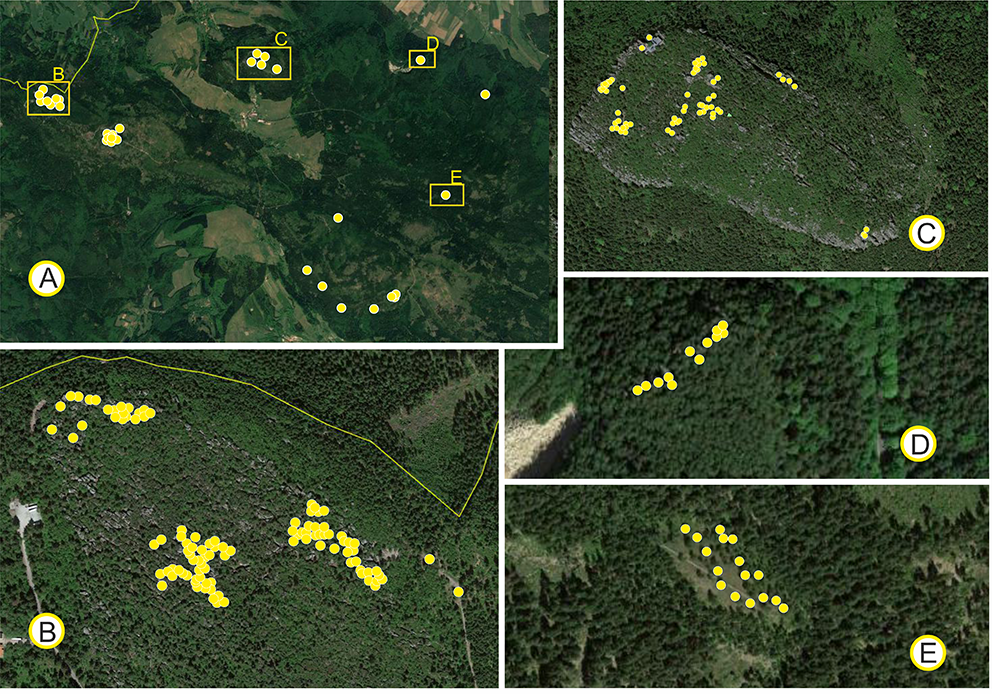
Table 1
Geographic position of Pinus species populations in the Stołowe Mountains.
| Species | Code | Population | Geographic coordinates | Biometry | Genetics | ||
|---|---|---|---|---|---|---|---|
| Latitude (°) | Longitude (°) | Elevation (m) | Number of individuals (needles/cones) | Number | |||
| Mixed population | BS | PNGS. Błędne Skały* | 50.480 | 16.290 | 850 | 105 (315/525) | 105 |
| Pinus sylvestris (S) | SK | PNGS. Skalniak* | 50.472 | 16.306 | 855 | 10 (30/50) | 10 |
| NL | PNGS. Niknąca Łąka | 50.465 | 16.396 | 716 | 16 (48/80) | 16 | |
| GK | PNGS. Głowa Króla | 50.484 | 16.381 | 655 | 12 (36/60) | 12 | |
| SC | PNGS. Szczeliniec Wielki | 50.485 | 16.341 | 905 | 62 (186/310) | 62 | |
| RS | PNGS. Radkowskie Skały | 50.480 | 16.395 | 660 | 1 (3/5) | 1 | |
| BIA | PNGS. Zbój – Skały Puchacza – Kopa Śmierci* | 50.447 | 16.370 | 765 | 8 (24/40) | 8 | |
. Methods
. Genetics
Genomic DNA was isolated from needles using a plant DNA isolation kit (A&A Biotechnology), and the quality and suitability for DNA analyses was assessed using a biophotometer (BioPhotometer, Eppendorf). We tested for the presence of individuals with the P. sylvestris phenotype and bearing chloroplast DNA of P. uliginosa/P. mugo (Sobierajska et al., 2020; Wachowiak et al., 2000). All trees were screened with a diagnostic marker in the trnF-trnL intergenic region which distinguishes P. sylvestris chloroplast DNA from that of the P. mugo complex (Wachowiak et al., 2000). In pines, cpDNA is inherited from the paternal line and transmitted by pollen which covers a considerably greater distance than seeds (Burczyk & Chałupka, 1997; Poska & Pidek, 2010; Robledo-Arnuncio & Gil, 2005). Variability in the diagnostic region of the trnF-trnL cpDNA was assessed as the presence or absence of a DraI restriction site (“mugo” versus “sylvestris” haplotype, respectively). This analysis was particularly relevant for the detection of P. sylvestris specimens with the inclusion of P. uliginosa/P. mugo genes. Furthermore, the polymorphism of 11 mitochondrial DNA (mtDNA) regions, which are inherited from maternal lines in pines and transmitted by seeds was studied using 10 markers described by Donnelly et al. (2017) and one insertion-deletion locus (IN-DEL) in nad1 intron B/C (Soranzo et al., 2000). PCR amplification conditions and genotyping methods of the organellar regions analyzed are described in detail by Sobierajska et al. (2020) and Zaborowska et al. (2020). All allelic variants within each mtDNA marker were combined into one haplotype. The basic parameters of genetic variability for the studied populations, including the number of haplotypes, the number of private haplotypes, the effective number of haplotypes, and the diversity and variability of haplotypes, were calculated using the DnaSP 5 (Librado & Rozas, 2009) and MEGA 7 programs (Kumar et al., 2016). The relationships between the populations were assessed by the principal coordinates analysis (PCoA) in GENALEX based on the mean number of differences across all mtDNA sites calculated in the MEGA package.
. Biometric Traits and Data Analysis
The 2-year-old needles were characterized using 17 morphological and anatomical features (Table 2). The measurement procedures followed those described by Boratyńska et al. (2005), Boratyńska and Boratyński (2007), and Sobierajska et al. (2010). Each individual specimen was characterized on the basis of three needles, each of which came from a different dwarf shoot in the middle of a longer shoot from a well-lit region of the tree’s (bush’s) crown. The anatomical features were measured on slides containing the middle part of the needles (Boratyńska et al., 2003, 2005, 2019). The cones were characterized by 11 measured features and five proportions (Table 3) describing the shape and seed scales of the cone (Marcysiak, 2004; Staszkiewicz & Tyszkiewicz, 1972). The measurement procedures were adopted from Marcysiak (2004) and Marcysiak and Boratyński (2007). Cone length, width, diameter, and circumference were measured using closed cones after soaking, while the number of scales was determined on open cones after drying. Scale characteristics were determined for one scale on each cone, removed from the convex side in the region with the largest diameter. All measurements were made by hand using an electronic caliper.
Table 2
Mean (Mean), minimal (Min), and maximal (Max) values of needle characteristics and their coefficients of variation (V) of pines from Błędne Skały in the Stołowe Mountains National Park, determined in the field on the basis of macroscopic morphological characteristics and afterward verified using a chloroplast (bar-code) marker.
| Character | Akronym | S (N = 80) | M (N = 7) | UL (N = 19) | The p values for compared in pairs S, M, and UL | |||||||||||
|---|---|---|---|---|---|---|---|---|---|---|---|---|---|---|---|---|
| Mean | Min | Max | V | Mean | Min | Max | V | Mean | Min | Max | V | S/M | S/UL | M/UL | ||
| Needle length (mm) | NL | 47.97 | 25 | 92 | 18.8 | 48.00 | 39 | 58 | 9.8 | 45.75 | 30 | 62 | 12.9 | 0.999 | 0.693 | 0.870 |
| Number of stomatal rows on the convex (abaxial) side of needle | SRC | 9.83 | 5 | 17 | 15.3 | 8.48 | 6 | 11 | 12.2 | 9.42 | 7 | 13 | 13.2 | 0.187 | 0.652 | 0.439 |
| Number of stomatal rows on the flat (adaxial) side of needle | SRF | 8.64 | 5 | 13 | 16.5 | 7.00 | 5 | 9 | 7.8 | 7.56 | 5 | 11 | 13.3 | 0.058 | 0.036** | 0.708 |
| Number of stomata per 2-mm section of needle on convex side | SC | 22.32 | 17 | 29 | 7.0 | 20.08 | 16 | 27 | 11.8 | 20.39 | 17 | 27 | 7.5 | 0.029** | 0.001* | 0.928 |
| Number of stomata per 2-mm section of needle on flat side | SF | 22.22 | 19 | 26 | 6.4 | 20.82 | 19 | 23 | 5.9 | 20.41 | 17 | 23 | 5.6 | 0.136 | 0.000* | 0.842 |
| Number of resin canals | NRC | 10.58 | 3 | 17 | 19.6 | 4.90 | 3 | 7 | 25.9 | 6.14 | 2 | 15 | 36.6 | 0.000* | 0.000* | 0.505 |
| Width of needle (µm) | WN | 1,150.57 | 887 | 1,513 | 8.5 | 1,069.69 | 913.15 | 1,356.68 | 9.5 | 1,120.04 | 913.15 | 1,461.04 | 9.8 | 0.291 | 0.617 | 0.616 |
| Thickness of needle (µm) | TN | 627.36 | 444 | 835 | 7.9 | 664.67 | 573.98 | 834.88 | 10.0 | 674.68 | 521.80 | 860.97 | 9.9 | 0.403 | 0.022** | 0.936 |
| Distance between vascular bundles (µm) | DVB | 164.10 | 65 | 327 | 23.0 | 97.79 | 43.60 | 196.20 | 16.6 | 126.28 | 52.32 | 292.12 | 26.1 | 0.003* | 0.005* | 0.306 |
| Thickness of epidermal and hypodermal cells (µm) | TEH | 29.07 | 22 | 39 | 7.2 | 35.71 | 28.34 | 52.32 | 16.9 | 34.53 | 28.34 | 47.96 | 11.4 | 0.000* | 0.000* | 0.724 |
| Width of epidermal cell (µm) | WE | 16.38 | 11 | 24 | 8.6 | 16.26 | 7.85 | 21.80 | 17.0 | 15.69 | 11.99 | 19.62 | 8.7 | 0.986 | 0.342 | 0.765 |
| Marcet’s coefficient (DVB*WN/TN) | MCF | 304.83 | 112 | 666 | 26.6 | 159.14 | 62.05 | 334.27 | 20.7 | 212.97 | 67.27 | 563.37 | 29.7 | 0.002* | 0.001* | 0.386 |
| Ratio of stomatal row numbers on convex/flat side of needle | SRC/SRF | 1.16 | 0.71 | 1.83 | 11.6 | 1.22 | 0.75 | 1.60 | 11.8 | 1.27 | 0.90 | 2.00 | 11.2 | 0.658 | 0.046** | 0.825 |
| Ratio thickness/width of needle | TN/WN | 0.55 | 0.40 | 0.68 | 5.6 | 0.62 | 0.55 | 0.77 | 6.7 | 0.60 | 0.51 | 0.78 | 6.1 | 0.000* | 0.000* | 0.505 |
| Ratio width of epidermal cells/thickness of epidermal and hypodermal cells | WE/TEH | 0.57 | 0.37 | 0.83 | 10.7 | 0.46 | 0.26 | 0.54 | 9.1 | 0.46 | 0.33 | 0.61 | 11.6 | 0.002* | 0.000* | 0.997 |
| Cells between vascular bundles (%): | VB | |||||||||||||||
| Fiber-like cells with thick walls and restricted lumen | VBF | 89.90 | 0 | 100 | 18.7 | 54.10 | 0 | 100 | 62.2 | 69.33 | 0 | 100 | 48.6 | 0.015** | 0.029** | 0.941 |
| Semi-fibrous. intermediate cells | VBS | 7.42 | 0 | 100 | 165.8 | 27.95 | 0 | 90 | 85.4 | 12.33 | 0 | 80 | 116.9 | 0.023** | 0.311 | 0.449 |
| Cells with thin walls and intermediate lumens | VBI | 2.68 | 0 | 60 | 249.8 | 12.95 | 0 | 90 | 103.7 | 9.12 | 0 | 90 | 154.5 | 0.028** | 0.209 | 0.613 |
| Cells with thin walls and large lumens | VBL | 0 | 0 | 0 | 0 | 5.00 | 0 | 90 | 250.2 | 9.21 | 0 | 95 | 260.2 | 0.661 | 0.453 | 0.999 |
| Cells around resin canals (%): | RC | |||||||||||||||
| Fiber-like cells with thick walls and restricted lumen | RCF | 95.72 | 40 | 100 | 7.5 | 95.14 | 80 | 100 | 4.6 | 90.30 | 30 | 100 | 11.6 | 0.999 | 0.046** | 0.999 |
| Intermediate | RCI | 4.70 | 0 | 60 | 151.7 | 4.86 | 0 | 20 | 90.2 | 9.70 | 0 | 70 | 107.8 | 0.999 | 0.465 | 0.999 |
| Cells with thin walls and large lumens | RCL | 0.00 | 0 | 0 | 0.0 | 0.00 | 0 | 0 | 0.0 | 0.00 | 0 | 0 | 0.0 | - | - | - |
Table 3
Mean (Mean), minimal (Min), and maximal (Max) values of cone characteristics and their coefficients of variation (V) of pines from Błędne Skały in the Stołowe Mountains National Park, determined in the field on the basis of macroscopic morphological characteristics and afterward verified using a chloroplast (bar-code) marker.
| Character | Akronym | S | M | UL | The p values for compared in pairs S, M and UL | |||||||||||
|---|---|---|---|---|---|---|---|---|---|---|---|---|---|---|---|---|
| Mean | Min | Max | V | Mean | Min | Max | V | Mean | Min | Max | V | S/M | S/UL | M/UL | ||
| Length of cone (mm) | CL | 32.16 | 15.05 | 48.09 | 14.30 | 34.03 | 15.94 | 43.96 | 15.93 | 31.08 | 18.74 | 42.06 | 11.60 | 0.718 | 0.778 | 0.442 |
| Maximal diameter of cone (mm) | CD | 19.03 | 11.00 | 27.41 | 12.64 | 21.04 | 15.00 | 28.61 | 15.26 | 20.24 | 14.25 | 26.61 | 12.85 | 0.289 | 0.357 | 0.819 |
| Cone scale number | CSN | 66.15 | 45.00 | 97.00 | 10.84 | 79.15 | 54.00 | 99.00 | 14.26 | 74.98 | 54.00 | 102.00 | 13.07 | 0.008* | 0.006* | 0.587 |
| Length of cone scale apophysis (mm) | LA | 7.27 | 4.90 | 10.52 | 11.48 | 7.94 | 5.91 | 10.83 | 9.76 | 7.24 | 4.34 | 9.69 | 8.28 | 0.263 | 0.996 | 0.240 |
| Width of cone scale apophysis (mm) | WA | 7.09 | 4.87 | 9.58 | 10.68 | 7.42 | 5.78 | 8.78 | 9.07 | 6.75 | 5.15 | 8.72 | 8.90 | 0.679 | 0.376 | 0.199 |
| Thickness of cone scale apophysis (mm) | TA | 2.31 | 0.83 | 5.10 | 23.91 | 2.82 | 1.51 | 5.02 | 32.15 | 2.88 | 0.72 | 5.36 | 27.32 | 0.274 | 0.027** | 0.981 |
| Distance between umbo and scale top | DAU | 3.76 | 2.30 | 7.31 | 18.73 | 4.78 | 3.18 | 7.58 | 26.56 | 4.73 | 2.60 | 8.72 | 24.31 | 0.058 | 0.004* | 0.993 |
| Diameter of cone top (mm) | DCT | 3.87 | 2.16 | 6.30 | 14.63 | 3.84 | 2.74 | 5.24 | 10.46 | 3.64 | 2.07 | 5.55 | 12.61 | 0.993 | 0.436 | 0.759 |
| Diameter of the cone at the midpoint between the top and maximal diameter (mm) | CDM | 15.98 | 9.57 | 23.04 | 12.82 | 18.89 | 11.62 | 26.33 | 18.06 | 17.04 | 10.40 | 22.81 | 14.54 | 0.042** | 0.374 | 0.267 |
| Measurement of convex cone side from stalk to top (mm) | CVX | 41.12 | 22.00 | 73.00 | 13.99 | 42.90 | 20.00 | 55.00 | 12.06 | 39.73 | 28.00 | 52.00 | 10.83 | 0.818 | 0.755 | 0.531 |
| Measurement of concave cone side from stalk to top (mm) | CCA | 47.44 | 25.00 | 69.00 | 13.13 | 53.81 | 37.00 | 73.00 | 16.06 | 49.31 | 32.00 | 65.00 | 12.26 | 0.153 | 0.686 | 0.387 |
| Ratio of cone length/maximal diameter | CL/ CD | 1.69 | 1.09 | 2.13 | 8.06 | 1.62 | 0.98 | 1.91 | 11.03 | 1.55 | 1.01 | 2.47 | 10.72 | 0.631 | 0.016** | 0.614 |
| Ratio of cone length/number of scales | CL/ CSN | 0.49 | 0.26 | 0.90 | 13.92 | 0.43 | 0.26 | 0.60 | 13.54 | 0.42 | 0.29 | 0.55 | 8.51 | 0.212 | 0.005* | 0.904 |
| Ratio of cone scale apophysis length/width | LA/ WA | 0.11 | 0.07 | 0.20 | 14.24 | 0.10 | 0.07 | 0.14 | 16.01 | 0.10 | 0.05 | 0.15 | 15.96 | 0.564 | 0.086 | 0.918 |
| Ratio of cone scale apophysis length/thickness | LA/ TA | 3.37 | 1.46 | 7.63 | 21.19 | 3.02 | 1.77 | 4.41 | 20.69 | 2.78 | 1.41 | 8.33 | 32.17 | 0.649 | 0.068 | 0.819 |
| Cone asymmetry | CVX/ CCA | 0.87 | 0.43 | 1.26 | 6.11 | 0.81 | 0.47 | 0.98 | 8.32 | 0.81 | 0.62 | 1.27 | 8.82 | 0.086 | 0.016** | 0.959 |
The distribution of data was verified using the Shapiro–Wilks test and the homogeneity of their variances using the Brown–Forsythe test (Sokal & Rohlf, 2003; Zar, 1999). Prior to the analyses, the percentages were sine transformed and standardized using STATISTICA 9 (StatSoft PL). The basic statistical descriptors, including minimal, maximal, and average values of needle and cone characteristics, as well as their coefficients of variation were determined and analyzed for each species and each population in the Stołowe Mountains National Park. Principal component analysis (PCA) and discrimination analysis were used to detect possible clustering of individuals and populations in the Stołowe Mountains. In the latter analysis, the features of needles and cones with the highest coefficients of variation (SRC, SRF, VB, and RC; see Table 2) were omitted as potential sources of error (Sokal & Rohlf, 2003; Watała, 2002).
To assess the significance of differences in individual traits in pairwise comparisons between groups of individuals classified as P. sylvestris or P. uliginosa/P. mugo on the basis of cpDNA analysis, the HSD Tukey test was used for traits following normal distribution and the Kruskal–Wallis test analyzed those with a skewed distribution (Morrison, 1990; Sokal & Rohlf, 2003). The populations of P. sylvestris from the Stołowe Mountains were compared with each other to detect populations significantly deviating from the local pattern established for Szczeliniec Wielki, excluding the population from Błędne Skały, which could be influenced by possible P. uliginosa/P. mugo genes. The STATISTICA 9 software was used for the calculations.
. Results
. Genetic Differentiation
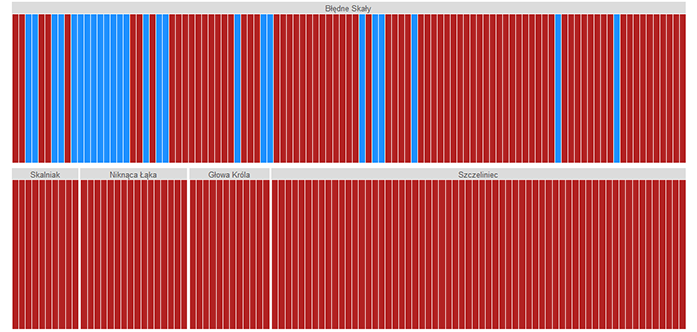
The analysis of the cpDNA marker region trnF-trnL revealed only 25 individuals with “mugo” haplotype in their plastid genome (Figure 2), and all of them were present exclusively on Błędne Skały. The majority were phenotypically identified during the sampling as P. uliginosa (15 trees) and P. mugo sensu stricto (seven trees). Only three trees with cpDNA characteristics of P. mugo had the P. sylvestris phenotype and one individual from Błędne Skały that was assigned in the field to P. uliginosa had the chloroplast genome of P. sylvestris.
Figure 2
Each individual’s Bayesian grouping based on the chloroplast marker trnF-trnL; optimal number of genetic clusters K = 2; individuals from the blue group have the “mugo” haplotype typical for the P. mugo complex, individuals from the red group have the “sylvestris” haplotype, typical for Scots pine; the order of individuals is as sampled in the field.
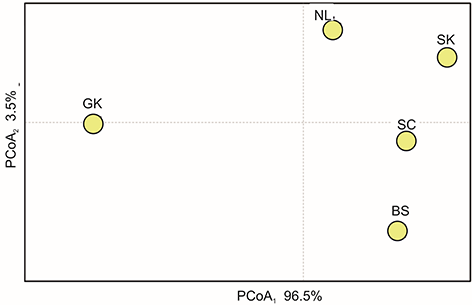
In total, nine mitochondrial haplotypes were detected in the studied samples from the Stołowe Mountains (Table 4), four of which were unique (one in the population of Błędne Skały, two in Szczeliniec, and one in Głowa Króla). The most common haplotype shared by 152 individuals was found in all populations and the corresponding haplotype diversity was generally low across stands (from 0.20 at Skalniak to 0.62 at Głowa Króla). The results of the principal components analysis showed high genetic similarity between the studied populations, except for the populations near Głowa Króla (Figure 3).
Table 4
Genetic variation of mitochondrial DNA in the hybrid population of P. sylvestris and P. uliginosa from Błędne Skały and four nearby pure species populations of Scots pine. Single specimens from Radkowskie Skały and Białe Skały stands were not included in the mtDNA analysis.
Figure 3
Genetic relationships of the Scots pine populations and hybrid population of the Błędne Skały based on mtDNA distances shown by multivariate scaling using the principal coordinates analysis (PCoA) method; population codes as in Table 1.
. Morphological Differentiation
. Mixed Population From the Błędne Skały
Morphological and anatomical analysis of the needles indicated that the compared taxa differed significantly in mean values of several features; however, the variation ranges overlapped (Table 2). Therefore, individuals cannot be unequivocally distinguished based on individual characteristics alone, whereas the simultaneous use of several traits allows for the classification of each individual as P. sylvestris, P. uliginosa, P. mugo, or a group of hybrids. Only a few individuals from 103 sampled at Błędne Skały were classified as P. mugo. Pinus sylvestris had a significantly (p < 0.01) greater number of resin canals (NRC), distance between vascular bundles (DVB), and Marcet’s coefficient (MCE), and the smallest epidermal and hypodermic layer thickness (TEH) compared to P. uliginosa/P. mugo. In addition, the number of stomata (SC and SF features) of P. sylvestris was significantly (p < 0.01) greater compared to P. uliginosa and P. mugo. In contrast, the needles of P. mugo did not differ significantly from the needles of P. uliginosa with respect to any character (Table 2).
Pinus sylvestris cones differed from P. uliginosa/P. mugo by displaying distinctly less scales, and from P. uliginosa by significantly thinner apophyses (TA and DAU) and more symmetry. The cones of P. mugo-like specimens in terms of habit were not statistically significantly different from those of P. uliginosa (Table 3). Despite statistically significant differences between the mean values of the above-mentioned features in the distinguished subpopulations, the ranges of their variability significantly overlapped.
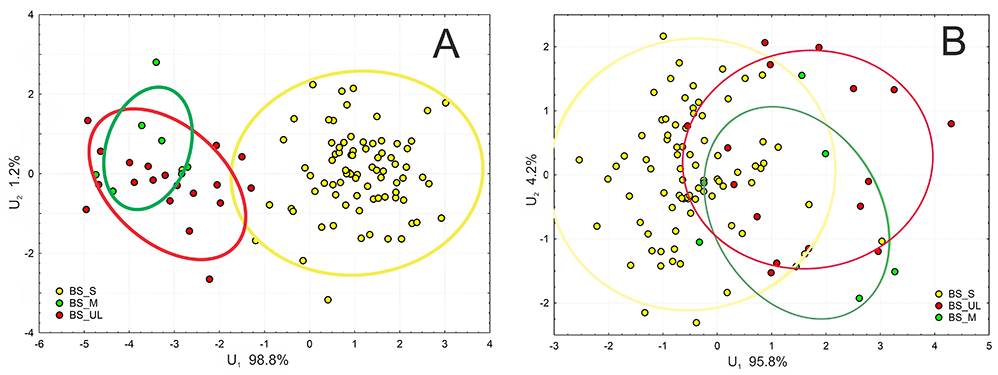
Discrimination analysis between specimens confirmed clear differences between P. sylvestris and the group of P. uliginosa/P. mugo (Figure 4A) based on needle characteristics, but much smaller differences based on cone traits. The ranges of multicharacter variability and 95% confidence intervals of all three groups, distinguished on the basis of cpDNA and phenotype, overlapped to a large extent (Figure 4B).
. Differentiation of Pinus sylvestris Populations in the National Park of the Stołowe Mountains
Comparison of the populations of P. sylvestris (including the specimens identified as this species in Błędne Skały) showed relatively low level of differentiation in terms of needle traits (Table S1). The populations from Błędne Skały and from Niknąca Łąka differed from the others at a statistically significant level (p < 0.01) with the largest number of traits. The most similar were the population pairs Błędne Skały – Białe Skały, Skalniak – Niknąca Łąka, and Szczeliniec Wielki – Białe Skały (Table S2). The level of variability of the population of P. sylvestris from Niknąca Łąka was the least among those compared, whereas the greatest degree of difference was shown in populations from Błędne Skały, Szczeliniec Wielki, and Niknąca Łąka.
Similar to the case of needle traits, the cone characteristics differentiated populations of P. sylvestris in the Stołowe Mountains National Park to a small extent, while the ranges of variability of traits between populations overlapped to a large extent (Table S3). Only the population from Niknąca Łąka showed more significant differences (p < 0.01) compared to the others. The pairs of populations Błędne Skały – Skalniak, Skalniak – Głowa Króla, Skalniak – Szczeliniec, as well as Szczeliniec – Głowa Króla did not show significant differences in any of the cone features (Table S4).
. Discussion
Pinus mugo and P. uliginosa are genetically similar to P. sylvestris at the nuclear, mitochondrial, and chloroplast genome levels. The relatively short divergence time between Pinus mugo and P. sylvestris (Wachowiak et al., 2011) and further differentiation of taxa included in the P. mugo complex (Dzialuk et al., 2017; Łabiszak et al., 2019; Wachowiak et al., 2013; Zaborowska et al., 2020; Żukowska et al., 2017; Żukowska & Wachowiak, 2017) are the reasons for a similar range of genetic variability in their neutral genetic markers (Wachowiak et al., 2018). Currently, a few fixed chloroplast DNA variations are known to clearly distinguish P. sylvestris from the P. uliginosa/P. mugo group taxa (Kormuták et al., 2017; Wachowiak et al., 2000, 2016). Recently, a mitochondrial marker has also been detected which can be used to distinguish P. uncinata from the other taxa of the P. mugo complex (Donnelly et al., 2017; Zaborowska et al., 2020). However, no sign of its presence in the analyzed samples (including a mixed population of Błędne Skały) was detected in our study. Therefore, we assumed that P. uncinata did not participate in the development of the hybrid population currently observed on Błędne Skały, at least in the form of providing seed inflow. Despite the high phenotypic diversity of pine trees in the mixed population of Błędne Skały, all 103 specimens examined showed low levels of differentiation within the mitochondrial genome; in fact, their variation was very similar to other analyzed stands that represent pure P. sylvestris populations. The subpopulations of P. sylvestris, P. uliginosa, and P. mugo from Błędne Skały exhibited low genetic distances among themselves and relatively high similarities at the level of haplotype diversity. As a result, they were placed close to each other and P. sylvestris populations in the PCoA analyses. Those results indicate the generally low discrimination power of the mitochondrial markers analyzed in terms of taxonomic investigations of the pine complex.
The studied pine specimens in the National Park of the Stołowe Mountains could be distinguished on the basis of the phenotypic traits and composition of the chloroplast genome (Dzialuk et al., 2017; Łabiszak et al., 2019; Wachowiak & Prus-Głowacki, 2008; Zaborowska et al., 2020; Żukowska & Wachowiak, 2017). Most of the 80 specimens from Błędne Skały that were determined as P. sylvestris based on phenotypic traits during sampling had cpDNA typical for this species. Only in the western part of Błędne Skały were a significant number of pines found with the P. sylvestris phenotype and a chloroplast marker of P. uliginosa/P. mugo in an earlier study (Sobierajska et al., 2020). In the central and eastern parts of Błędne Skały, sampled for the present study, P. sylvestris was the predominant species and most trees showed no signs of hybridization with P. uliginosa/P. mugo. In total, only three specimens with the P. sylvestris phenotype and containing the chloroplast diagnostic marker of P. uliginosa/P. mugo were found, whereas one specimen with the P. uliginosa phenotype but with P. sylvestris cpDNA was detected. It should be emphasized that the latter type of cryptic hybrid is currently the first such observation reported (see Jasińska et al., 2010; Sobierajska et al., 2020). The results indicate that the phenotype of the maternal species is preserved in some specimens of hybrid origin. In earlier studies, the presence of cryptic hybrids were postulated as P. sylvestris × P. uncinata (the westernmost European species in the complex of P. mugo) that resembled the phenotype P. sylvestris and stayed within the 95% confidence interval (at a marginal position) of P. sylvestris variation in the multivariate analysis of needle features (Jasińska et al., 2010).
All other P. sylvestris populations analyzed in our study consisted of only pure specimens of that species. This result disproved the theory of the occurrence of hybrid trees in the edge zones of the highest and middle structural level of the Stołowe Mountains, including the Skalniak plateau. The hypothesis on the possible cryptic hybrid P. sylvestris × P. uliginosa was formulated based on historical reports of the existence of P. uliginosa in regions other than Błędne Skały in the Stołowe Mountains, the Krągłe Mokradło and Długie Mokradło on the Skalniak plateau, and Niknąca Łąka (alleged as Małe Torfowisko Batorowskie), that were drained in the nineteenth century (Boratyński, 1994; Fiek, 1881; Neumann, 1838; Schube, 1903; Wimmer, 1832, 1857). In general, the result obtained in our study does not confirm the high level of hybridization of the pine species in the mixed population on Błędne Skały and indicates that hybridization is limited only to this population.
The specimens of P. sylvestris from Błędne Skały with a chloroplast genome typical of this species appeared similar to the comparative populations of this species in terms of needle and cone characteristics (Sobierajska et al., 2020). This indicates that the results of biometric analyses based on the morphological and anatomical features of the needles and the morphological features of the cones are similar to the results obtained in the analysis of phenotype and cpDNA variation, which were successfully used to distinguish P. sylvestris from the P. mugo complex taxa. In general, we observed a significant convergence of the results of specimen determination based on phenotypic, biometric, and genetic analysis. These data were inconsistent in the preliminary study on the material from the western part of Błędne Skały (Sobierajska et al., 2020).
Finally, it should be noted that there was a lack of cones typical of P. mugo in specimens with the phenotype of this species in Błędne Skały. In total, there were a few P. mugo-like specimens and all of them had asymmetric cones with thickened apophyses of scales. This is inconsistent with previous results of biometrical cone comparisons derived from isolated (allopatric) populations of P. mugo, P. uliginosa, and P. sylvestris (Boratyńska et al., 2005, 2014; Marcysiak & Boratyński, 2007). The cone of P. mugo showing characteristics of P. uliginosa on Błędne Skały could indicate a significant influence of the latter species, despite not being confirmed during molecular analyses with the application of genetic markers used in the present study.
Ongoing hybridization can be a method of preservation of P. mugo and P. uliginosa in the population mixed with P. sylvestris. To conserve P. mugo and P. uliginosa in Błędne Skały, an ex situ plantation or seed orchard should be established outside of the direct influence of P. sylvestris.
. Conclusion
Combined analysis of genetic data and the morphology of needles and cones with the application of phenotypic macroscopic assessments of trees in the field indicated the presence of four cryptic hybrids, three with the P. sylvestris phenotype and one with P. uliginosa, all limited to the area of Błędne Skały. The other analyzed locations from the Stołowe Mountains National Park represent mountain ecotypes of Scots pine with no evidence of hybridization with P. uliginosa/P. mugo. The data showed atypical cone features of limited P. mugo specimens from Błędne Skały with characteristics of P. uliginosa that suggest possible hybridization within the P. mugo complex in this area.
. Supplementary Material
The following supplementary material is available for this article:
Table S1. Mean, minimal, and maximal values of needle characteristics and their coefficients of variation of Pinus sylvestris populations from the Stołowe Mountains.
Table S2. Significance of differences between Pinus sylvestris populations in the Stołowe Mountains in the needle characters.
Table S3. Mean, minimal, and maximal values of cone characteristics and their coefficients of variation of Pinus sylvestris populations from the Stołowe Mountains.
Table S4. Significance of differences between Pinus sylvestris populations in the Stołowe Mountains in the cone characters.
