. Introduction
Copper is an important microelement present in many redox-active proteins, including electron transport chain components, antioxidant enzymes, and oxidases, among others (Yruela, 2009). High redox activity leading to the generation of reactive oxygen species (ROS) is the primary reason for the toxicity of high copper concentrations in plant cells (Szivák et al., 2009). High intracellular copper concentrations induce changes in gene expression, antioxidant enzyme activity, and small-molecule antioxidant synthesis (Burda et al., 2003, 2006; Jiang et al., 2016; Sabatini et al., 2009); therefore, copper homeostasis must be stringently regulated through a complex system. Indeed, intracellular copper ion concentration is precisely regulated by specific transporters (ATP-binding cassette transporters and copper-transporting P-type ATPases) and chaperones (yeast Atx1 homologs) (Burkhead et al., 2009), and all components of this mechanism are regulated by several genes. Notably, this mechanism may be modified during the process of adaptation.
Chlamydomonas reinhardtii P. A. Dang. (Volvocales: Chlorophyceae) can adapt to different copper ion concentrations. In a previous study, we showed that following the long-term cultivation of Chlamydomonas reinhardtii cells in a medium containing high copper concentrations, their ability to tolerate this metal increased significantly. However, the microevolutionary processes underlying this adaptation slightly differed among the cultivated populations (Pluciński et al., 2018). Therefore, the next step was to investigate the response of cell strains obtained from the same population to excess copper ions. For this, we derived strains from single cells using the method of serial dilution. In the present study, we compared cell strains obtained from populations adapted to high copper concentrations (Cu) and from populations without previous exposure to toxic copper ion concentrations (N). In these strains, we studied photosynthetic performance and growth rate during cell division in media supplemented with different copper ion concentrations based on chlorophyll fluorescence measurements. The observed differences indicated that Chlamydomonas reinhardtii cells present various adaptations, and in selected populations, many combinations of microevolutionary changes could be identified.
. Material and Methods
. Growth Conditions, Strain Selection, and Monitoring
For the experiments, we used the cell wall-less mutant (CW15) of Chlamydomonas reinhardtii and aseptically cultured it in Erlenmeyer flasks (250 mL) containing the Sager–Granick medium (Harris, 2009) supplemented with 100 mM mannitol as an osmoprotectant and sodium acetate (75 mM) and citrate (1.7 mM) as organic carbon sources. The copper ion concentration of the medium was 0.25 µM. The cultures were incubated in a growth chamber with gentle shaking at 22 ± 2 °C under the 16:8 light:dark cycle (at 50 µmol m−2 s−1 photosynthetic active radiation from a fluorescence lamp). Cell growth was monitored by measuring the maximal chlorophyll fluorescence intensity, as previously described by Pluciński et al. (2018).
After 4 years of cultivation at high copper ion concentration (5.25 µM), from the population adapted to copper, we obtained strains Cu1 and Cu2 using the serial dilution method. Using the same method, we also obtained strains N1 and N2 from the nonadapted populations of Chlamydomonas reinhardtii. The introductory characteristics of these basic populations have been reported by Pluciński et al. (2018). The microcultures used for testing the tolerance of the selected strains to increasing copper ion concentrations (0.25–200 mM) were aseptically grown in standard 48-well flat-bottom plates without shaking. Chlorophyll fluorescence parameters [FM – maximum chlorophyll fluorescence and FV/FM – maximum quantum yield of photosystem II (PSII)] were recorded using the PAM 101 (Walz, Germany) fluorometer. Fluorescence measurements were obtained from four biological replicates.
. Growth Curve Analysis
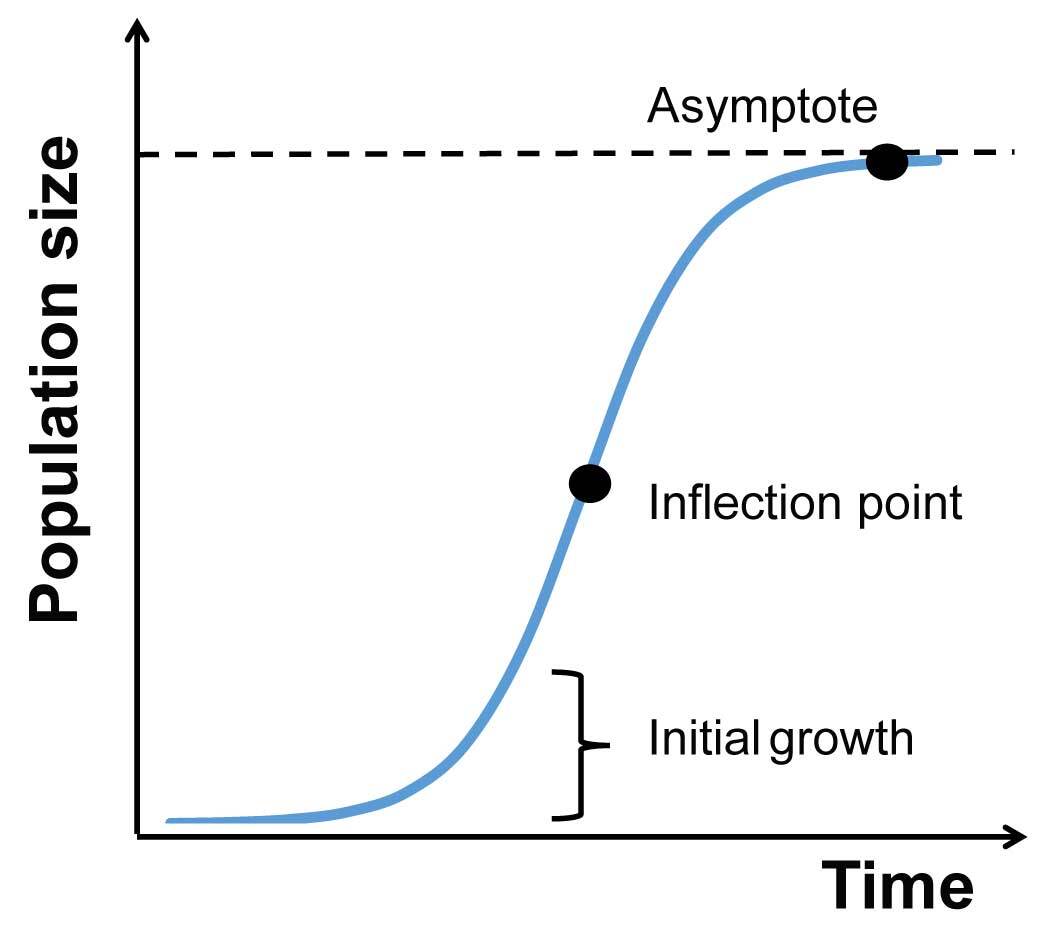
To analyze the changes in FM in the subsequent days of the experiment, we used a logistic growth model (Figure 1). This model is the simplest approach to simulate population growth in environments of limited carrying capacity (e.g., Gotelli, 2008). We used the following equation, where FM is expressed as a function of time [FM(t)]:
The above equation includes three parameters:
Initial growth (day−1): Intrinsic growth rate (rate of increase in chlorophyll fluorescence);
Asymptote [FM (a.u.)]: The carrying capacity of the environment and/or the ability of the alga to use resources;
Inflection point (day): The time point at which the growth rate of the population is the fastest, following which it slows.
The above parameters of logistic growth were estimated for each strain following exposure to a range of copper ion concentrations. At each copper ion concentration, the parameters of the strains and experimental populations (adapted and nonadapted) were compared. The analysis of parameter means allowed for the identification of the strains or populations that significantly differed from one another.
. Photosynthetic Apparatus Efficiency Analysis
To analyze the efficiency of the photosynthetic apparatus (FV/FM), we used data from fourth day onward, when the chlorophyll levels in the samples allowed for the measurement of fluorescence. The data were analyzed using a linear model, which considered the experimental population [Cu – copper-adapted and N – nonadapted (control)], copper ion concentration, and time. In addition, the effects of the strains were nested within the population from which they were derived. Initially, all possible interactions were included in the model, but nonsignificant interactions were sequentially removed to increase the power of the test. The parameters fitted to the linear model are listed in Table 1, Table 2, and Table S2.
Table 1
Analysis of the maximum quantum yield of photosystem II (FV/FM) considering the effects of the strains nested within the experimental population, measurement day, and copper concentration, as well as the relevant interactions of these factors.
. Software
FM and FV/FM were analyzed using JMP 12.2. All plots were created using the R package ggplot2 – a system for declaratively creating graphics (Wickham, 2016).
. Results
. FM
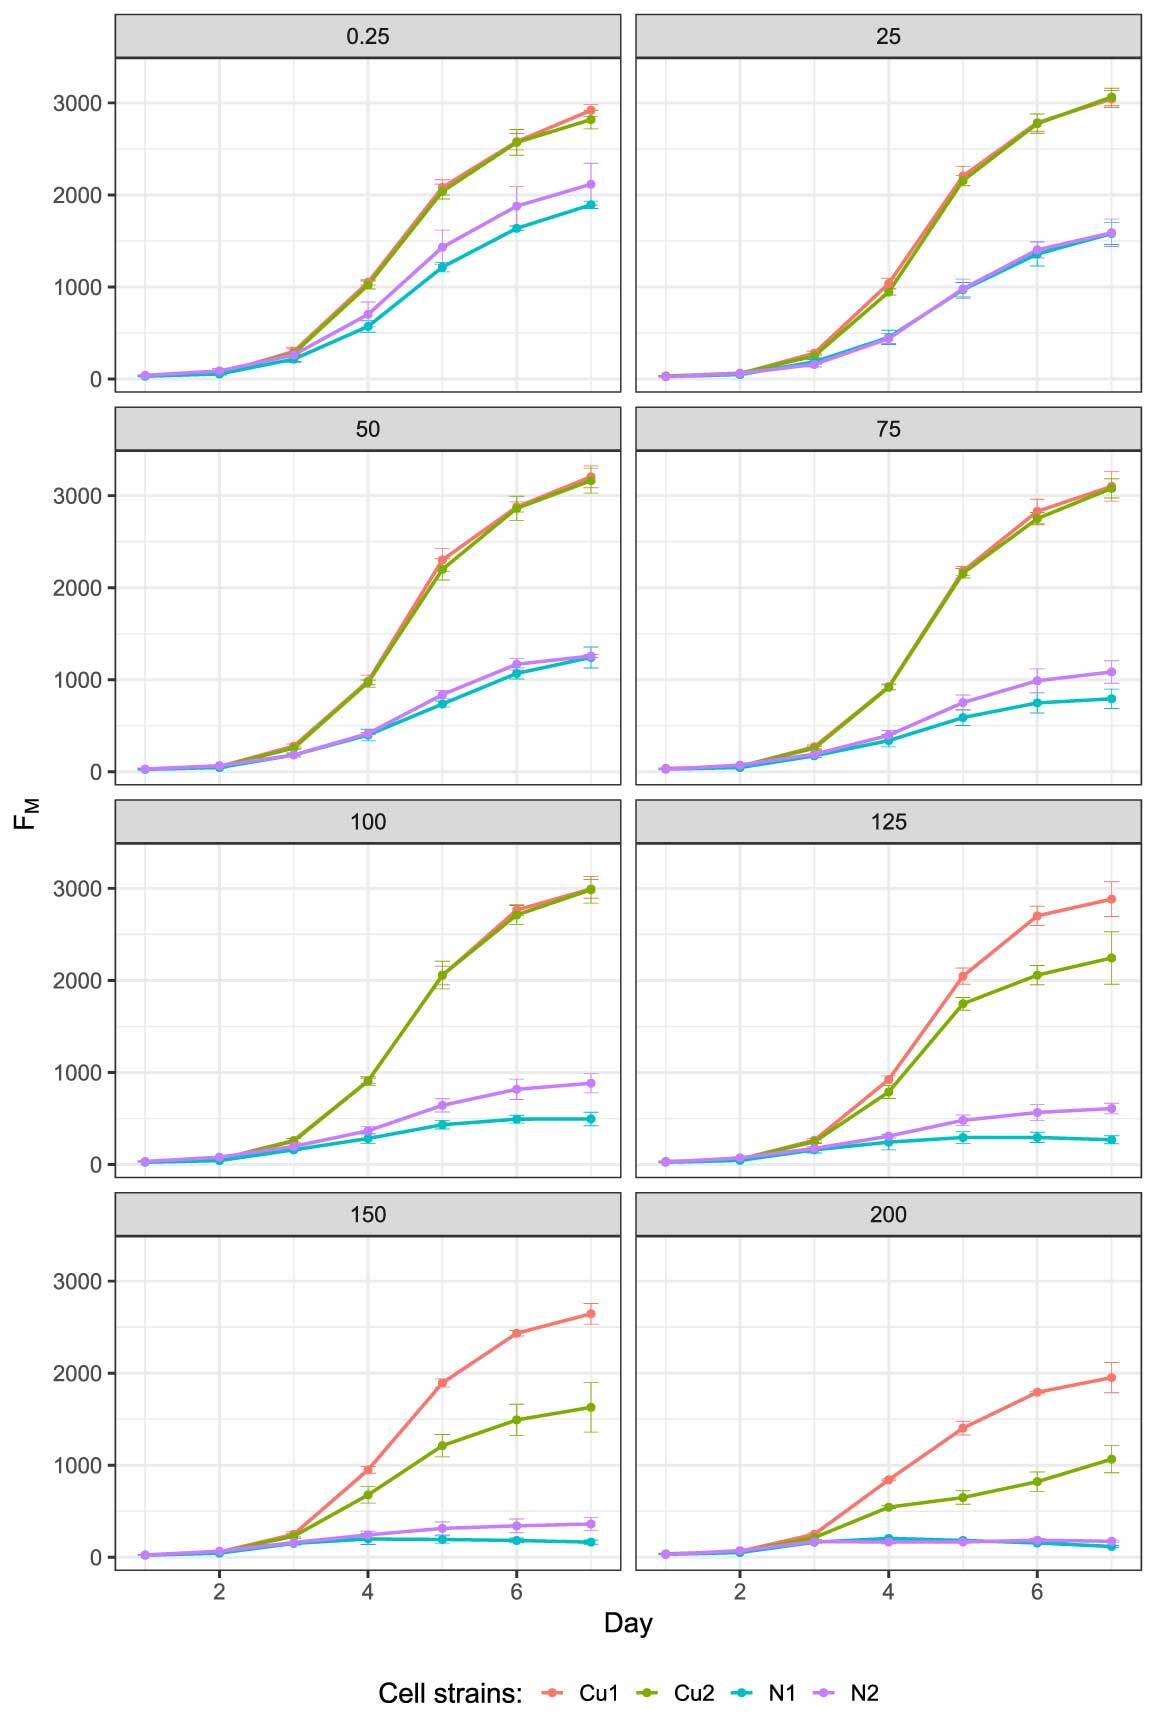
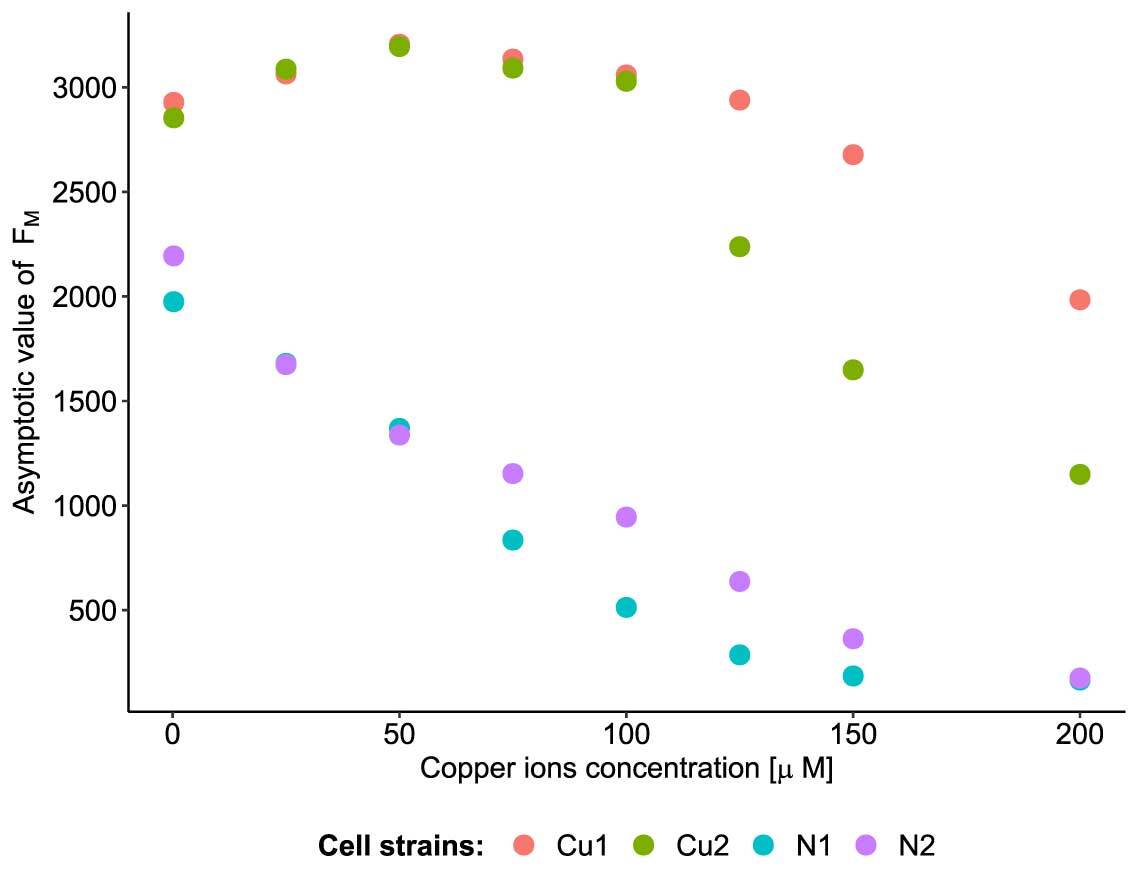
FM measurements revealed differences in the three parameters of population growth (for raw data, see Figure 2). The most pronounced differences were observed in growth asymptote, which differed between the Cu and N populations at all copper concentrations. The Cu populations always exhibited higher asymptotic growth than the N populations, and the magnitude of these differences increased with increasing copper ion concentration (Figure 3) (see Table S1 for parameter estimates). At the three highest copper ion concentrations, the strains differed in terms of asymptotic growth, and these differences were more pronounced in the Cu populations than the N populations (Figure 3).
The initial growth of the N populations was affected by all copper ion concentrations. However, in the Cu populations, decreased initial growth was detected only at the three highest concentrations (see Figure S1 for detailed graphs). The initial growth rate of strain N1 was significantly lower than that of the other strains at copper ion concentrations of 25 (1.22 day−1) and 50 µM (1.06 day−1). Meanwhile, the initial growth rate of strain N2 was lower at copper ion concentrations of 75 (1.15 day−1) and 100 µM (1.06 day−1). At the highest copper ion concentration, the N populations did not grow at all, and the two Cu strains differed in terms of the initial growth rate (Cu1: 1.36 and Cu2: 0.85 day−1; Table S1). Specifically, strain Cu1 grew 60% faster than Cu2.
The time point at which the populations reached the inflection point (i.e., exhibited the fastest growth, just before slowing down) fluctuated with copper ion concentration. At copper ion concentration of 25 µM, the growth rate of both N strains continued to accelerate for a relatively long time (N1: 4.78 and N2: 4.75 days). However, at copper ion concentrations of 100 and 125 µM, this duration was shortened for the N1 population (N1: 3.75 and N2: 2.9 days). At the two highest copper ion concentrations, the N strains reached their maximum growth earlier than the Cu strains (150 µM: N1: 2.41 and N2: 3.31 days; 200 µM: N1: 2.20 and N2: 2.06 days) (Figure 2 and Table S1). In other words, when exposed to copper ion concentration of 150 µM, the N populations exhibited a delay of 0.9 days compared with the Cu populations to reach their fastest growth (Table S1).
. FV/FM
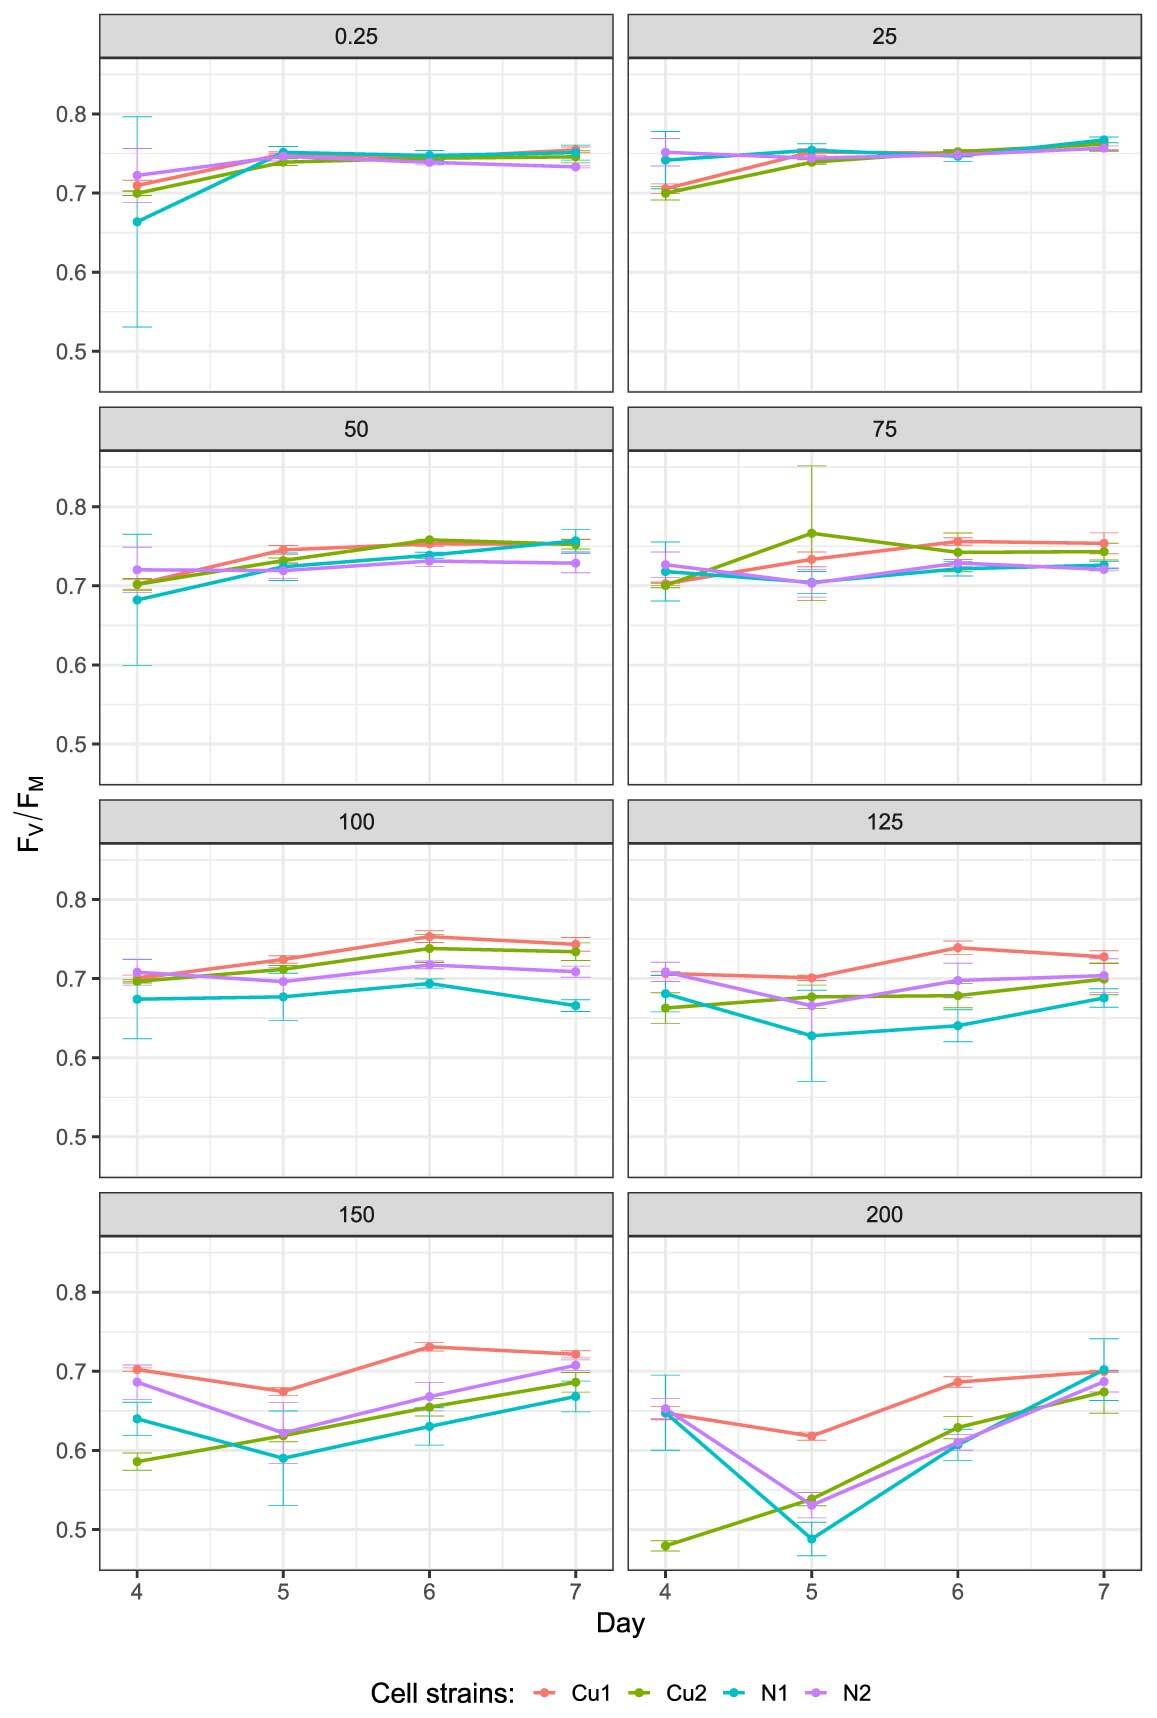
In all cell strains studied, FV/FM was negatively affected by increasing copper ion concentration (Figure 4), and this effect became more prominent in later days of the experiment. As such, the Cu strains showed higher values than the N strains, and the strains within each population also differed from one another (as indicated by low p values for the effects of the strains in Table 1 and Table 2). The variation in FV/FM was also shaped by two interactions: Experimental Population × Day and Copper Concentration × Day (Table 1). When the two population types were analyzed separately, the effects were similar, except for the lack of Copper Concentration × Day Interaction in the N populations (Table 2). In both cases, the differences between the strains remained significant.
Figure 4
Changes in the maximal quantum yield of photosystem II (FV/FM) from Days 4 to 7 after the inoculation of Chlamydomonas reinhardtii CW15 cells on media supplemented with different copper ion concentrations (0.25–200 µM). N1 and N2 – control strains; Cu1 and Cu2 – copper-adapted strains (four biological replicates).
. Discussion
. Adaptation to Copper Ions
Adaptation at the population level can be achieved through altered frequency of adaptive alleles, action of gene regulatory networks, or mutations in single elements responsible for homeostasis between the cells and environment. There are two popular models of adaptation: selective sweep and infinitesimal models. The selective sweep model assumes that the changes in allele frequency are rapid and indicative of increased fitness of the populations. The infinitesimal model links rapid adaptation to many small, parallel changes in allele frequency in response to environmental changes (Barghi et al., 2020).
The toxicity of high copper ion concentrations differs across groups of photosynthetic organisms (Beauvais-Flück et al., 2019). Exposure to high copper ion concentration alters ion uptake and intracellular distribution and activates copper detoxification mechanisms. For instance, COPT1 and COPT2 are inhibited, while other genes responsible for the relocation of copper ion within the cell are activated (Andrés-Colás et al., 2006; Sancenón et al., 2004). Recent studies have shown that the expression of copper proteins (Cu/Zn superoxide dismutase and plastocyanin) is regulated via miRNA synthesis (Burkhead et al., 2009; Pilon, 2017). Similar to other noxious factors, copper induces ROS generation, and this response is stronger than that of other heavy metals. Contreras-Porcia et al. (2011) noted increased expression of antioxidant enzymes (ascorbate peroxidase, glutathione-dependent peroxiredoxin, thioredoxin, and glutathione S-transferase) following copper ion exposure.
Our results, particularly the differences among single cell strains, may be explained by the complexity of the copper homeostatic system. Although the specificity of the present study did not allow us to highlight specific changes occurring during the experiment, we propose possible mechanisms underlying the observed adaptations.
. Growth Dynamics (FM)
Chlorophyll fluorescence measurements have been commonly used since long in plant physiology and ecophysiology. They are fast and noninvasive and can provide useful information concerning light energy conversion in the photosynthetic apparatus (Baker, 2008; Maxwell & Johnson, 2000).
Cell strains obtained from the adapted and nonadapted populations differed in terms of the maximal fluorescence of chlorophyll a (Figure 2 and Figure 3). Differences between the asymptote values of FM, which could even be observed at low copper concentrations, suggest that the selected strains differed in their ability to exploit macro- and micronutrients present in the growth medium (Figure 3). The more efficient uptake and transformation of nutrients may be a result of changes in the synthesis of membrane transporters (Burkhead et al., 2009). We speculate that the ability to take up all essential ions from the medium was higher in copper-adapted strains than in nonadapted ones. The reverse mechanism, based on the reduction of bivalent cations taken up from the environment, limits the ability to use other bivalent nutrients (e.g., Ca2+, Mg2+, and Zn2+). Other studies have shown that at high concentrations (≥150 µM), copper ions more strongly inhibited the ability of Chlamydomonas reinhardtii cells to take up nitrate from the growth medium than Cd2+ or Zn2+ (Devriese et al., 2001).
The complexity of the copper homeostatic system (uptake, relocation, and neutralization) (Burkhead et al., 2009) may be the source of the variability observed between the Cu strains. At intermediate copper concentrations, difference in the asymptote growth value between strains Cu1 and Cu2 derived from the same population was smaller than that between copper-adapted and nonadapted strains (Figure 3).
Heavy metals can decrease the rate of cell proliferation and induce anomalies during cell division, either directly or via ROS generation. According to Luis et al. (2006), copper ions interrupt the cell cycle by inhibiting cyclin-dependent kinases. ROS interact with nuclear transcription factors to interfere with processes regulated by mitogen-activated protein kinases (Leonard et al., 2004). In the present study, the cell division rate (estimated based on the initial growth rate) was decreased, particularly in strain N1 exposed to copper ion concentrations of 25 and 50 µM. Likewise, Jamers et al. (2013) observed a significant decrease in the growth rate following exposure to 125 µM CuSO4 (but not to ≤55 µM CuSO4); however, the authors did not use a logistic model to better understand the effects of copper ions on population growth. In the present study, high copper ion concentrations dramatically inhibited the growth of nonadapted strains, which prevented us from performing a more detailed analysis of their growth curves.
. Photosynthetic Performance (FV/FM)
Most of the copper ions present in plant cells accumulate in chloroplasts, which is directly related to the contribution of these ions to redox processes (Burkhead et al., 2009). In the view of constant exposure to the harmful effects of copper ions, chloroplasts employ various protective mechanisms, including copper binding (e.g., metallochaperones) and other protective strategies against the detrimental effects of ROS. Specifically, antioxidant enzymes (catalase, peroxidase, and dismutase), small-molecule antioxidants (ascorbate, glutathione, prenyl lipids, and carotenoids), and enzymes responsible for the regeneration of oxidized antioxidants (e.g., monodehydroascorbate reductase and glutathione reductase) enable efficient ROS neutralization (e.g., Foyer & Shigeoka, 2011; Nowicka et al., 2016b).
The thylakoid membrane in the chloroplast, specifically PSII, is the primary site affected by copper ion toxicity (Burda et al., 2003, 2006; Yruela, 2009). Therefore, the measurement of the maximal quantum yield of PSII based on the fluorescence of chlorophyll a (FV/FM) is widely used in experiments describing the interactions of heavy metals with the photosynthetic apparatus (Luis et al., 2006; Maxwell & Johnson, 2000; Nowicka et al., 2016a). Here, the parameters of the fitted growth model indicated that copper ion concentration, culture age, and population type, as well as the interactions of these factors, affected the photosynthetic apparatus (Table 1 and Table 2). The increase in the maximal quantum efficiency of PSII suggests that the process of adaptation was continuously underway during algal cultivation (factor: day in Table 1). Although mechanisms of chloroplast protection (e.g., ROS scavenging) are highly efficient, we cannot certainly pinpoint the precise mechanism underlying this adaptation. Notwithstanding, during the experiment, the interactions between copper and PSII evidently differed between the Cu and N populations as well as among the strains derived from these populations.
. Supplementary Material
The following supplementary material is available for this article:
Table S1. Growth parameters [growth rate, inflection point (i.e., time point of maximum growth), and asymptote] fitted to the strains and presented separately for each copper ion concentration.
Table S2. Additional data to Table 1 in the main text.
Figure S1. Growth of Chlamydomonas reinhardtii CW15 cells on media supplemented with different copper ion concentrations (0.25–200 µM) during the first 4 days, measured in terms of the maximal fluorescence of chlorophyll (FM).
