. Introduction
Soil moisture is an important limiting factor that affects plant growth and distribution (Deng et al., 2010). Based on trends in global climate change, droughts may become more severe in the future. Therefore, strategies for tolerance, adaptation, and survival are essential for plants that grow under drought conditions. Understanding the drought resistance mechanisms of plants is of remarkable significance for further evaluation and screening of plants with strong drought tolerance (Yi et al., 2016). Fukai and Cooper (1995) postulated that during long-term adaptation to arid environments, plants have evolved four mechanisms, including drought escape, drought resistance, drought tolerance, and rehydration. Under natural conditions, plants often switch between dry and wet environments. Their growth in arid environments is not only determined by the resistance and tolerance to stress, but also whether they can quickly compensate for the loss caused by stress during the rewatering process (Xu et al., 2010; Yang et al., 2019). Chen et al. (2015) defined drought adaptability based on the overall performance of plants in the process of drought and rewatering, which includes not only the drought resistance of plants, but also the resilience after rewatering.
Dicranostigma henanensis S. Y. Wang et L. H. Wu is a biennial or perennial herbaceous plant species belonging to the family Papaveraceae. It is mainly distributed in the vast hilly areas, 200–300 m above sea level in the north and south of the Luohe River in Luoyang (Henan Province, China). Dicranostigma henanensiswas first classified by Wu and Wang (1997) via karyotype analysis, which revealed that this species is different from D. leptopodum (Maxim) Feddle. Thus, D. henanensis is a new species of the genus Dicranostigma Hook. f. & Thomson. This plant blooms from March to May. Usually, one–three bright yellow colored flower(s) are developed on the top of stems and upper branches. Because of its tall and branched stature, green calyces and yellow flowers, and its prosperous blooms, D. henanensis has a high ornamental value. However, to date, the species has grown in the wild and in an undeveloped manner. For this reason, it is expected to be domesticated as an early spring ornamental flower plant, which can be widely used as a flower border grass resource in urban landscaping. In this study, a controlled potted experiment was used to study the effects of different degrees of drought stress and rewatering on the physiological characteristics of leaf photosynthesis and antioxidant enzymes. The aim of this research project was to provide knowledge for the application of this plant in arid or semiarid areas.
. Material and Methods
. Materials
In March 2019, in the Zhoushan Forest Park of Luoyang City, D. henanensis seedlings (with only three–four small leaves) with uniform growth conditions and size were selected. The experiment was conducted in the experimental fields of the Forestry College at the Kaiyuan Campus of Henan University of Science and Technology. The area is located in the Luolong District of Luoyang City, with a geographic location of 34°59 N and 112°16 E. Brown soil, collected from surrounding farmlands in Loulong District, was used for the potting experiments.
. Experimental Design
The seedlings that had grown to the two-leaf stage were transplanted into pots (diameter: 30 cm; height: 25 cm) with one plant per pot. The pot soil was dried in an oven at 105 °C in advance to a constant weight, and each pot contained 5 kg of dry soil. After a week of slow adaptation, the seedlings were subjected to drought stress treatment. The experiment was conducted in a greenhouse to avoid the interference of soil moisture caused by rainfall. In relation to the maximum water holding capacity in the field, there were four soil moisture settings: normal level (NL; 75%–80%), slight drought (LD; 60%–70%), moderate drought (MD; 55%–60%), and severe drought (HD; 45%–50%), which were controlled by weighing every 2 days. When the soil moisture content was below the set range, water was slowly added.
. Measurement Items and Methods
. Physiological Index
The photosynthetic parameters, including net photosynthetic rate (Pn), intercellular CO2 concentration (Ci), stomatal conductance (Gs), and transpiration rate (Tr) were measured and sampled on Day 0 (CK), 7, 14, 21, and 28 of stress treatment, and rewatering to CK level after sampling on Day 28. Index measurements and sampling were performed again on Day 7 (Day 35 of treatment) of rewatering. For each treatment, one plant was randomly selected from each replicate (four plants in total). Appropriate amounts (2.00 g) of mature leaves (the third or fourth leaf from the top) were collected to measure superoxide dismutase (SOD; EC 1.15.1.1) activity, chlorophyll content, relative conductivity (REC), and thiobarbituric (TBARS) content. The chlorophyll content of the plants was determined using the 95% ethanol method (Zou, 2003).
. REC Measurement Method
The measurement method was similar to that described by H. S. Li (2000), with slight modifications. Leaf discs (5 mm in diameter and avoiding the main vein) were collected using a puncher. Approximately 0.5 g of the leaf discs was placed into a 50 mL beaker, and 10 mL of distilled water was added to it. After sealing and shaking for 1 min, a DSS-120 conductivity meter was employed to measure the conductivity, E0. After placing the beaker at room temperature for 24 hr with thorough shaking, the conductivity value, E1, was measured. The beaker was heated in a boiling water bath for 15 min and cooled to room temperature. Thereafter, the conductivity value, E2, was measured. The REC was calculated using the following formula:
. SOD and TBARS Measurements
Preparation of Enzyme Solution
The protocol used to prepare the enzyme solution was similar to that described by H. S. Li (2000) and Zou (2003), with slight modifications. Approximately 0.5 g of fresh sample was measured and transferred into a precooled mortar. Subsequently, 5 mL of 0.05 M phosphate buffer (0.05 M, pH 7.0) was added, and then an appropriate amount of quartz sand with 0.1% polyvinylpyrrolidone (PVP) was transferred into the mortar. After grinding, the solution was centrifuged for 20 min at 10,000 g at 4 °C. The supernatant was stored as an enzyme solution.
SOD Activity Measurement
Prior to the measurement of SOD activity, the enzyme solution (0.1 mL) was loaded into 10 mL centrifuge tubes. Thereafter, 0.2 mL methionine (Met), 0.2 mL 4-nitro blue tetrazolium chloride (NBT), 0.2 mL ethylenediaminetetraacetic acid (EDTA), 0.2 mL riboflavin, and 3.0 mL phosphate buffer (0.05 M, pH 7.8) were added. After mixing, one test tube was placed in the dark, and the control test tube and other test tubes were subjected to light treatment at 4,000 lx for 20 min. Using the test tube placed in the dark as a blank control, the absorbance value was measured with a spectrophotometer (722N; Shanghai Instrument Electric) at a wavelength of 560 nm. The unit for SOD activity was expressed as an enzyme activity unit that inhibited 50% of the photochemical reduction of NBT. SOD activity was calculated using the following formula:
SOD activity = [(Control light absorbance value − The light absorbance value of the sample tube) × Total volume of the enzyme solution] / (Control light absorbance value × Fresh weight of the sample × Volume of added enzymesolution × 50%).
TBARS Measurement
This measurement was carried out by loading the enzyme solution (1.5 mL) into a 10 mL centrifuge tube and adding 2.5 mL of 0.5% thiobarbituric acid (TBA). After boiling in a water bath for 20 min followed by cooling, the tube was centrifuged for 10 min at 1,000 g at 4 °C. The control was a mixture of 1.5 mL distilled water and 2.5 mL 0.5% TBA. Using this as a blank, the absorbance value of the supernatant was measured at wavelengths of 450, 532, and 600 nm. TBARS content was calculated using the following formula:
where V represents the volume of the supernatant (mL) and W is the fresh weight of the sample (g).
. Photosynthesis Index
The third and fourth leaves from the top in the same light receiving direction were used to measure the photosynthetic parameters. A Li-6400 portable photosynthesis system (Li-COR; Lincon, NE, USA) was employed with a measurement time of 9 a.m.–11 a.m., and the intensity was set to 1,200 µmol m2 s−1. The measured parameters included the Pn, Ci, Gs, and Tr. The stomatal limit (Ls) value was also calculated using Ls = 1 − Ci/Ca, where Ca is the atmospheric CO2 concentration. Water use efficiency (WUE) was calculated using WUE = Pn/Tr.
. Results
. Effects of Drought and Rewatering on the Physiological Parameters of Dicranostigma henanensis Plants
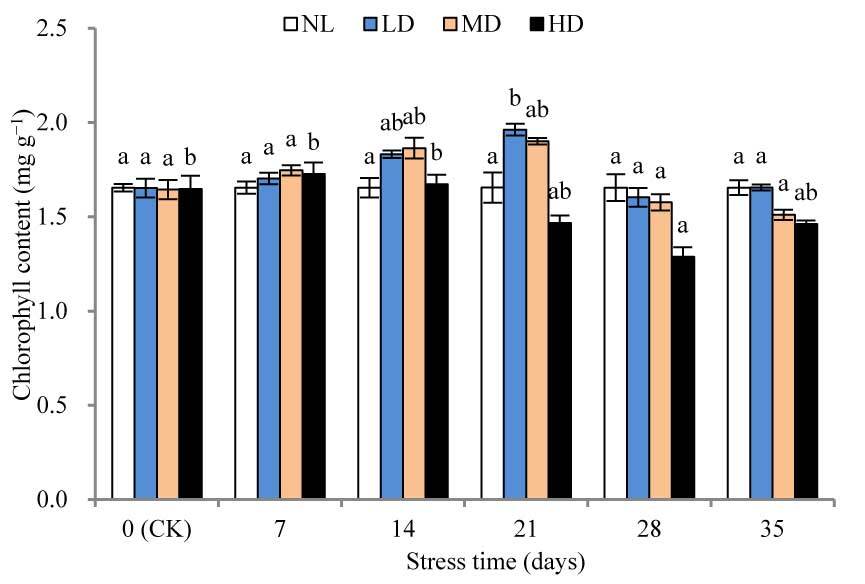
The chlorophyll content of LD and MD peaked after 28 and 21 days, respectively, while that of HD appeared after 7 days (Figure 1). Thereafter, the chlorophyll content of all treatments decreased, and after 28 days, the chlorophyll content of HD was significantly different from that at CK (p < 0.05). After rehydration, the chlorophyll content of each treatment increased slightly; however, the difference from that at CK was not significant.
Figure 1
Effects of drought and rewatering on chlorophyll content in the leaves of Dicranostigma henanensis. NL, LD, MD, and HD indicate normal levels, light drought, moderate drought, and heavy drought, respectively. Different lowercase letters indicate significant differences at the 0.05 level.
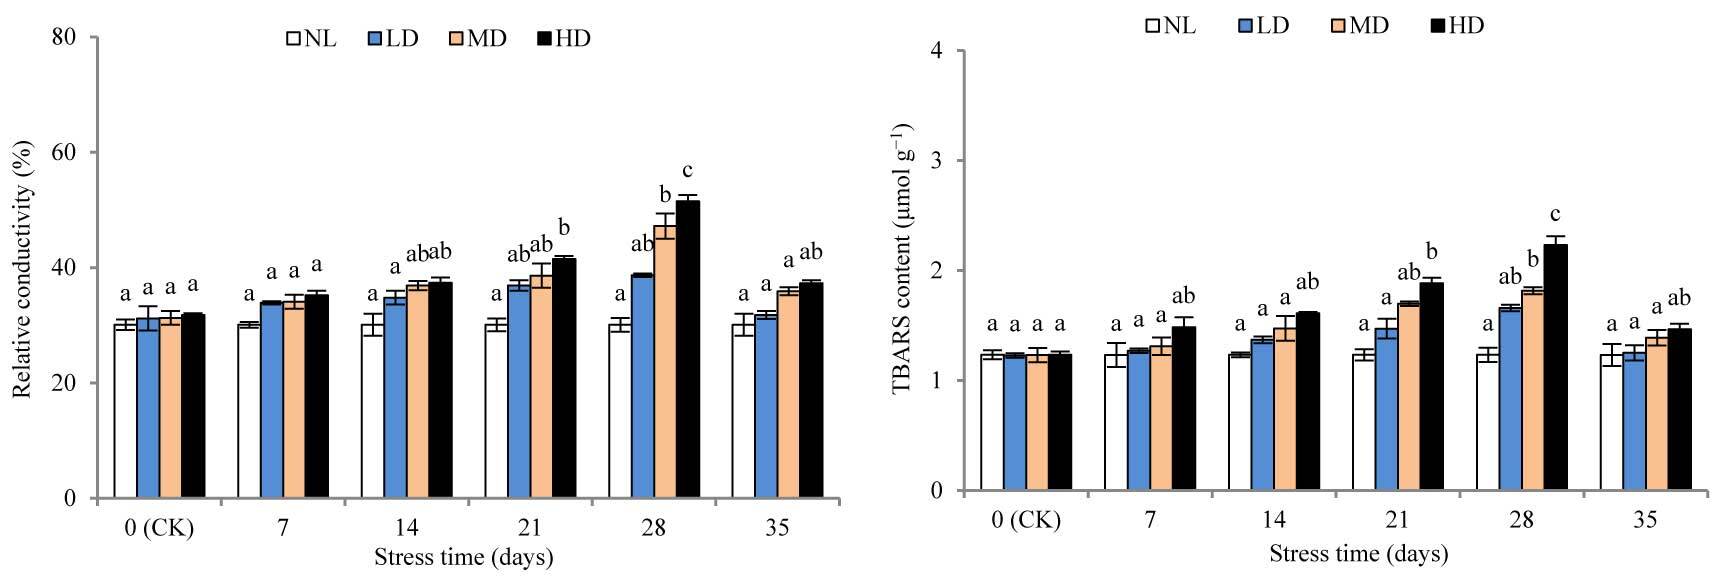
After 28 days of stress treatment, the REC and TBARS contents of LD were not significantly different from those at CK, whereas the contents of REC and TBARS of MD and HD were significantly different from those at CK after 28 and 21 days of stress treatment (p < 0.05) (Figure 2). After rehydration, the REC and TBARS contents of each treatment showed marked declines, where the MD, HD, REC, and TBARS contents remained markedly higher than those at CK; however, the differences were not significant.
Figure 2
Effects of drought and rewatering on relative conductivity and thiobarbituric (TBARS) acid in the leaves of Dicranostigma henanensis. Different lowercase letters indicate significant differences at the 0.05 level.
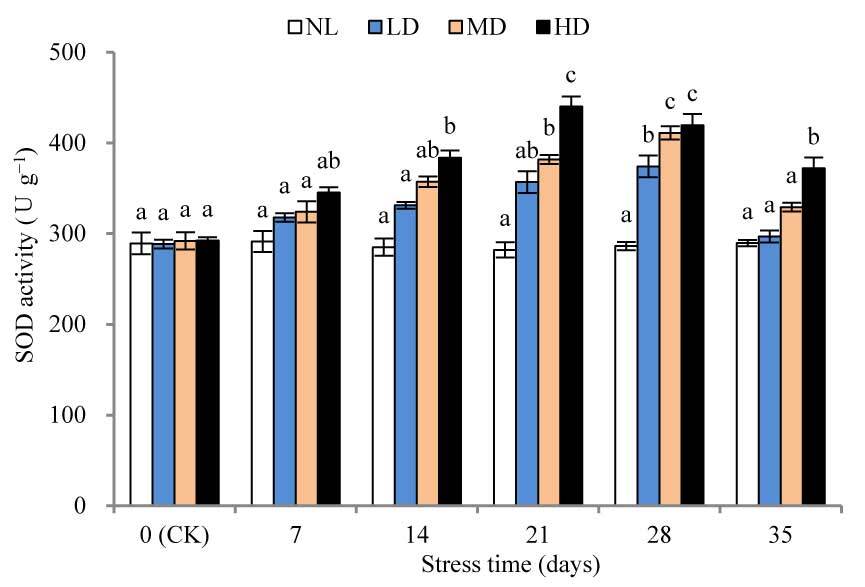
The SOD activities of LD and MD were significantly different (p < 0.05) from the corresponding values at CK after 28 and 21 days of stress treatment, respectively (Figure 3). After 28 days of stress treatment, SOD activity was increased by 29.69% and 40.82%, respectively, compared with that at CK, for LD and MD. For HD, SOD activity was significantly different from that at CK after 14 days of stress treatment (p < 0.05) and peaked after 21 days, with a 50.59% increase; thereafter, SOD activity decreased slightly. After rehydration, the SOD activity of each treatment decreased significantly, but remained higher than that at CK. The SOD activity of HD was significantly different from that at CK (p < 0.05).
. Effects of Drought and Rehydration on the Photosynthetic Parameters of Dicranostigma henanensis Plants
The Pn values of LD, MD, and HD were significantly different from those at CK after 28, 14, and 7 days of stress treatment, respectively (Figure 4). After 28 days, the percentage decreases in Pn values for LD, MD, and HD were 26.59%, 54.55%, and 75.89%, respectively, compared with those at CK. The Pn values of LD, MD, and HD recovered to 109.88%, 96.65%, and 89.49% of the CK, respectively. Notably, an over-compensation effect was caused by LD; however, the value was not significantly different from that at CK.
Figure 4
Effects of drought and rewatering on net photosynthetic rate (Pn), stomatal conductance (Gs), intercellular CO2 concentration (Ci), and transpiration rate (Tr) in the leaves of Dicranostigma henanensis. Different lowercase letters indicate significant differences at the 0.05 level.
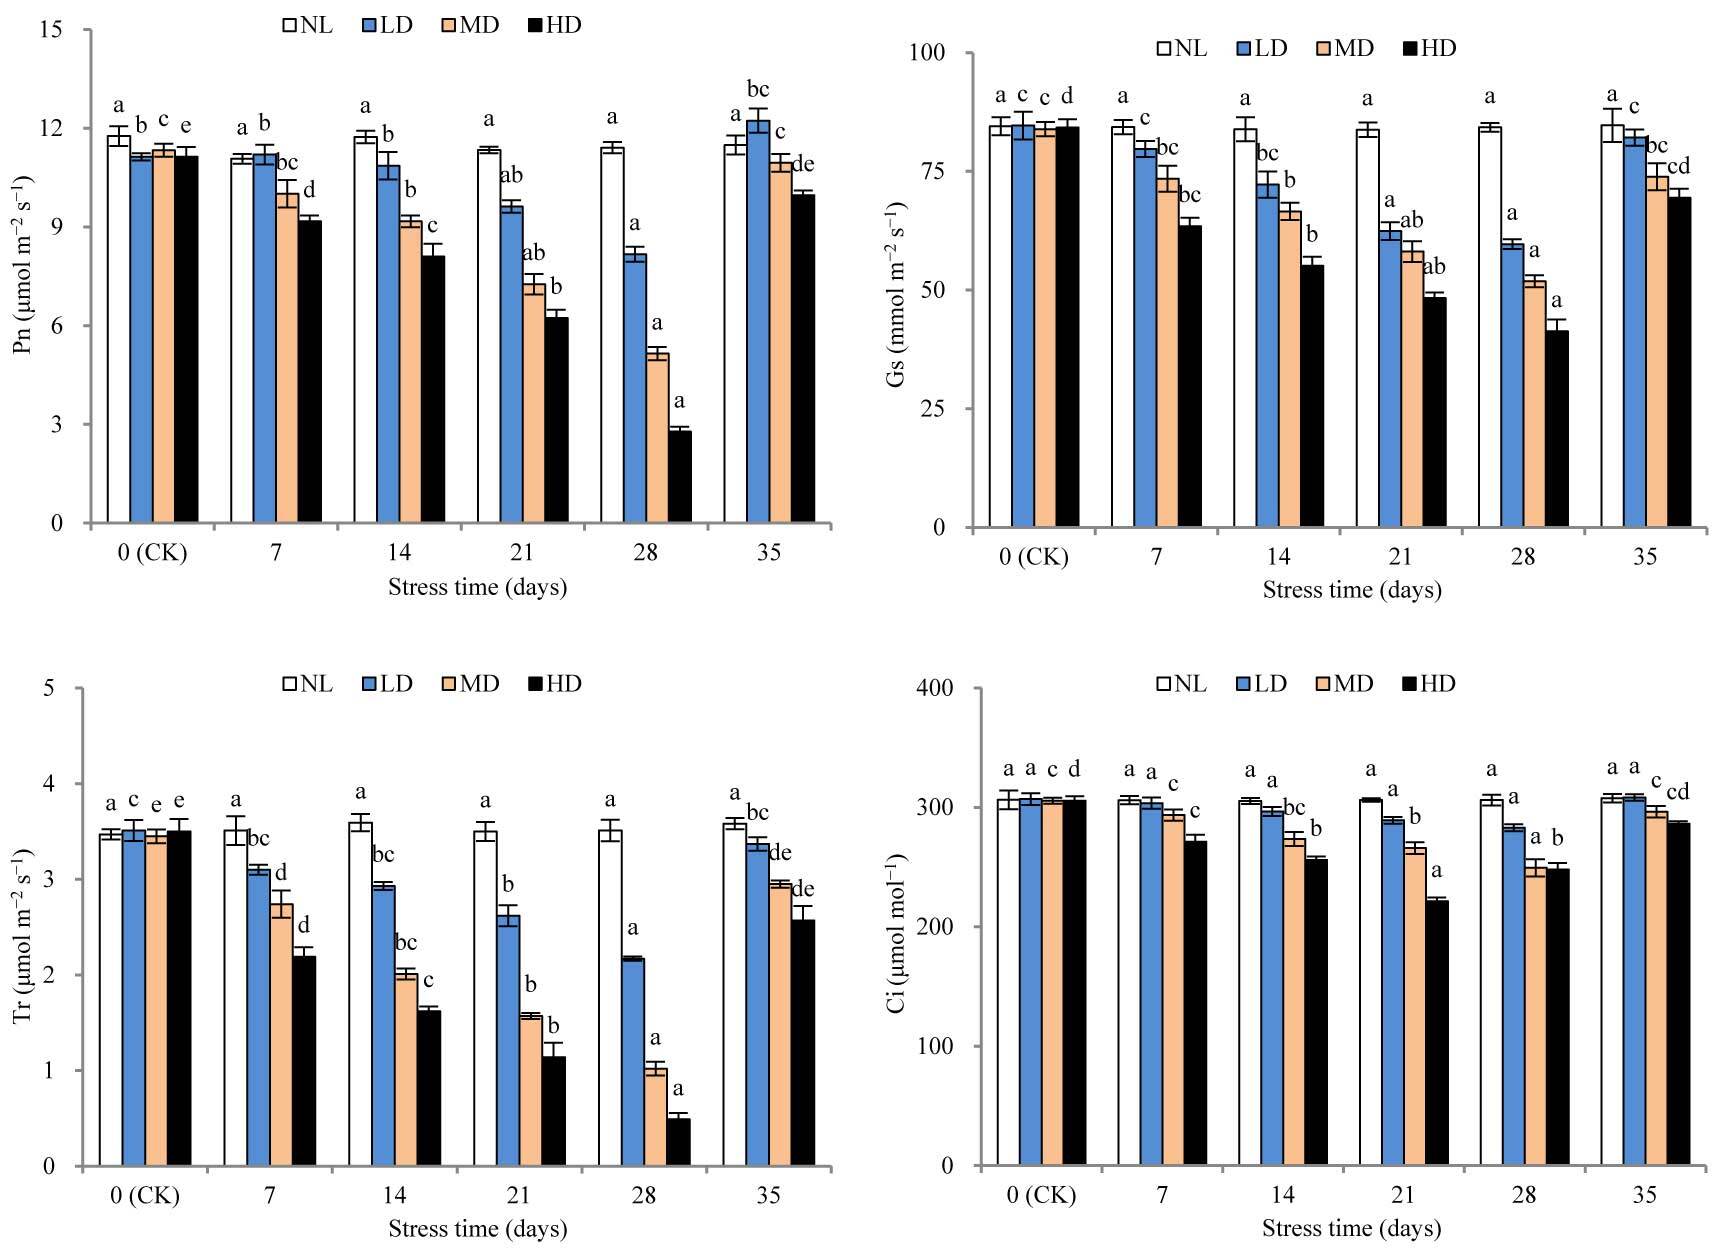
The Gs values of LD, MD, and HD were significantly different from those at CK after 21, 14, and 7 days of stress treatment (p < 0.05). After 28 days of stress treatment, the Gs values of LD, MD, and HD decreased by 29.51%, 38.17%, and 50.92%, respectively, compared with those at CK. After rehydration, the Gs values of all treatments increased, and no significant difference was found relative to that at CK.
The Tr value of LD was significantly different from that at CK after 21 days of stress treatment (p < 0.05). However, for HD and MD, significant differences were found in this value after 7 days. After 28 days of stress treatment, the Ts values of LD, MD, and HD decreased by 38.18%, 70.44%, and 86.00%, respectively, compared with those at CK. After rehydration, the Ts values of LD, MD, and HD were restored to 96.01%, 85.51%, and 73.43% compared to those at CK, respectively. There was no significant difference relative to that at CK.
With the extension of drought stress time, the Ci values of LD and MD showed a continuous decrease, while the Ci value of HD first decreased and then increased. The Ci value of LD was not significantly different from that at CK after 28 days of stress treatment. However, the Ci value of MD was significantly different from that at CK after 21 days of stress treatment (p < 0.05). For HD, the Ci value was the lowest after 21 days of stress treatment; this value was significantly different from that at CK (p < 0.05). After rehydration, the Ci values of all treatments were restored to CK levels.
With the extension of stress time, the LS values of LD and MD showed continuous increasing trends, while the LS value of HD first increased and then decreased (Figure 5). The LS value of LD was not significantly different from that at CK after 28 days of stress treatment. However, the LS value of MD was significantly different from that at CK after 14 days (p < 0.05). Moreover, the LS value of HD reached its peak after 21 days, which was significantly higher than that at CK (p < 0.05); however, this was followed by a sharp decline. After rehydration, the LS values of LD and MD showed different degrees of decrease, and the LS value of HD slightly increased; however, these values were not significantly different from those at CK.
Figure 5
Effects of drought and rewatering on water use efficiency (WUE) and stomatal limitation value (Ls) in the leaves of Dicranostigma henanensis. Different lowercase letters indicate significant differences at the 0.05 level.
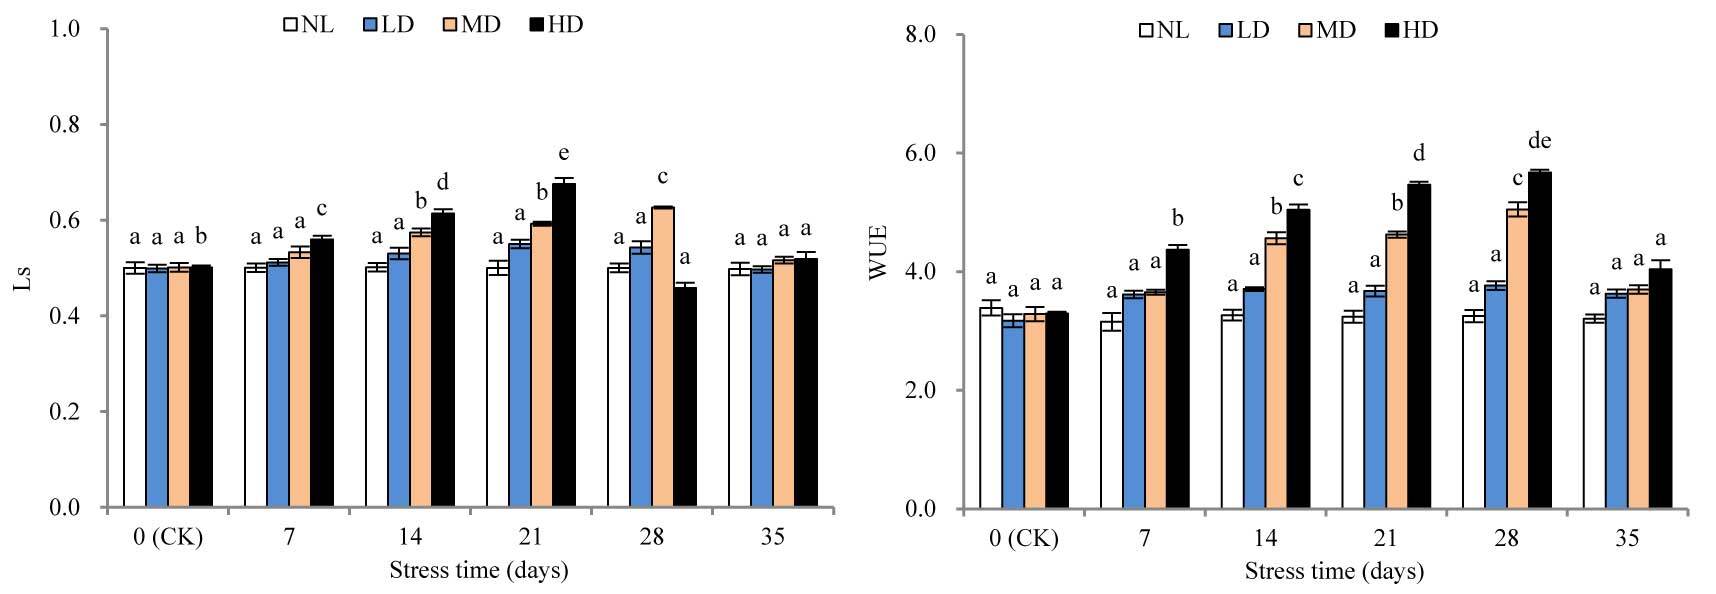
With the extension of drought stress time, the WUE of all treatments increased. In fact, the WUE of LD was not significantly different from that at CK after 28 days of stress treatment. However, the WUE of MD and HD was significantly different from that at CK after 14 and 7 days, respectively (p < 0.05). After rehydration, in all treatments, the WUE was restored to CK levels.
. Discussion
. Effects of Drought and Rehydration on the Metabolism of Dicranostigma henanensis Plants
During drought, rewatering can cause changes in plant physiological mechanisms, such as restoring physiological metabolic activity and physiological damage, and compensating for physiological functions that are reduced by drought stress (Mo et al., 2016). Chlorophyll content can reflect changes in plant photosynthesis to a certain extent; thus, it can be used as an indicator of the sensitivity of plants to drought stress (Gholinezhad & Darvishzadeh, 2021). Some studies have reported that drought stress not only inhibits the biosynthesis of chlorophyll, but also increases the activity of chlorophyllase and the rate of its decomposition, resulting in a decrease in chlorophyll content (Piveta et al., 2021). However, some studies have found that drought stress causes the chlorophyll content to increase, and some results suggest that it may be caused by reduced water content during water stress (An et al., 2010). In this study, drought stress caused the overall chlorophyll content of each treatment to increase and then decrease. The initial increase phenomenon is consistent with the results of Song et al. (2012), and the subsequent decrease may be caused by the reduced rate of chlorophyll synthesis and the acceleration of decomposition due to continuous drought stress. In addition, this study found that when the stress lasted 28 days, only the chlorophyll content of HD decreased to a significantly different level compared with that at CK (p < 0.05). The chlorophyll content of all treatments quickly recovered to the CK level after rehydration, indicating that chlorophyll synthesis was not fundamentally destroyed by drought stress.
Drought destroys the structure and function of the plant cell membrane system, with the membrane system as the first victim’s position (Luo et al., 2011). REC reflects the cell membrane permeability of plants, and MDA is an important product of membrane lipid peroxidation. Therefore, REC and MDA are important indicators of the degree of damage to plant plasma membranes (Niu et al., 2018). In this study, the contents of REC and MDA in each treatment showed a continuously increasing trend, which indicates that the damage to the cell membrane by drought stress gradually increased. This is consistent with the results found in Poa pratensis L. (Shao, 2008), Trifolium repens L. (Z. Li et al., 2013), and Aegilops tauschii (N. Wang et al., 2019). After rewatering, the cell membrane system gradually recovered to the level at CK, indicating that rewatering could compensate for the physiological functions of crops due to water stress (Bian & Jiang, 2009). Yang et al. (2019) showed that water stress significantly increased the poinsettia cell extravasation conductivity, and drought-resistant cultivars were restored to levels before stress after rewatering; however, the drought-sensitive varieties were not restored. In this study, the contents of REC and TBARS decreased rapidly after rewatering, and the difference between the treatments and the CK levels was not significant. Thus, through its own regulation, the membrane system damage caused by drought stress in D. henanensis plants was actively repaired.
SOD is an important protective enzyme in plants, and its activity is considered an important indicator of drought resistance in plants. Drought-resistant varieties not only maintained higher SOD activity to scavenge O2− in the rehydration process, but also POD, CAT corresponding synergy to further clarify H2O2 to the maximum extent to avoid damage of active oxygen on the cell membrane. In general, drought-resistant varieties have a stronger antioxidant capacity during drought and rewatering (J. Bai et al., 2009). This study found that during the drought stress process of LD, MD, and the early stage of HD (7–21 days), SOD activity increased rapidly, indicating that the D. henanensis plant can remove O2−. However, between 21 and 28 days of stress, the SOD activity of HD decreased slightly, which may be explained as the excessive drought stress was found to exceed its tolerance limit, thereby aligning with previous studies (N. Wang et al., 2019). After rehydration, SOD activity of LD and MD was restored to the CK level, while that of HD remained significantly higher than that at CK (p < 0.05), indicating that severe drought stress and rehydration treatment increased the level of O2−. This finding is also consistent with that obtained for Lysimachia davurica Ledeb (Zhang et al., 2016).
. Effects of Drought and Rehydration on the Photosynthetic Characteristics of Dicranostigma henanensis Plants
Photosynthesis is the basis of plant growth and development, and is one of the physiological processes of plants that are most sensitive to drought stress (Flexas et al., 1998). To a certain extent, the level of Pn can reflect the damage to plants induced by drought stress and their ability to resist drought stress. The stomata control water loss and CO2 gain, and GS indicates the degree of stomatal opening during transpiration and photosynthesis. Therefore, stomatal closure and lowering of GS in plants are considered the first line of defense against drought stress (Soyza et al., 2004). To prevent the excessive loss of water under drought conditions, plants will properly close their stomata to reduce water consumption; however, the closing of the stomata is at the cost of losing part of photosynthesis (Funk & Zachary, 2010). In this study, drought stress treatments decreased Pn and GS, indicating that by reducing GS, D. henanensis plants controlled and regulated gas exchange and other physiological activities (indicated by Pn) to reduce their need for water and achieve enhanced drought adaptability. This result is consistent with that obtained in Zea mays L. (Yu et al., 2015), Phaselous vulgaris L. (Miyashita et al., 2005), and Brassica napus L. (P. Bai et al., 2014).
Drought stress reduced Pn for two reasons: the stomatal factor, for example, due to stomatal closure, external CO2 supplied to the chloroplast is reduced, resulting in reduced Pn; and the nonstomatal factor, which is due to the destruction of photosynthetic organs and the lower photosynthetic activity of mesophyll cells, leading to a decrease in Pn (Tang, 1983). Farquhar and Sharkey (1982) believe that the specific causes for the decrease in Pn can be determined based on whether the changing trends of Gs and Ci are consistent. When Gs and Ci both decrease, the change is caused by the stomatal limiting factor; if Gs decreases but Ci increases or does not change, it is caused by the nonstomatal limiting factor. This study found that the Ci of LD and MD always showed continuously decreasing changes, which indicates that under mild and moderate drought stress, stomatal closure is the main factor restricting the photosynthesis of D. henanensis plants. However, the Ci of HD first increased and then decreased, indicating that some metabolic pathways may be inhibited due to the severe dehydration of leaves in the late stage of severe stress. As the main factor is limited photosynthesis, nonstomatal limitation becomes the main factor (Brodribb & Holbrook, 2003; Flexas & Medrano, 2002; Ortiz-Lopez et al., 1991). Some researchers have also determined that the induction of Pn decreases according to changes in Ci and Ls. Specifically, if the decrease in Pn was caused by the stomatal factor, Ci decreased and Ls increased; however, if the decrease was due to the nonstomatal factor, Ci increased and Ls decreased (X. Guo et al., 2018). In this study, during drought stress treatment, the LS values of LD and MD increased continuously, and the Ls value of HD first increased and then decreased. Considering the change in the trend of CI during the late stage of HD (i.e., late severe drought stress), the nonstomatal limiting factor was identified as the main cause for the lowering of Pn.
Tr is an important index reflecting the water metabolism of plants (Habermann et al., 2021). Without significantly lowering Pn, reducing Tr as much as possible is an important strategy for plants to adapt to drought environments (P. Li et al., 2020). WUE is the ratio of Pn to Tr, which to a certain extent, reflects the adaptation of plants to drought. In fact, improved WUE is a response mechanism of plants’ adaptation to dry habitats (Jin et al., 2012). In this study, with the extension of stress time, the Tr values of all drought treatments declined continuously, while WUE showed increasing changes. These results suggest that, with increasing drought stress, D. henanensis plants increased WUE by reducing Tr, prompting the decline of Pn to some extent, which is important for maintaining osmotic balance and normal physiological and biochemical processes under drought conditions. After 28 days of stress treatment, compared with the value at CK, the Tr values of LD, MD, and HD decreased by 38.18%, 70.44%, and 86.00%, respectively, which are markedly greater than the decline in Pn (26.59%, 54.55%, and 75.89%, respectively). Thus, the increase in WUE was due to a greater decline in TR than Pn, which is consistent with the results of Heitholt (1989). In addition, after 28 days of stress treatment, the GS values for all treatments, compared with the corresponding value at CK, decreased by 29.51%, 38.17%, and 50.92%, respectively, which are significantly less than the decrease in TR. These results may be due to the reduced availability of soil moisture. Further, Tr was demonstrated to not only be affected by the moisture condition of the blade, but also by soil water status. Through stomatal closure, plants reduce moisture transpiration when soil moisture is insufficient, thereby avoiding dehydration-induced damage.
During rehydration, plants can compensate for the loss caused by drought stress by improving the physiological and metabolic functions of leaves, such as stomatal movement and photosynthesis (L. Wang et al., 2006). Studies have shown that the drought resistance of some plants is related to their ability to rehydrate after drought. Further, plants with strong drought resistance have a higher ability to recover after rewatering (Z. F. Guo et al., 2011). In this study, after rehydration, the Pn, Gs, Tr, and Ci values of all treatments increased to varying degrees, and returned to the CK level, similar to Ls and WUE. These results indicate that the LD, MD, and HD treatments in our study did not damage the photosynthetic apparatus of D. henanensis plants. In addition, the Pn value of the LD after rehydration was significantly higher than that at CK. This may be due to the temporary effects of rehydration on photosynthesis. The stimulating effect of rehydration restored Pn to a normal or an even higher value than that at CK in a short period of time, which is called the “compensation effect.” This phenomenon has also been observed in other plants, especially in crops, such as Glycine max (L.) Merr. (L. Wang et al., 2006) and Arachis hypogaea L. (Lauriano et al., 2004).
. Conclusion
In conclusion, during periods of soil drought, leaf Pn, Gs, Tr, and Ci decrease, while membrane permeability, lipid peroxidation, LS, WUE, and SOD activity increase. However, these physiological characteristics can recover to control levels after rewatering for 7 days. Through the protective enzyme system, the reactive oxygen species caused by drought stress can be cleared and a high osmotic potential can be maintained. In addition, through stomatal closure, Gs reduction, and reduced WUE by lowering Tr, plants actively reduce their photosynthetic efficiency to accommodate drought stress. Owing to these characteristics, D. henanensis plants have strong drought adaptability and are thus expected to develop into an important herbaceous flowering plant for use in flower borders in semiarid and arid areas.
