. Introduction
It has been estimated that over 75% of the globally most important food crops depend, to some extent, on animal pollination (Klein et al., 2007), and insect pollination was shown to enhance fruit and seed quantity and quality (Bisui et al., 2020; Bommarco et al., 2012; Castle et al., 2019; Garratt et al., 2014; Pereira et al., 2015; Sushil et al., 2013). However, over the past decades, severe losses in insect pollinator numbers and diversity have been reported (Cameron et al., 2011; Kevan & Phillips, 2001; Rhodes, 2018; Antoń & Denisow, 2018). The main causes of this phenomenon include agricultural intensification, spreading of insect pathogens, habitat loss, and shortage of food resources (Dance et al., 2017; Fürst et al., 2014; Jachuła, Denisow, & Wrzesień, 2018; Łoś et al., 2020; Wrzesień et al., 2016; Xiao et al., 2016), and it can reduce agricultural profitability (Gallai et al., 2009; Winfree et al., 2011) and threatens overall biodiversity (Brodie et al., 2014; Potts et al., 2010).
Nectar is a floral reward that mediates mutualistic relationships between the majority of angiosperms and visiting insects (Bożek, 2019; Nepi et al., 2018; Palmer-Young et al., 2019); it is an aqueous solution of sugars and other minor constituents, e.g., amino acids, proteins, alkaloids, phenolics, and metal ions (Nicolson & Thornburg, 2007; Roy et al., 2017) and is considered an important source of energy to pollinators (Hayashi et al., 2016; Somme et al., 2015). Nectar secretion patterns, sugar concentration, nectar sugar mass, and nectar chemical composition (primarily sugar and amino acid composition) are crucial factors affecting insect visitor guilds as well as frequency and duration of visits to flowers (Brown & Brown, 2020; Jachuła et al., 2019; Nepi et al., 2018; Shackleton et al., 2016; Strzałkowska-Abramek, 2019).
The reproductive success of entomophilous plants species depends on insect activity which is influenced by nectar availability (Denisow et al., 2016, 2018; Heil, 2011; Liu et al., 2015; Zhao et al., 2014). Studies on nectar production may thus be useful to estimate a plant’s attractiveness to pollinators (Masierowska & Piętka, 2014; Nagy-Déri et al., 2013; Schmidt et al., 2015), which in turn affects yield and quality of fruit and seeds (Bożek, 2012; Quinet et al., 2016), even in self-fertile taxa (de O. Milfont et al., 2013; Denisow, 2002).
Highbush blueberry (Vaccinium corymbosum) has become a popular commercial crop in Europe. This species has attracted attention due to its pleasantly sweet fruits which are also a source of biologically active compounds, especially antioxidants (Cardeñosa et al., 2016; Pervin et al., 2016). Poland is one of the leading producers of blueberries – in 2019, total fruit yield exceeded 25,000 tons, and approximately 6,700 tons of fruit were exported, predominantly to countries of the European Union (Statistics Poland, 2019). However, data on nectar production by highbush blueberry under the climatic conditions of Poland are scarce and were collected only regarding very young shrubs (Jabłoński et al., 1983).
The present study was conducted to examine nectar production and insect visitors in six varieties of V. corymbosum. In particular, (i) diurnal patterns of flowering and flower abundance, (ii) nectar secretion dynamics and nectar sugar yield, and (iii) the spectrum of insect visitors were investigated.
. Material and Methods
. Varieties and Study Site
The study was carried out from 2002 to 2005. Six V. corymbosum varieties were used, i.e., ‘Bluecrop,’ ‘Bluejay,’ ‘Croatan,’ ‘Darrow,’ ‘Northland,’ and ‘Spartan,’ which had been grown in Niemce (51°22′ N, 22°38′ E; south-eastern Poland) on a farm covering 0.25 ha, established in 1993. The shrubs had been planted at 2 m × 1 m spacing (5,000 plants/ha). In the local climate, V. corymbosum blooms in May or June (Bożek, 2009).
. Blooming and Insect Visitors
To assess flower abundance per shrub, each variety’s number of flowers per inflorescence (n = 15), number of inflorescences per shoot (n = 15), and number of shoots per shrub (n = 15) were counted and multiplied, respectively. The spectrum and abundance of insect visitors/m2 were recorded during full flowering. Observations were carried out for 5 min in 1-hr intervals between 6 a.m. and 8 p.m. (GMT + 2 hr) for 3 consecutive days.
. Nectar Production
Nectar production was evaluated during full flowering. The pipette method described by Jabłoński (2002) was used. To prevent nectar collection by insect visitors before sampling, inflorescences were covered using tulle bags. The dynamics of nectar production were monitored at different stages of flower development (interval = 1 day) from the budding stage (1–2 hr before flower opening; ‘Day 0’) until corolla wilting. Nectar was collected using tarred glass pipettes, with 12 replications. A single sample contained nectar of 5–10 flowers. The concentration of sugars (% w/w) in nectar was measured using an Abbe refractometer (Carl Zeiss AG, Jena, Germany). Using nectar mass and nectar sugar concentration data, nectar sugar mass (at the peak of nectar sugar secretion) was calculated per flower and per shrub.
. Weather Conditions
Meteorological data were collected from a weather station in Niemce. Mean air temperature and precipitation data of 2002–2005 were compared to long-term data collected in 1951–2005 (Table 1). Regarding the month of April, the highest air temperatures were recorded in 2002 and 2005, which exceeded the long-term norm by 1.1 and 1.6 °C, respectively; in these periods, 50% less precipitation than usual was recorded. The highest air temperatures of the month of May were recorded in 2002 and 2003. In May 2005, heavy rainfalls occurred, and precipitation exceeded the long-term norm by more than 60%.
Table 1
Mean air temperatures and precipitation in the study years 2002–2005 and long-term data of 1951–2005 for Niemce, SE Poland.
| Month | Year | ||||
|---|---|---|---|---|---|
| 2002 | 2003 | 2004 | 2005 | 1951–2005 | |
| Air temperature in °C | |||||
| April | 8.6 | 6.5 | 7.9 | 9.1 | 7.5 |
| May | 17.3 | 16.3 | 11.9 | 13.2 | 13.0 |
| Precipitation in mm | |||||
| April | 18.3 | 40.7 | 38.1 | 18.6 | 42.0 |
| May | 28.6 | 71.4 | 38.0 | 96.0 | 57.7 |
. Data Analyses
Data were analyzed using STATISTICA software v.13.1 (StatSoft Poland, Cracow, Poland). Before analyses, data distribution was tested for normality. Data on nectar mass per flower and sugar mass per flower were log10-transformed; data on numbers of flowers per shrub and on sugar mass per shrub were square-root transformed. A one-way analysis of variance was applied to test differences between years and between varieties. Means were compared post hoc using Tukey’s HSD test at α = 0.05.
. Results
The diurnal pattern of blooming was similar between varieties; therefore, only that of ‘Bluecrop’ is described. Bloom development peaked in the evening hours (Figure 1). The number of flower buds that opened between 6 p.m. and 7 p.m. constituted approximately 30% of the total number of flowers developed throughout the day. Both number of flowers per inflorescence and number of inflorescences per shrub differed between years (F3, 356 = 16.011; p < 0.001 and F3, 356 = 11.661; p = 0.001, respectively) and varieties (F5, 354 = 5.046; p < 0.001 and F5, 354 = 45.481; p < 0.001, respectively) (Table 2). Consequently, effects of year (F3, 354 = 3.457; p = 0.019) and variety (F5, 354 = 35.549; p < 0.001) on the number of flowers per shrub were observed. Flowering was most abundant in variety ‘Northland’ and least abundant in ‘Darrow’ (4.07 ± 0.95 vs. 1.63 ± 0.64, in thousands of flowers per shrub, respectively).
Figure 1
Diurnal pattern of flowering expressed as numbers of newly opened flowers in 1-hr intervals in relation to the total number of newly opened flowers throughout the day, and diurnal frequency of insect visitors of Vaccinium corymbosum ‘Bluecrop’ observed in Niemce, SE Poland. Shown are mean values over the years of the study.
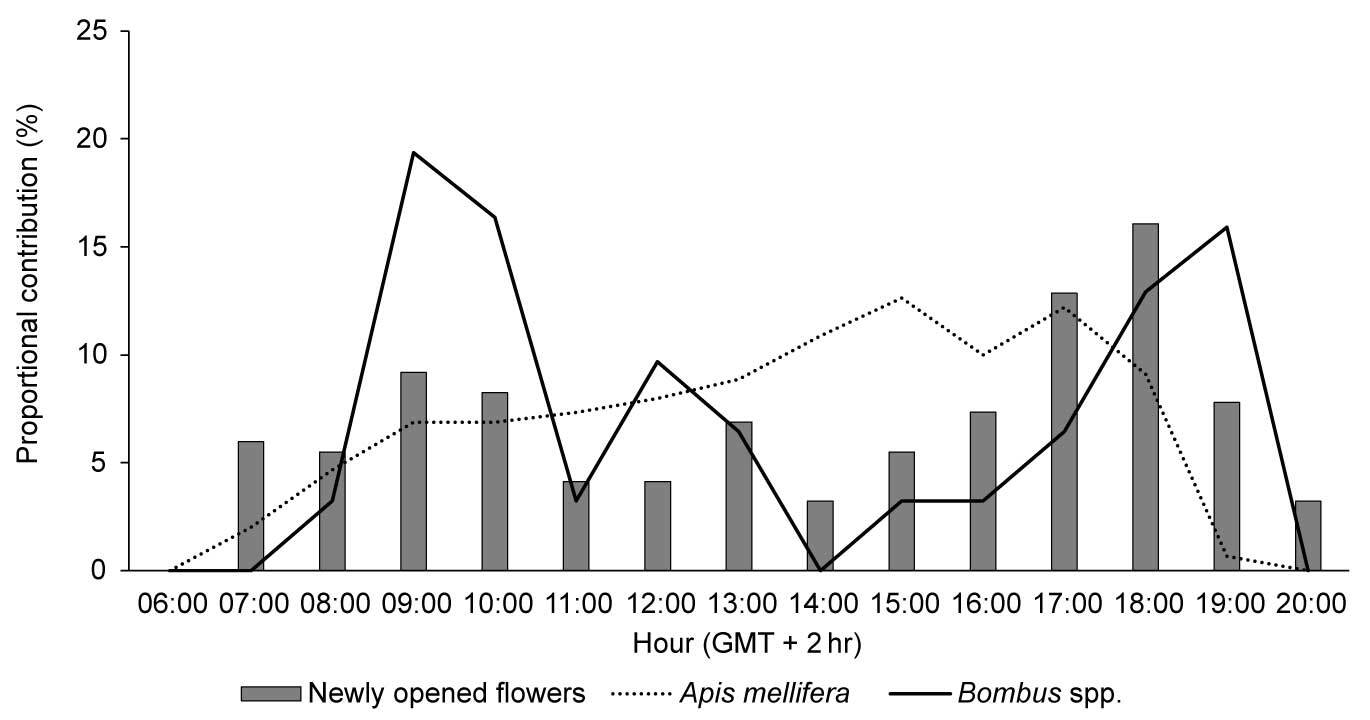
Table 2
Flower abundance in six Vaccinium corymbosum varieties in 2002–2005 in Niemce, SE Poland.
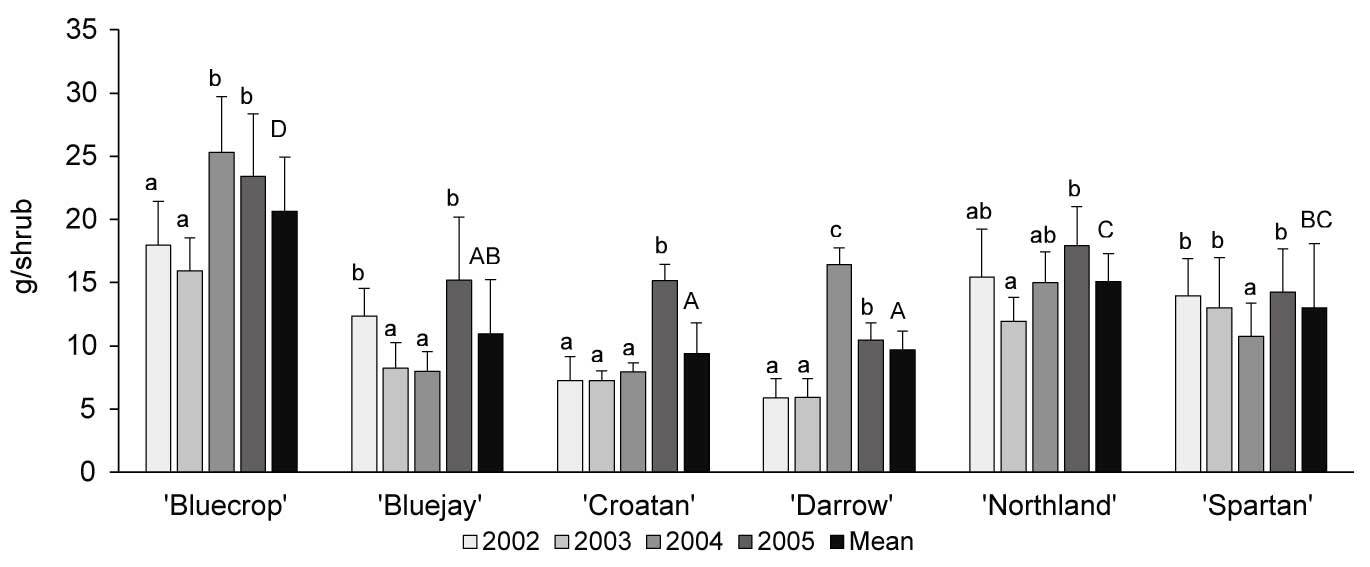
As demonstrated for ‘Bluecrop’ (Figure 2), nectar mass, sugar concentration, and nectar sugar mass increased throughout flower development and peaked between the sixth and ninth day of the flowers’ life-span. Similar patterns were also observed in the other varieties. The mass of produced nectar differed significantly between years (F3, 284 = 20.464; p < 0.001; highest values recorded in 2005) and varieties (F5, 282 = 31.87; p = 0.002; Table 3). The highest per-flower nectar production occurred in ‘Bluecrop’ and ‘Darrow’ (19.08 ± 7.09 mg and 16.60 ± 8.31 mg nectar per flower, respectively). Nectar sugar concentrations differed significantly between years (F3, 284 = 24.283; p = 0.004) and varieties (F5, 282 = 4.351; p < 0.001). Nectar sugar mass was affected by year (F3, 284 = 6.781; p = 0.002) and variety (F5, 282 = 28.767; p < 0.001). ‘Bluecrop’ and ‘Darrow’ produced the largest sugar mass per flower (6.39 ± 1.52 mg and 5.76 ± 1.51 mg sugar per flower, respectively). Sugar yield per shrub differed significantly between years (F3, 354 = 5.546; p = 0.001) and varieties (F5, 354 = 22.913; p < 0.001), and the estimated sugar yield ranged between 9.4 ± 3.3 g and 20.7 ± 3.8 g sugar per shrub, with the highest yield recorded in ‘Bluecrop’ (Figure 3).
Figure 2
Effect of flower age on nectar mass per flower, nectar sugar concentration, and nectar sugar mass per flower in Vaccinium corymbosum ‘Bluecrop.’ Shown are the means ± SD (vertical bars) calculated across the years of the study.
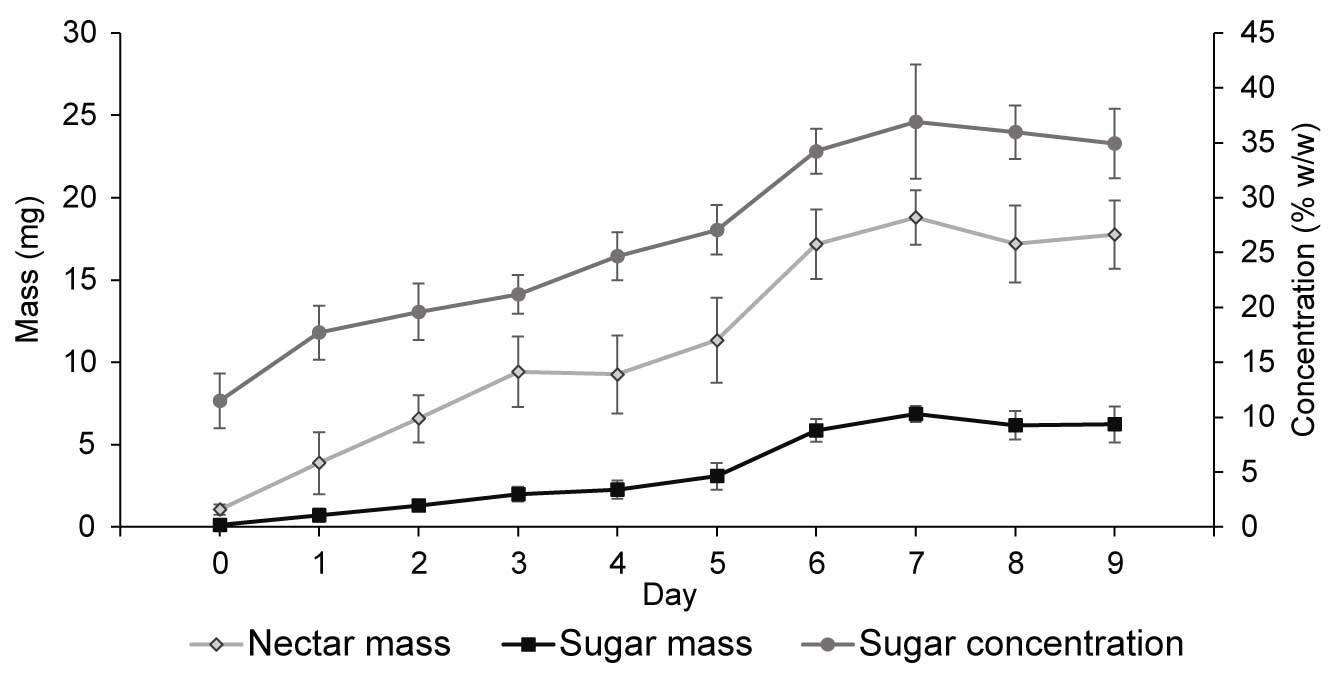
Table 3
Nectar mass, nectar sugar concentration, and nectar sugar mass (at the peak of nectar secretion) in six Vaccinium corymbosum varieties in 2002–2005, Niemce, SE Poland.
Figure 3
Nectar sugar mass per shrub (mean ± SD) in six Vaccinium corymbosum varieties in 2002–2005. Same lower-case letters indicate no significant difference between years, and same capital letters indicate no significant difference between varieties (α = 0.05; Tukey’s HSD test).
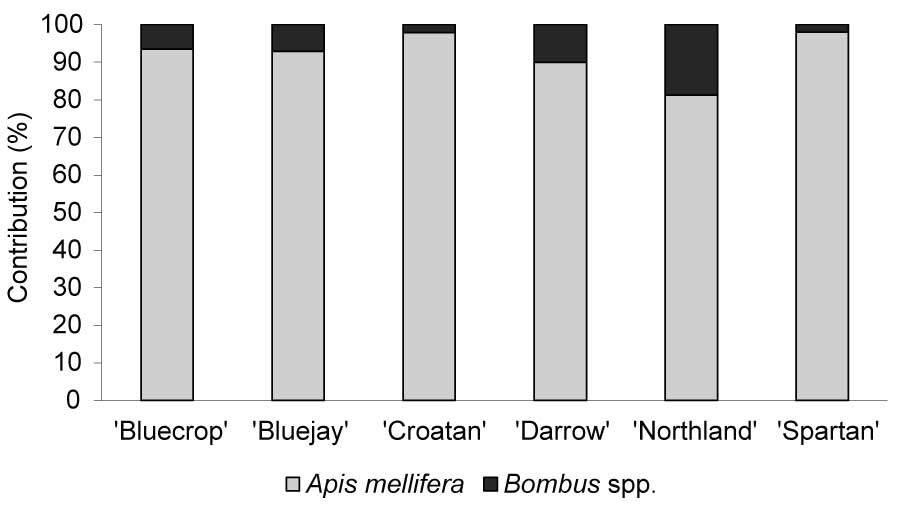
Regarding insect visitors, only honey bees and bumble bees were observed (Figure 4). Depending on the variety, honey bee workers comprised 81%–98% of the total number of insect visitors. Visits of honey bees were distributed evenly throughout the day, while foraging activity of bumble bees peaked in the morning (9 a.m.–10 a.m.) and afternoon hours (6 p.m.–7 p.m.; Figure 1).
. Discussion
Nectar mass, sugar concentration, and sugar mass in flowers of V. corymbosum varied between years of the present study. Variability between years was particularly prominent in ‘Darrow.’ In this variety, the largest difference in nectar mass was approximately threefold (8.41 ± 2.38 mg nectar per flower in 2002 and 25.78 ± 9.53 mg nectar per flower in 2005), and the difference in sugar concentration was approximately twofold between years (53.7% ± 10.5% in 2002 and 26.8% ± 9.8% in 2005). Irrespective of the variety, the highest nectar mass was recorded in 2005, when precipitation exceeded the long-term norm by 60%. Nectar production depends strongly on a range of abiotic factors such as precipitation, air temperature, air humidity, light availability, and CO2 concentration, and significant interannual variation in nectar and sugar quantity were reported by numerous studies (Denisow et al., 2014; Enkegaard et al., 2016; Jachuła et al., 2019; Jachuła, Konarska, & Denisow, 2018). Nectar characteristics also differed between varieties, e.g., nectar mass per flower was more than twofold higher in ‘Bluecrop’ than in ‘Darrow.’ Differences in nectar production between varieties is a known phenomenon which suggests the importance of genetic factors regarding nectar secretion (Bertazzini & Forlani, 2016; Bożek & Wieniarska, 2006; Masierowska & Piętka, 2014).
The studied V. corymbosum varieties produced considerable numbers of flowers, which, together with high per-flower sugar mass, resulted in high sugar yield per shrub, ranging from 9.4 to 20.7 g (‘Bluecrop’ and ‘Darrow,’ respectively). Thus, approximately 47.0–103.5 kg nectar sugars can be expected from 1 ha highbush blueberry crop. In the current study, the estimated sugar productivity of ‘Bluecrop’ and ‘Darrow’ was two- to threefold higher than that estimated by Jabłoński et al. (1983); however, this previous study assessed sugar mass in young (3–4 years old) shrubs, and the authors emphasized that a considerably higher yield can be expected in older shrubs. High sugar productivity by highbush blueberry places this species among the best sugar-yielding cultivated shrubs in the Polish climate. For comparison, the estimated sugar yield of black currant is 4–7 kg/ha (Jabłoński et al., 1997), and that of raspberry is 39–41 kg/ha (Szklanowska et al., 1989).
In flowers of V. corymbosum, anthers open through pores at the tips (Courcelles et al., 2013), thus pollen can be released through sonication by insects, suggesting the so-called buzz-pollination syndrome (Hoffman et al., 2018). This trait can strongly affect pollinator efficiency (Courcelles et al., 2013), and more than 50 Apoidea genera are known to collect pollen released from anthers by sonication (e.g., Bombus spp., Xylocopa spp., and Andrena spp.); however, this does not occur in Apis mellifera (de Luca & Vallejo-Marín, 2013). Nonbuzzing insects can collect only small amounts of pollen from buzz-pollinated flowers, thus they are considered low-efficiency pollinators (dos Santos et al., 2009; Solís-Montero et al., 2015). According to my observations, honey bees were interested only in nectar. It was shown, however, that even when not collecting pollen from corbiculae, A. mellifera can assume substantial amounts of pollen on its body while foraging for nectar (up to 713 ± 128 pollen tetrads of V. corymbosum) and thereby contribute to pollination (Hoffman et al., 2018). This, in turn, may explain high the fruit set in highbush blueberry when flowers were visited mainly by honey bees (Bożek, 2009). Beside the specific anther structural characteristics, flowers of some V. corymbosum varieties show long, narrow corollas (e.g., ‘Bluecrop’) and seem to be adapted to pollination by insects with long mouthparts. According to Courcelles et al. (2013), over 40% of visits made by honey bees to ‘Bluecrop’ flowers were illegitimate, i.e., the bees sucked nectar by inserting their proboscis between the flower corolla and the inferior ovary (thereby avoiding touching the anthers); the authors also observed that A. mellifera, when foraging legitimately, inserted not only the proboscis but also pushed their head into the flower to reach nectar. I did not notice nectar robbing in any of the studied variety but frequently observed honey bees inserting their whole heads in the corolla.
In the USA, which is where highbush blueberry occurs naturally, the most frequent flower foragers were Andrena spp., Bombus spp., and Xylocopa virginica (MacKenzie & Eickwort, 1996; Scott et al., 2016). A previous study on nectar production and pollination in V. corymbosum in the Polish climate showed that flowers are visited mainly by honey bees and occasionally by bumble bees, Andrena spp., and Megachile spp. (Jabłoński et al., 1983). In the present study, only honey bees (>80% of insect visitors) and bumble bees were observed to forage on V. corymbosum flowers. The low abundance of bumble bees and lack of other wild pollinators of highbush blueberry may result from competition with honey bees. Increasing evidence suggests that high abundances of honey bees can reduce population sizes of wild pollinators (Geldmann & González-Varo, 2018; Jachuła et al., 2020; Lindström et al., 2016; Thomson, 2016).
In conclusion, V. corymbosum is an important food crop in agricultural areas. This species flowers abundantly and produces large amounts of nectar sugars. Highbush blueberry can add to spring and late spring sugar resources, which is especially important for honey bees.
