. Introduction
Rice (Oryza sativa L.) is the most widely consumed staple food crop worldwide. Drought is one of the most important abiotic factors that limits rice production in rainfed regions (Samal et al., 2018). Drought is defined as a period of low average precipitation/low rainfall or increased evaporation rates, ultimately reducing crop growth and yield. Drought intensity varies depending on rainfall, evaporation, and soil moisture (Oladosu et al., 2019; Rollins et al., 2013). Because leaf morphology is important in plant architecture and affects crop productivity, leaf symptoms in response to drought constitute a critical aspect of the anatomical adaptation of cultivars, and this information can be used for cultivar selection (Salsinha et al., 2021; Taratima et al., 2021). Leaf morphology and physiology affect light interception, carbon fixation, photosynthesis, transpiration, and water storage. Leaf rolling is a technique used by plants to protect themselves against photodamage (Kadioglu et al., 2012; Nar et al., 2009). Rice benefits from appropriate leaf rolling and an optimal leaf angle for both erectness and light interception (Yuan et al., 2015). The efficiency of photosynthetic activity per unit leaf area can be modified by changing the morphological variability of leaf folding (Xu et al., 2018). By minimizing the absorption of solar radiation by the leaves, optimal leaf rolling can improve the accumulation of dry matter and reduce transpiration (Kadioglu & Terzi, 2007; Sirault et al., 2015).
Leaf rolling is mainly caused by bulliform cells, which have low water potential and reduced turgidity. Water use efficiency can be improved when only a part of a leaf is rolled rather than completely flattened or curved on both sides (Kadioglu & Terzi, 2007; Matschi et al., 2020). Leaf morphological characteristics can serve as visible markers of plant vulnerability and tolerance to drought (Kadam et al., 2015). According to the findings of Cal et al. (2019), rice plant morphoanatomical features, such as lamina thickness and turgidity of epidermal cells, are the primary determinants of leaf rolling in response to drought stress. It has been shown that sclerenchyma cells, bulliform cells, and the interveinal distance between two small vascular bundles in the lamina region differ across genotypes.
Rice production is vital for local farmers’ income and food security in northeastern Thailand. This region contributes to nearly 60% of the country’s cultivated land and is vital for rice cultivation. The region has low and inconsistent rainfall, nutrient-deficient soils with little moisture retention capacity, and limited surface water, all of which contribute to problems associated with wet rice cultivation (Somnasang & Moreno-Black, 2000). Moreover, climate change has necessitated the development of more drought-resistant crop plant varieties and techniques of cultivation (Chaves, 2004). Thus, it is crucial to gain a solid understanding of the mechanisms underlying drought tolerance and efficient water use in plants. Although rice can thrive under various environmental conditions, drought is one of the most important environmental challenges to which this plant species must adapt (Singh et al., 2011).
Modern molecular plant breeding relies increasingly on machine-learning techniques, which collectively refer to computer tools used to discover predictive patterns among data to better understand the impacts of genotypic variation and the environment on plant growth and physiology (van Dijk et al., 2021). Machine learning has also been applied to genomic selection in plant breeding (Crossa et al., 2017; Libbrecht & Noble, 2015), plant phenomics (Perez-Sanz et al., 2017), identification of tree species based on leaf shape (Kumar et al., 2012), and plant identification (Almeida et al., 2020). Among the most widely used machine-learning techniques, decision trees are typically used to classify data automatically. In the formal sense, a decision tree involves a sequence of attribute–value tests resembling biological elements. We used decision trees to define degrees of leaf rolling based on a series of rice leaf anatomical features that changed under drought conditions. We hypothesized that various cultivars display different leaf anatomical features in response to drought. It is reasonable to expect that the current research will reveal the anatomical and structural adaptations underlying leaf adaptations that improve the drought resistance of cultivars native to northeastern Thailand.
. Material and Methods
. Experimental Site and Plant Material
This research was conducted in January 2021 at the Greenhouse of the Integrative Science Research Center, Faculty of Science, Nakhon Phanom University, Thailand (17°23′42.12″ N, 104°45′4.93″ E), where the daily relative humidity ranged from approximately 43 to 90%, and the temperature was between 16 °C and 33 °C. Thirty rice cultivars were grown, as shown in Table 1. Seeds of all 30 rice cultivars were sterilized with 1% sodium hypochlorite, shaken for 5 min, and washed three times with distilled water. The rice seeds were soaked overnight in water then incubated in Petri dishes lined with tissue paper soaked in water until the seeds germinated. The germinated seeds were then transplanted into seedling trays filled with vermiculite, with one seed per well, which served as a well-watered (control) planting material. When the rice seedlings were four days old, standard Yoshida nutrient solution with a pH ranging from 5 to 5.5 (Yoshida et al., 1976) was used instead of water, and the solution was changed every four days. The seedlings were cultivated in a nutrient solution until the rice plants were three weeks old. This study used a completely randomized design with three replicates. The seedlings were divided into two groups: (1) a control group (Yoshida nutrient solution group) and (2) a drought-stress group (Yoshida nutrient solution supplemented with 20% polyethylene glycol (PEG)6000). Samples were then collected from the third leaf (from the first) with a whole leaf plate to determine and score the leaf rolling index; the degree of leaf rolling was divided into values of 1–7 according to the methods of Amal et al. (2020). The index values were as follows: 0, no leaf rolling; 1–3, low degree of leaf rolling; 4–5, moderate degree of leaf rolling; 6–7, high degree of leaf rolling. The assessments were repeated thrice.
Table 1
Descriptions of rice cultivars from northern Thailand used in this study.
. Leaf Anatomy Evaluations
The anatomy of native rice leaves was studied using freehand sectioning and paraffin methods. For the paraffin technique, samples were sectioned to a thickness of 7 µm using an RM2125 RTS rotary microtome (Leica Biosystems, Germany) and stained with safranin and fast green according to the methods of Johansen (1940). The anatomy of the leaves was evaluated for each cultivar under a light microscope (Axio Imager 2; Carl Zeiss AG, Germany). The bulliform cell area on the adaxial portion of the leaves, vascular bundle area, bundle sheath area, upper and lower epidermal layer thickness, and leaf thickness were measured three times for each leaf, and three leaves (replicates) were analyzed via Zen 3.5 software (Carl Zeiss AG, Germany).
. Statistical Analysis and Data Mining
The means and standard deviations of the descriptive data were calculated using SPSS version 17.0 (SPSS Inc., USA). The differences in the means between the drought stress and control conditions were analyzed using t-tests, while the differences between cultivars in the same treatment were compared using Duncan’s multiple range test (DMRT). Pearson’s correlation analysis was used to determine the relationships between leaf anatomical parameters and leaf rolling indices. Data mining was conducted using the decision tree technique in Rapid Miner Studio version 9.10. (Mierswa et al., 2006). Bulliform cells, upper and lower epidermis, bundle sheath cells, vascular bundles, and leaf thickness were considered predictor attributes, while leaf rolling categories were considered target attributes, as shown in Table 2. Using a 60–40 split, we created a training set and testing set from the data. This approach was applied to 10 sections to construct models, which were then tested for accuracy, classification error, and kappa index via the cross-validation method. The three primary criteria used in this research to assess the quality of a split in a decision tree are information gain (Yang & Liu, 1999), gain ratio (Quinlan, 1986), and Gini index (Breiman et al., 2017).
Table 2
Descriptions of leaf anatomy predictive attributes and goal attributes used in the database for decision tree induction to predict the degree of leaf rolling.
. Results
. Leaf Rolling Index
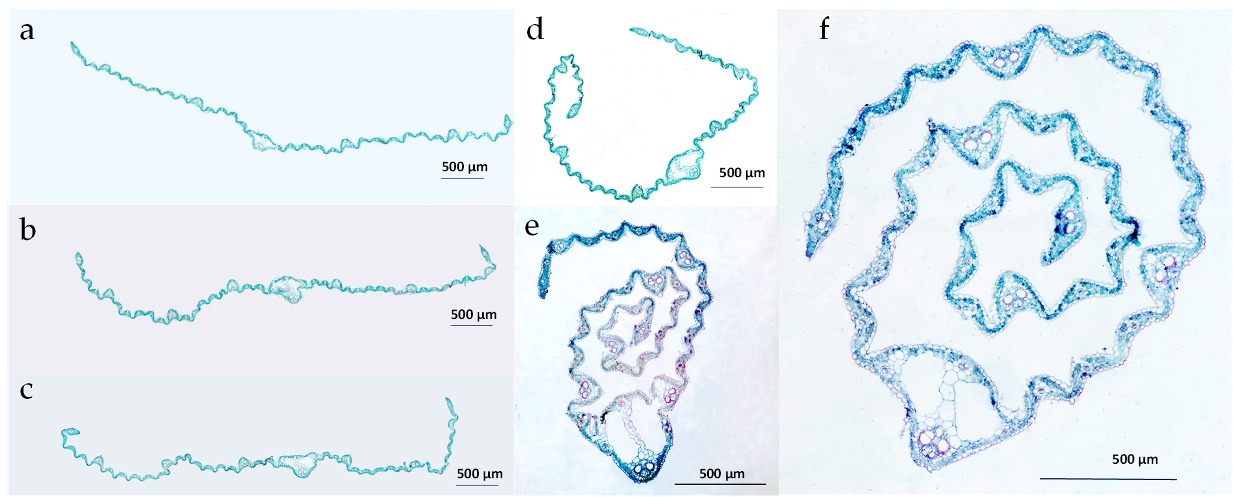
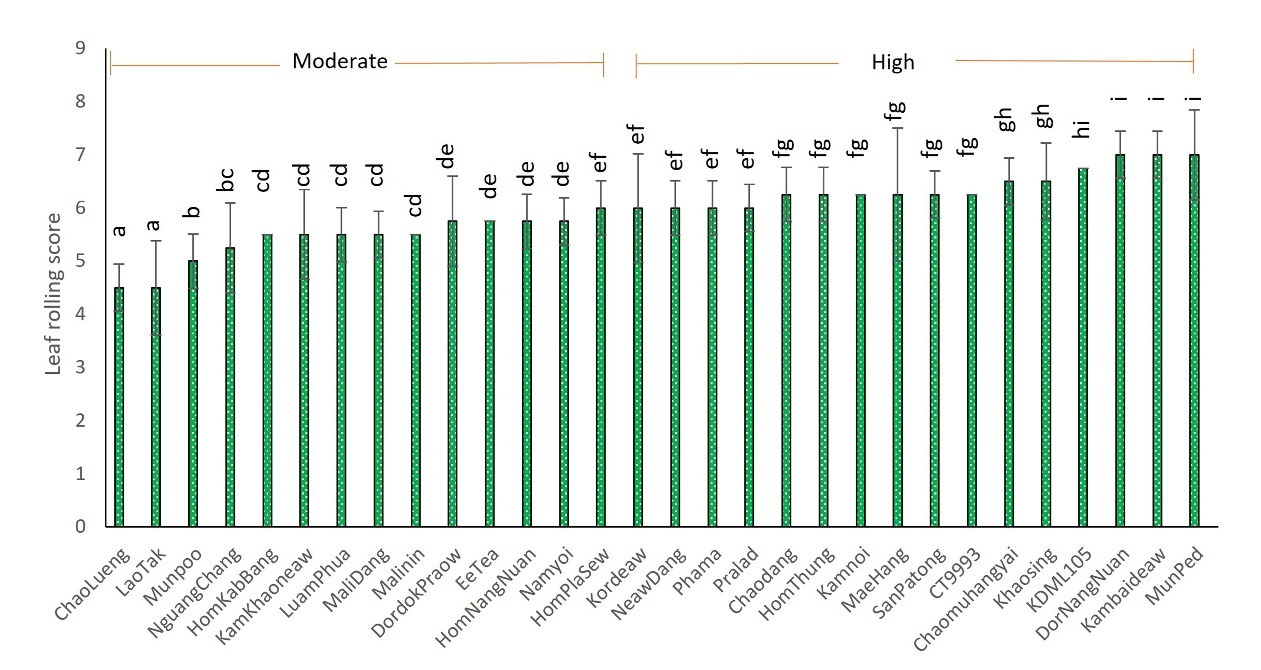
The leaves of all 30 rice cultivars rolled upward. However, the degree to which the leaves rolled varied across cultivars. Two groups emerged when the leaf rolling index was assessed (Figure 1). The leaves of cultivars in the first group were moderately rolled (values between 4 and 5). This group comprised 14 cultivars: ChaoLuang, LaoTak, Munpoo, NguangChang, HomKabBang, KamKhaoneaw, LuamPhua, MaliDang, MaliNin, DorDokPraow, EaTea, HomNangNuan, NamYoi, and HomPlaSiew. The other group comprised cultivars with a high degree of leaf roll (values between 6 and 7): KorDeaw, NeawDang, Phama, Pralad, ChaoDaeng, HomThung, Kamnoi, MaeHang, SanPaTong, CT9993 (a drought-tolerant cultivar), ChaoMuHangYai, KhaoSing, KDML105 (a commercial cultivar), DorNangNuan, Kambaideaw, and ManPed, as shown in Figure 2.
Figure 1
Cross-sections of leaves with the different degrees of leaf rolling, classified on the basis of the value of their leaf rolling index, which ranged from 0 to 7. Leaves that were not rolled to those with a low degree of leaf rolling (a, b, c); leaves with a moderate degree of rolling (d); leaves with a high degree of rolling (e, f).
. Bulliform Cells
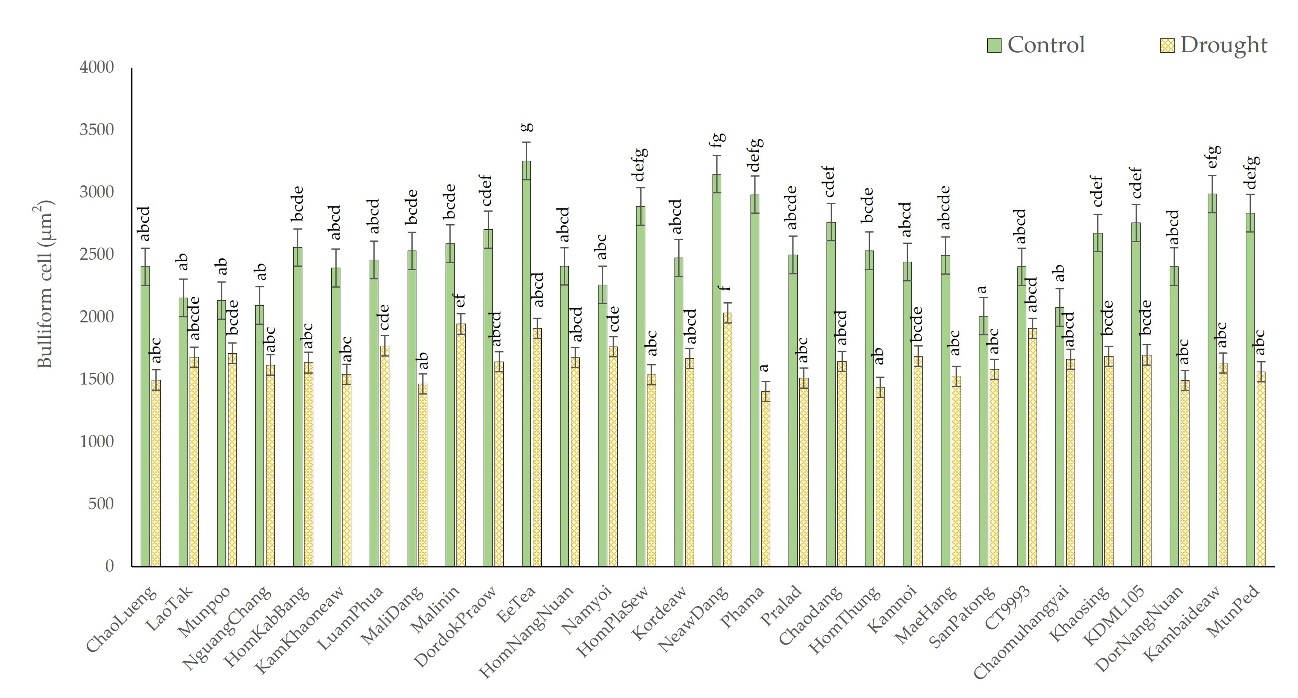
Upward rolling occurs when rice leaves are exposed to drought stress. This upward rolling is caused by a group of bulliform cells. Bulliform cells constrict as water is lost, as shown in Figure 3b. Bulliform cells in rice leaves vary in size and density, leading to different rolling of the leaves of various cultivars. The cultivars with highly rolled leaves demonstrated a more significant reduction in bulliform cell size than the cultivars with moderately rolled leaves. The average size of the bulliform cells was reduced by 36.8% in the high-leaf rolling group, from 2,611.9 µm2 in the control group to 1,629.7 µm2, while the bulliform cell size was reduced by 30.91% in the moderate-leaf rolling group, from 2,458.9 µm2 to 1,682.6 µm2. Bulliform cell sizes of the Phama, HomPlaSew, and Kambaideaw cultivars decreased the most. Under drought stress conditions, the size of the bulliform cells of Phama rice decreased from 2,984.6 µm2 in the control group to 1,405.3 µm2 (52.91%) in the drought-stress condition group. Moreover, the size of the bulliform cells of HomPlaSew decreased from 2,889.5 µm2 in the control group to 1,540.9 µm2 (46.67%) in the drought-stress condition group, and those of Kambaideaw decreased from 2,988.3 µm2 in the control group to 1,633 µm2 (45.35%) in the drought-stress condition group, the results of which are shown in Figure 4.
Figure 3
Transverse freehand cross-sections of leaves under well-watered conditions, with no leaf rolling (a) and leaf rolling (b). The sections were stained with safranin. Leaf sections obtained via paraffin and stained with safranin and fast green, revealing the midline structure, including bulliform cells (bc), bundle sheaths (bs), vascular bundles (vb), mesophyll cells (mc), and epidermal cells (ep) (c).
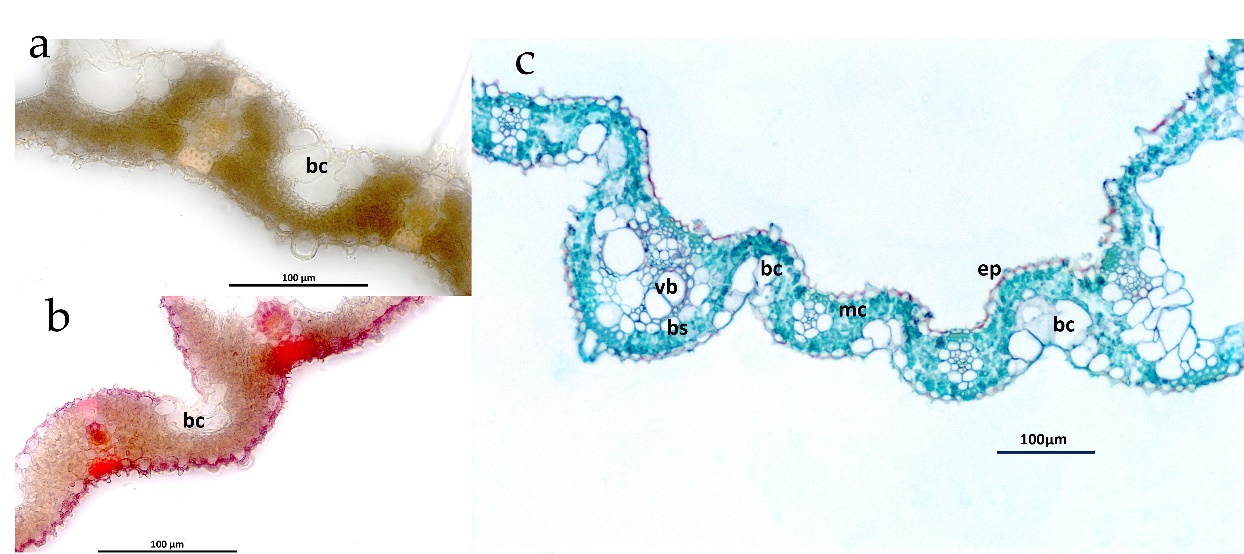
Figure 4
Comparison of bulliform cell size via cross-sections between control and drought-stressed groups comprising 28 native rice cultivars and two additional comparative rice cultivars. The means with different letters indicate significant differences between cultivars under the control and drought-stress conditions according to DMRT (p < 0.05).
. Epidermis
Epidermal tissue width increased in the upper and lower layers of the drought-stressed leaves. Rice cultivars with a high degree of leaf rolling had a thicker epidermis than those with a moderate degree of leaf rolling. Under control conditions, the leaves with a moderate degree of rolling presented an upper epidermis width of 12.3 µm, which increased to 13.5 µm (9.5%) under drought-stress conditions. However, the leaves with a high degree of rolling had a thicker upper epidermis, which increased from 12.7 µm to 14.0 µm (10.98%). The cultivars NeawDang, DorNangNuan, and Kamnoi had the greatest degree of leaf upper epidermal thickening. Drought increased the upper epidermis thickness in ChaoDaeng from 12.29 µm to 15.57 µm (26.68%); DorNangNuan, from 12.10 µm to 15.21 µm (25.74%); and Kamnoi, from 12.29 µm to 15.57 µm (25.03%), as shown in Figure 5a.
Figure 5
Comparison of the sizes of the upper and lower epidermis from cross-sections of leaves of 28 native rice cultivars and two additional comparative rice cultivars under control and drought-stress conditions. The means with different letters indicate significant differences between cultivars under the control and drought-stress conditions according to DMRT (p < 0.05).
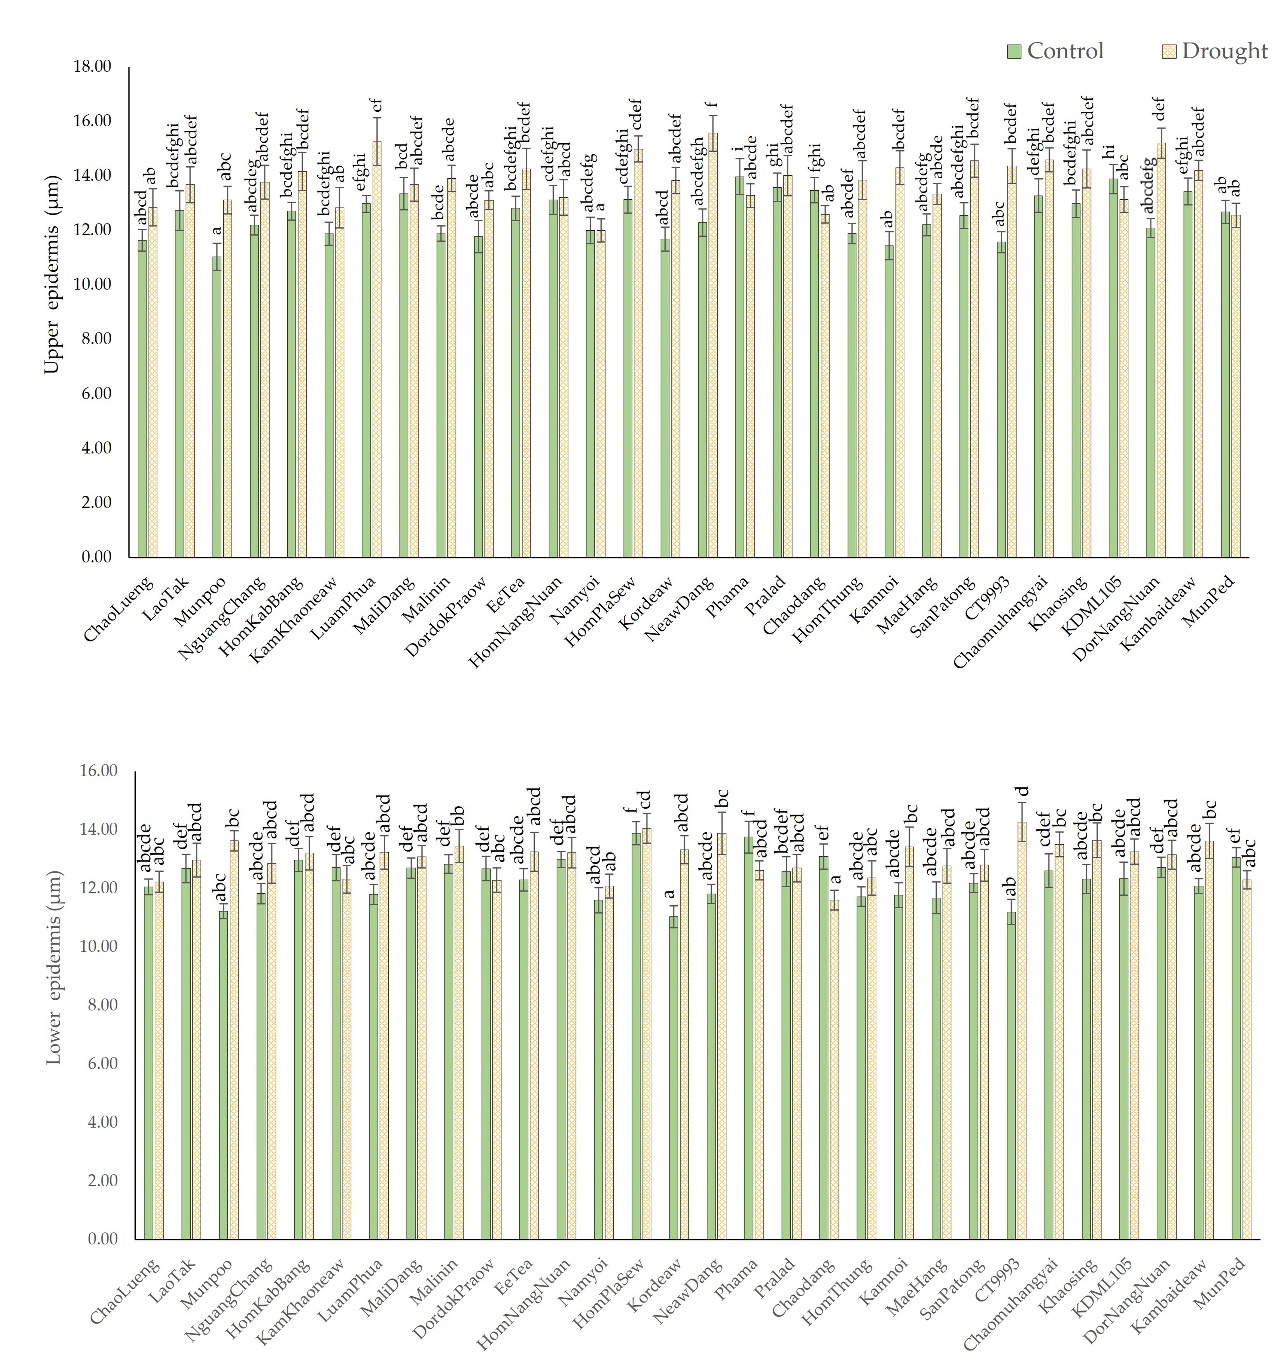
Compared to the upper epidermis, the lower epidermis exhibited the same epidermal cell size expansion pattern, but a smaller area of the lower epidermis was affected. According to Figure 5b, the width of the lower epidermis increased by 4.85% in the leaves of the moderate-leaf rolling group and by 6.92% in the leaves of the high–leaf rolling group. Among the cultivars studied, CT9993, Munpoo, and Kordeaw exhibited the greatest epidermal expansion under drought-stress conditions; their values increased from 11.19 µm to 14.27 µm (27.46%), 11.23 µm to 13.63 µm (21.38%), and 11.04 µm to 13.31 µm (20.70%), respectively.
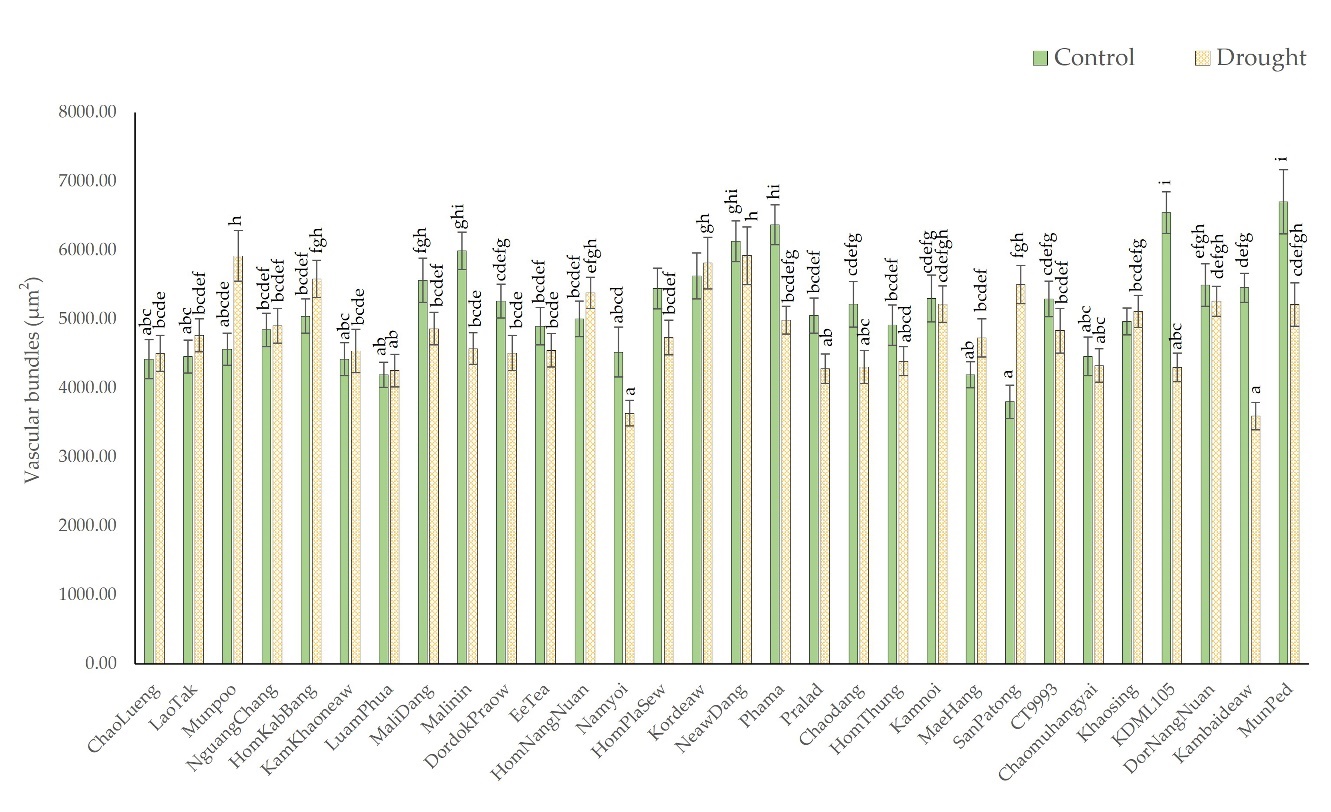
. Vascular Bundles
Figure 6 shows that the rice leaves subjected to drought had smaller vascular bundles than those of the rice leaves under well-watered conditions. The decrease was most apparent in the cultivars in the high-leaf rolling group. Under drought conditions, the average vascular bundle area of the cultivars with moderately rolled leaves decreased from 4,863.6 µm2 to 4,770.1 µm2 (4.71%). In comparison, the vascular bundle size of high-leaf rolling cultivars decreased from 5,353.9 µm2 to 4,856.9 µm2 (7.41%). The area of the leaf vascular bundles decreased the most in the Kambaideaw, KDML105, and Malinin cultivars. The vascular bundle area in Kambaideaw decreased from 5,459.2 µm2 under the control conditions to 3,596 µm2 (34.13%) under the drought-stress conditions. The area in KDML105 was reduced from 6,546.6 µm2 under the control conditions to 4,302.28 µm2 (34.28%) under the drought-stress conditions, and that of Malinin decreased from 5,994.5 µm2 under the control conditions to 4,576.5 µm2 the under drought-stress conditions (23.7%), the results of which are shown in Figure 6.
Figure 6
Comparison of the sizes of vascular bundles from cross-sections of leaves of 28 native rice cultivars and two additional comparative rice cultivars under control and drought-stress conditions. The means with different letters indicate significant differences between cultivars under control and drought-stress conditions according to DMRT (p < 0.05).
. Bundle Sheath Cells
As rice is a C3 plant species, the bundle sheath cells, or the layer of cells that surrounds the vascular bundle in rice leaves, appear transparent (they contain no chlorophyll) and are organized in a circle around the vascular bundle. Drought-induced shrinkage of bundle-sheath cells has been reported in previous studies. As shown in Figure 7, changes in the size of the vascular bundles were more apparent in the leaves with a high degree of rolling than in those with a moderate degree of rolling. The bundle sheath size decreased by 11.95%, from 1,277.2 µm2 under control conditions to 1,082 µm2 under drought stress conditions. However, in the moderate-leaf rolling group, the mean bundle sheath size was similar between the control conditions and drought-stress conditions, but increased by 7.41% under drought stress conditions, increasing from 1,033 µm2 to 1,087 µm2. When the number of rice cultivars in each group was considered, the results showed that the percentage of the bundle sheet cells of the rice cultivars decreased by only 38.46% in the moderate-leaf rolling group but by 76.47% in the high-leaf rolling group.
Figure 7
Comparison of the bundle sheath size from cross-sections of leaves of 28 native rice cultivars and two additional comparative rice cultivars under control and drought-stress conditions. The means with different letters indicate significant differences between cultivars under control and drought-stress conditions according to DMRT (p < 0.05).
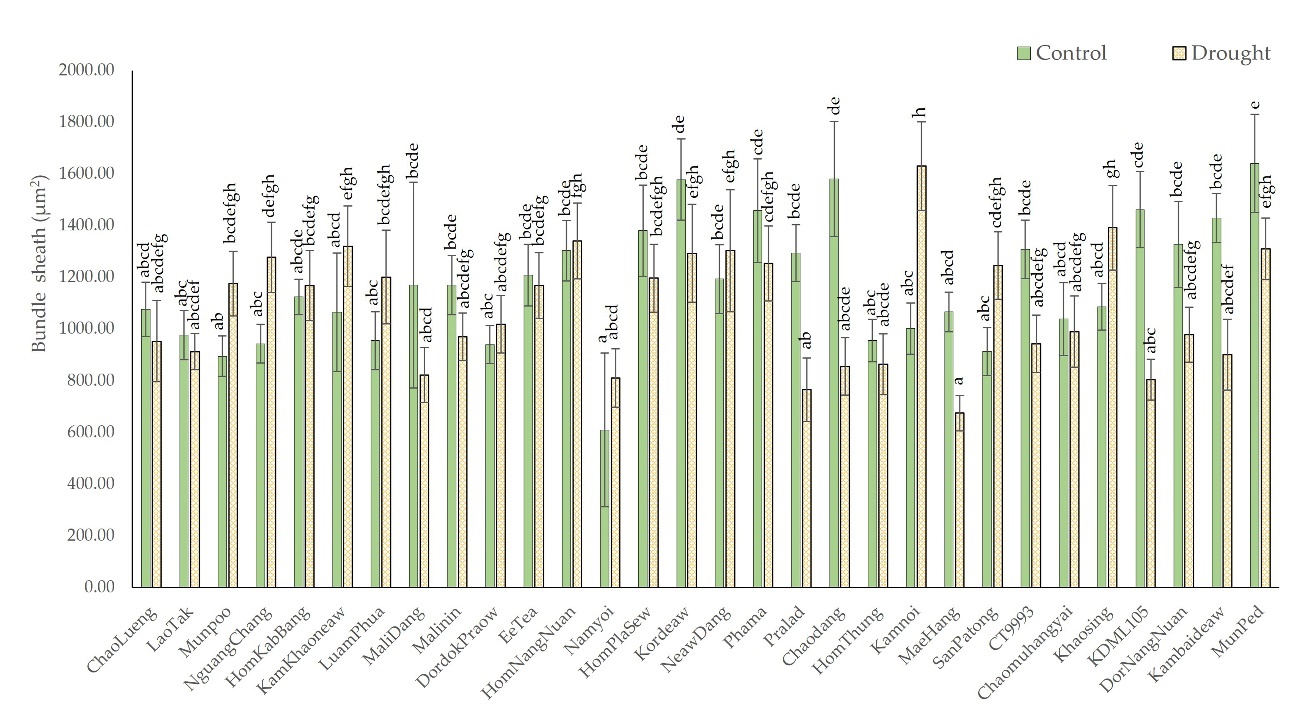
The Chaodang, KDML105, and Pralad cultivars showed the greatest reduction in bundle sheath size. The bundle sheath size of Chaodang decreased from 1,580.67 µm2 under the control conditions to 855.41 µm2 (45.88%) under the drought conditions; KDML, from 1,461.905 to 803.67 µm2 (45.03%); and Pralad, from 1,293.64 µm2 to 765.13 µm2 (40.85%), as shown in Figure 7.
. Leaf Thickness
Members of both the high- and moderate-leaf rolling groups exhibited a decrease in leaf thickness in response to drought, as shown in Figure 8. The leaf thickness decreased by 3.27% and 6.82%, respectively. The leaf thickness of the Phama rice leaf cultivar decreased the most-by 15%; the leaf thickness decreased from 82.15 µm under the control conditions to 69.08 µm under the drought conditions. With the exception of three cultivars, SanPaTong, CT993, and DorNangNuan, the leaf thickness of the cultivars with a high percentage of leaf rolling decreased. There were four cultivars with moderate leaf rolling whose leaf thickness increased, namely Munpoo, NguangChang, HomKabBang, and LuamPhua. The LuamPhua cultivar presented the most significant increase in leaf thickness at 9.04% from 70.02 µm to 76.35 µm.
Figure 8
Comparison of leaf thickness from cross-sections of leaves of 28 native rice cultivars and two additional comparative rice cultivars under control and drought-stress conditions. The means with different letters indicate significant differences between cultivars under control and drought-stress conditions according to DMRT (p < 0.05).
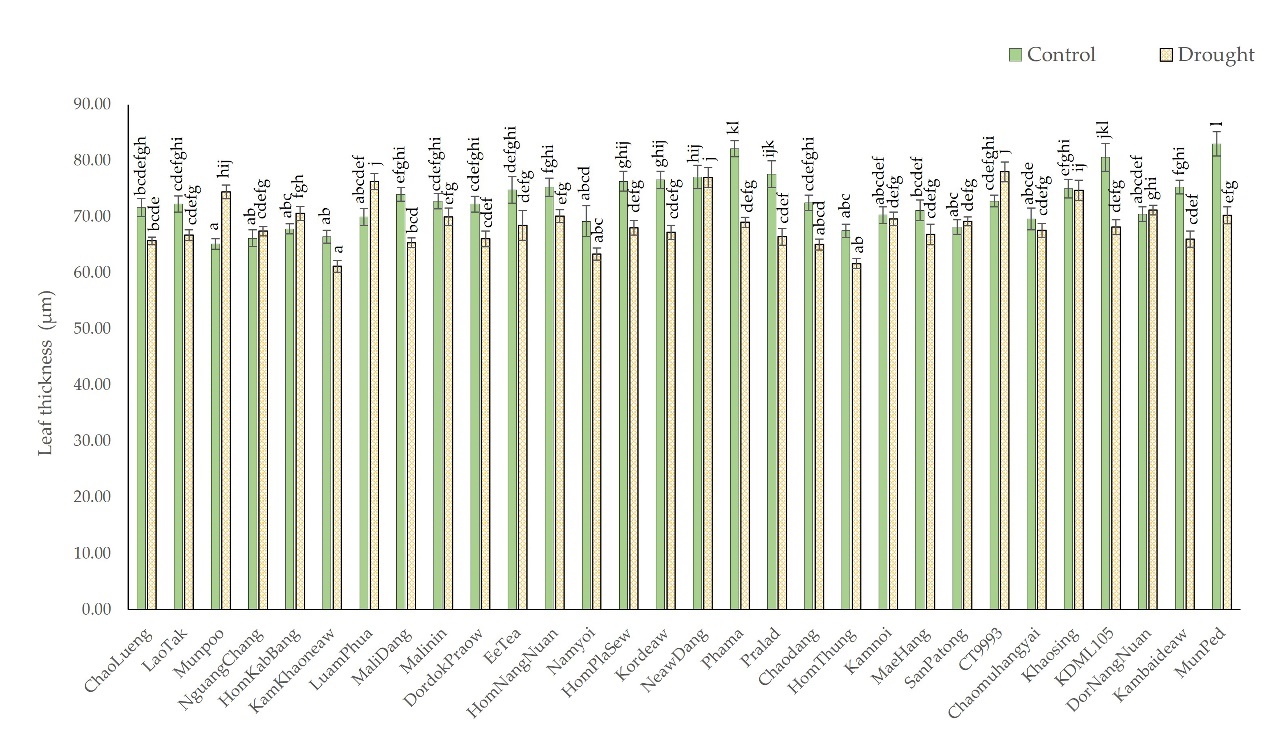
The leaf thickness of the Phama, MunPed, and Kambaideaw cultivars decreased the most. According to the data in Figure 8, drought reduced the leaf thickness of Phama by 15.91%, from 82.15 µm under the control conditions to 69.08 µm under drought-stress conditions; similarly, the leaf thickness of MunPed decreased from 80.03 µm to 70.30 µm (15.33%), and that of Kambaideaw decreased from 75.32 µm to 66.09 µm (12.25%).
. Machine Learning Via the Decision Tree Technique
The decision tree technique is a type of data mining method that differs from conventional statistical data analysis, such as the use of traditional Pearson correlation methods, to determine relationships between parameters. In the present study, we determined that the anatomical features of the leaves and leaf rolling index were uncorrelated variables, as shown in Table 3. However, some leaf anatomical features, including the upper and lower epidermis (r = 0.676), bundle sheaths, and vascular bundles (r = 0.644), were positively correlated with each other.
Table 3
Relationships between anatomical characteristics and leaf rolling index.
To determine the relationship between leaf anatomical features and the degree of leaf rolling, we used the decision tree method to create a schematic model. The model consists of (1) a node representing a branch of information concerning categorization, with the top node known as the root node; (2) branches, which are attributes of branching nodes; and (3) leaves, which represent collections of clustering results. The predicted leaves were divided into two categories: moderate and high rolling. If leaves had a high degree of rolling, we determined the conditions that drove this phenomenon. The data were divided such that 60% were used for model learning, and 40% were used for testing the decision tree model. The model identifies cultivars with a high degree of leaf rolling from the root node to the leaf node.
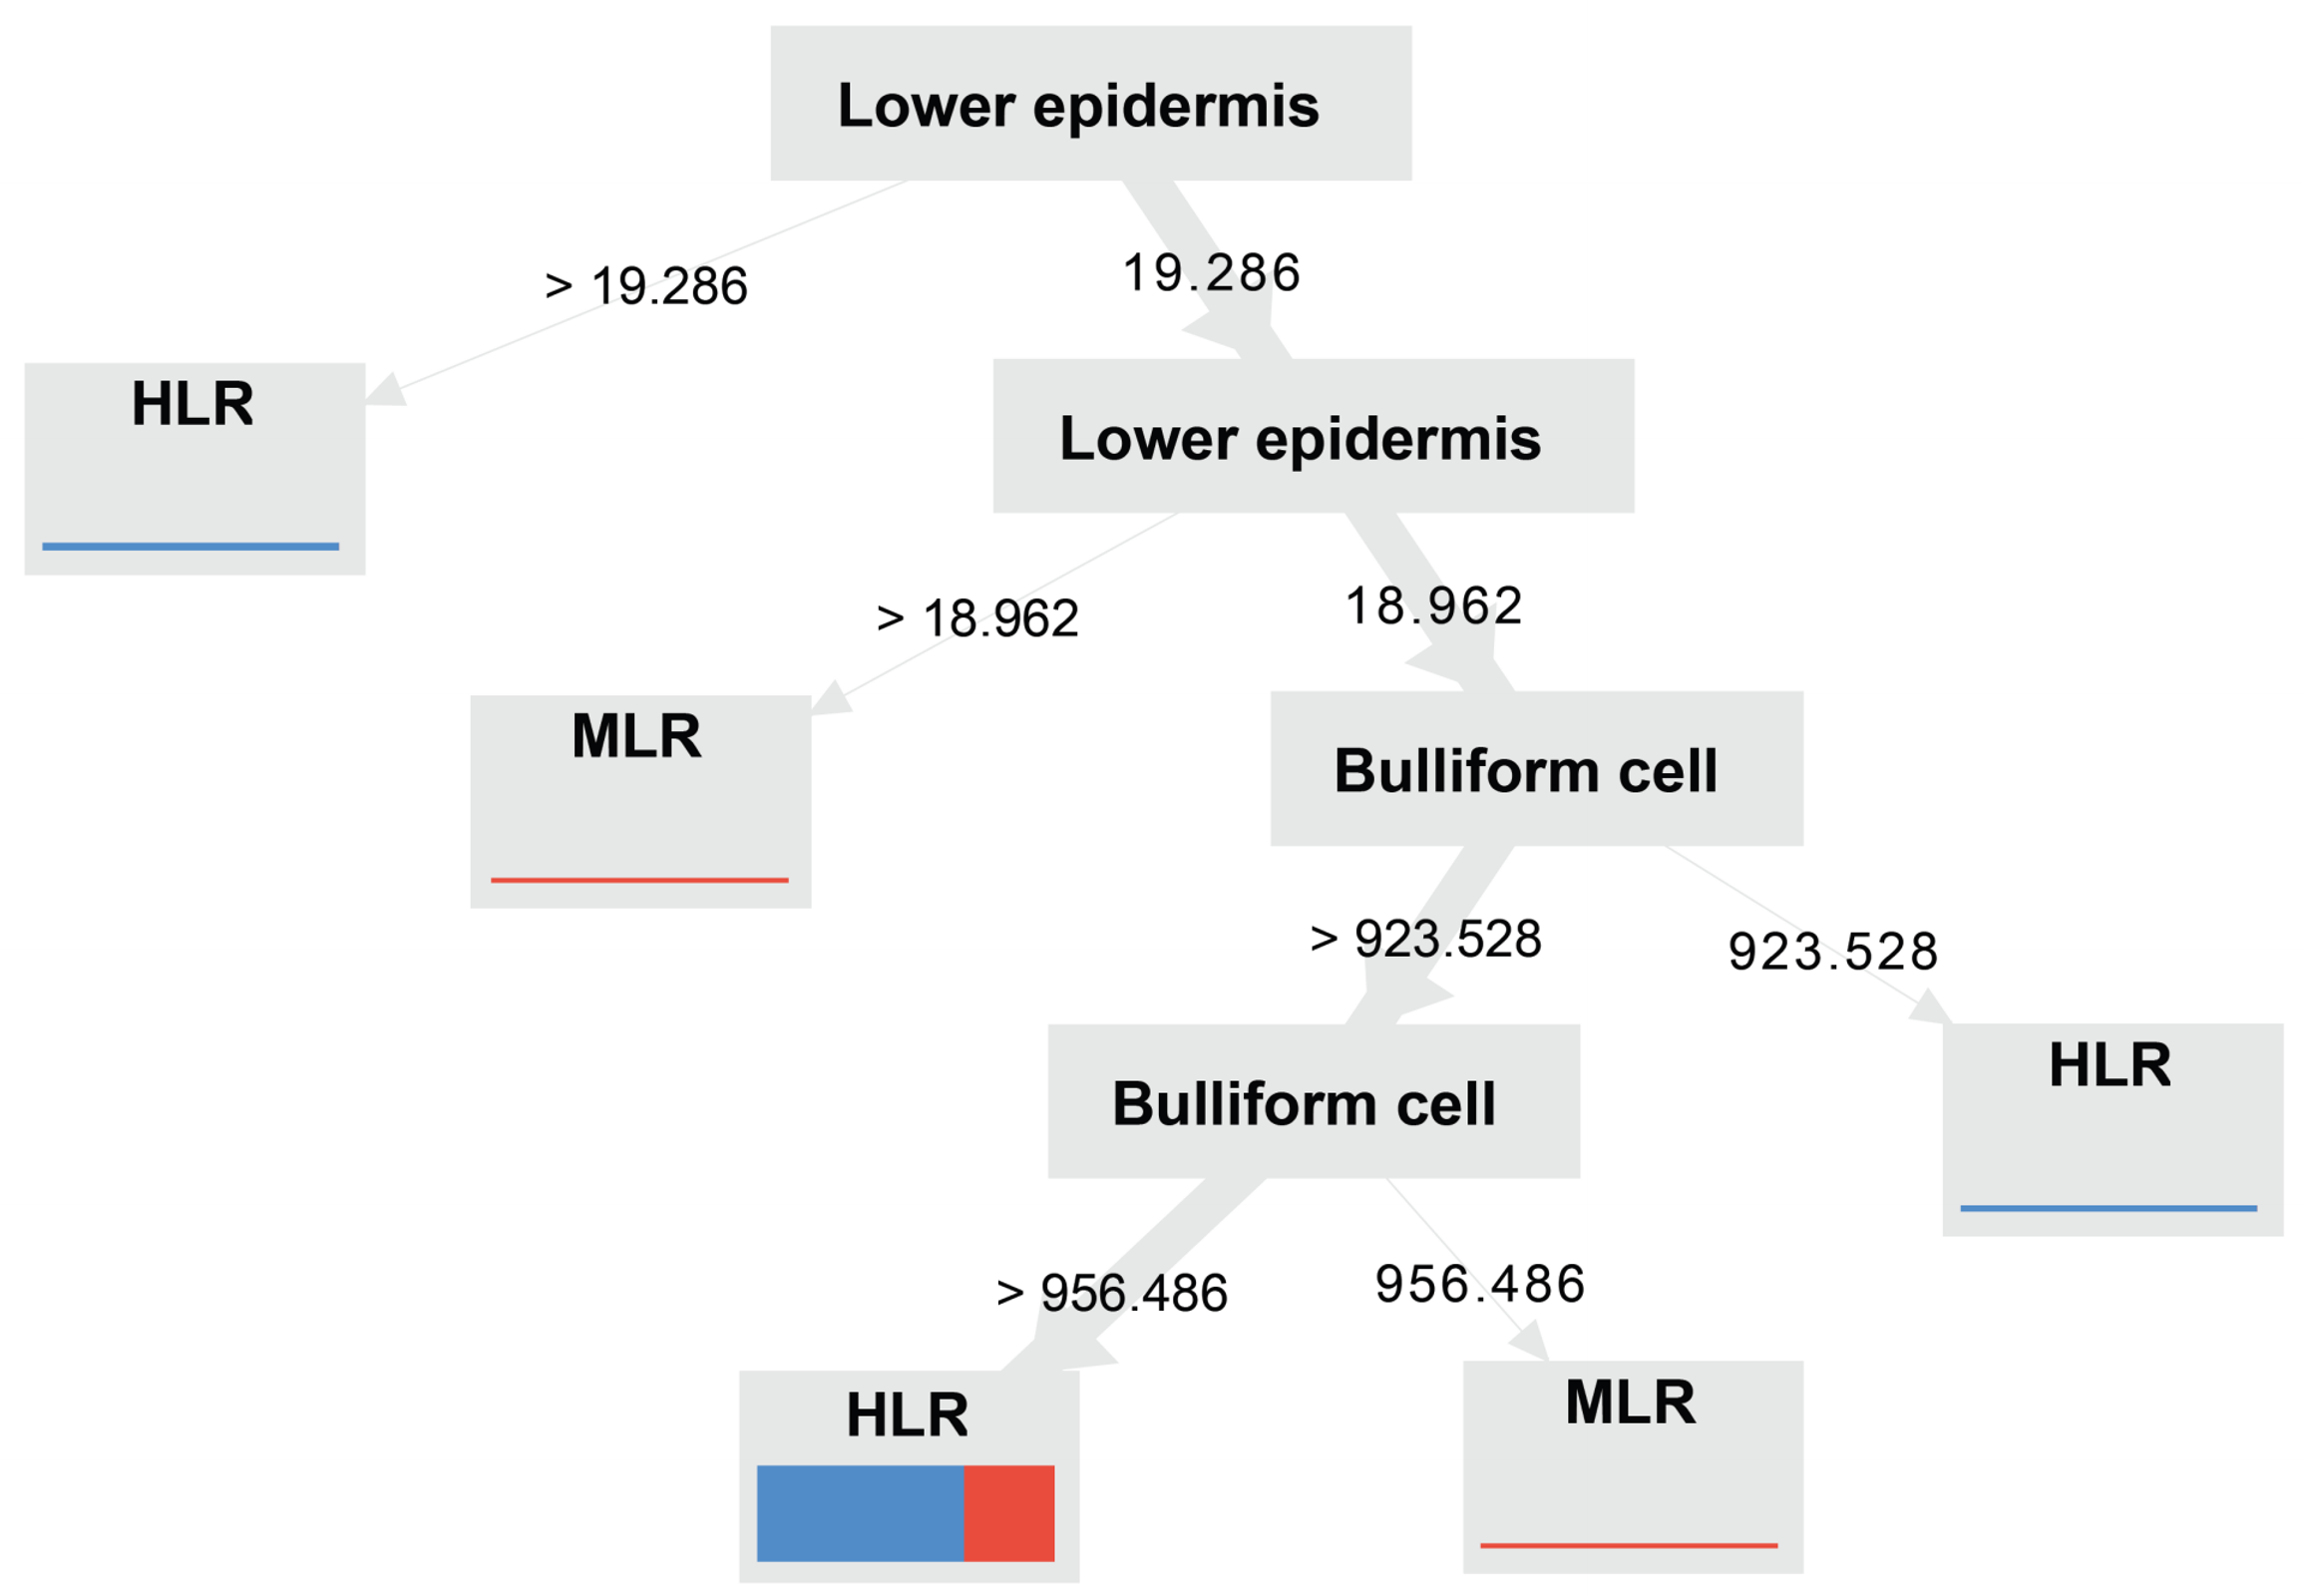
When the gain ratio is used as a decisive criterion, two factors may be used to generate the tree structure of the leaf rolling characteristics, namely, the lower epidermis and bulliform cells, as shown in Figure 9. The lower epidermis separated the two branches of the root node. The group of cultivars with a lower epidermal thickness greater than 19.286 µm displayed the highest leaf rolling. Consequently, the lower epidermis group was divided into two subgroups. The lower epidermis group was further divided into two subgroups. The group with a thickness greater than 18.962 µm exhibited moderate rolling, but if their values were lower than 18.692 µm, they were separated into another branch based on their bulliform cells. The degree of leaf rolling was classified as high if the bulliform cell size was less than 923.528 µm; however, if the size was greater, that group was separated into another branch on the basis of bulliform cell size. If the bulliform cell size exceeded 956.466 µm, leaf rolling was high; however, if the size was smaller than 956.466 µm, moderate leaf rolling would occur.
Figure 9
Decision tree constructed via the splitting algorithm in conjunction with the gain ratio, a moderate degree of leaf rolling (MLR), and a high degree of leaf rolling (HLR).
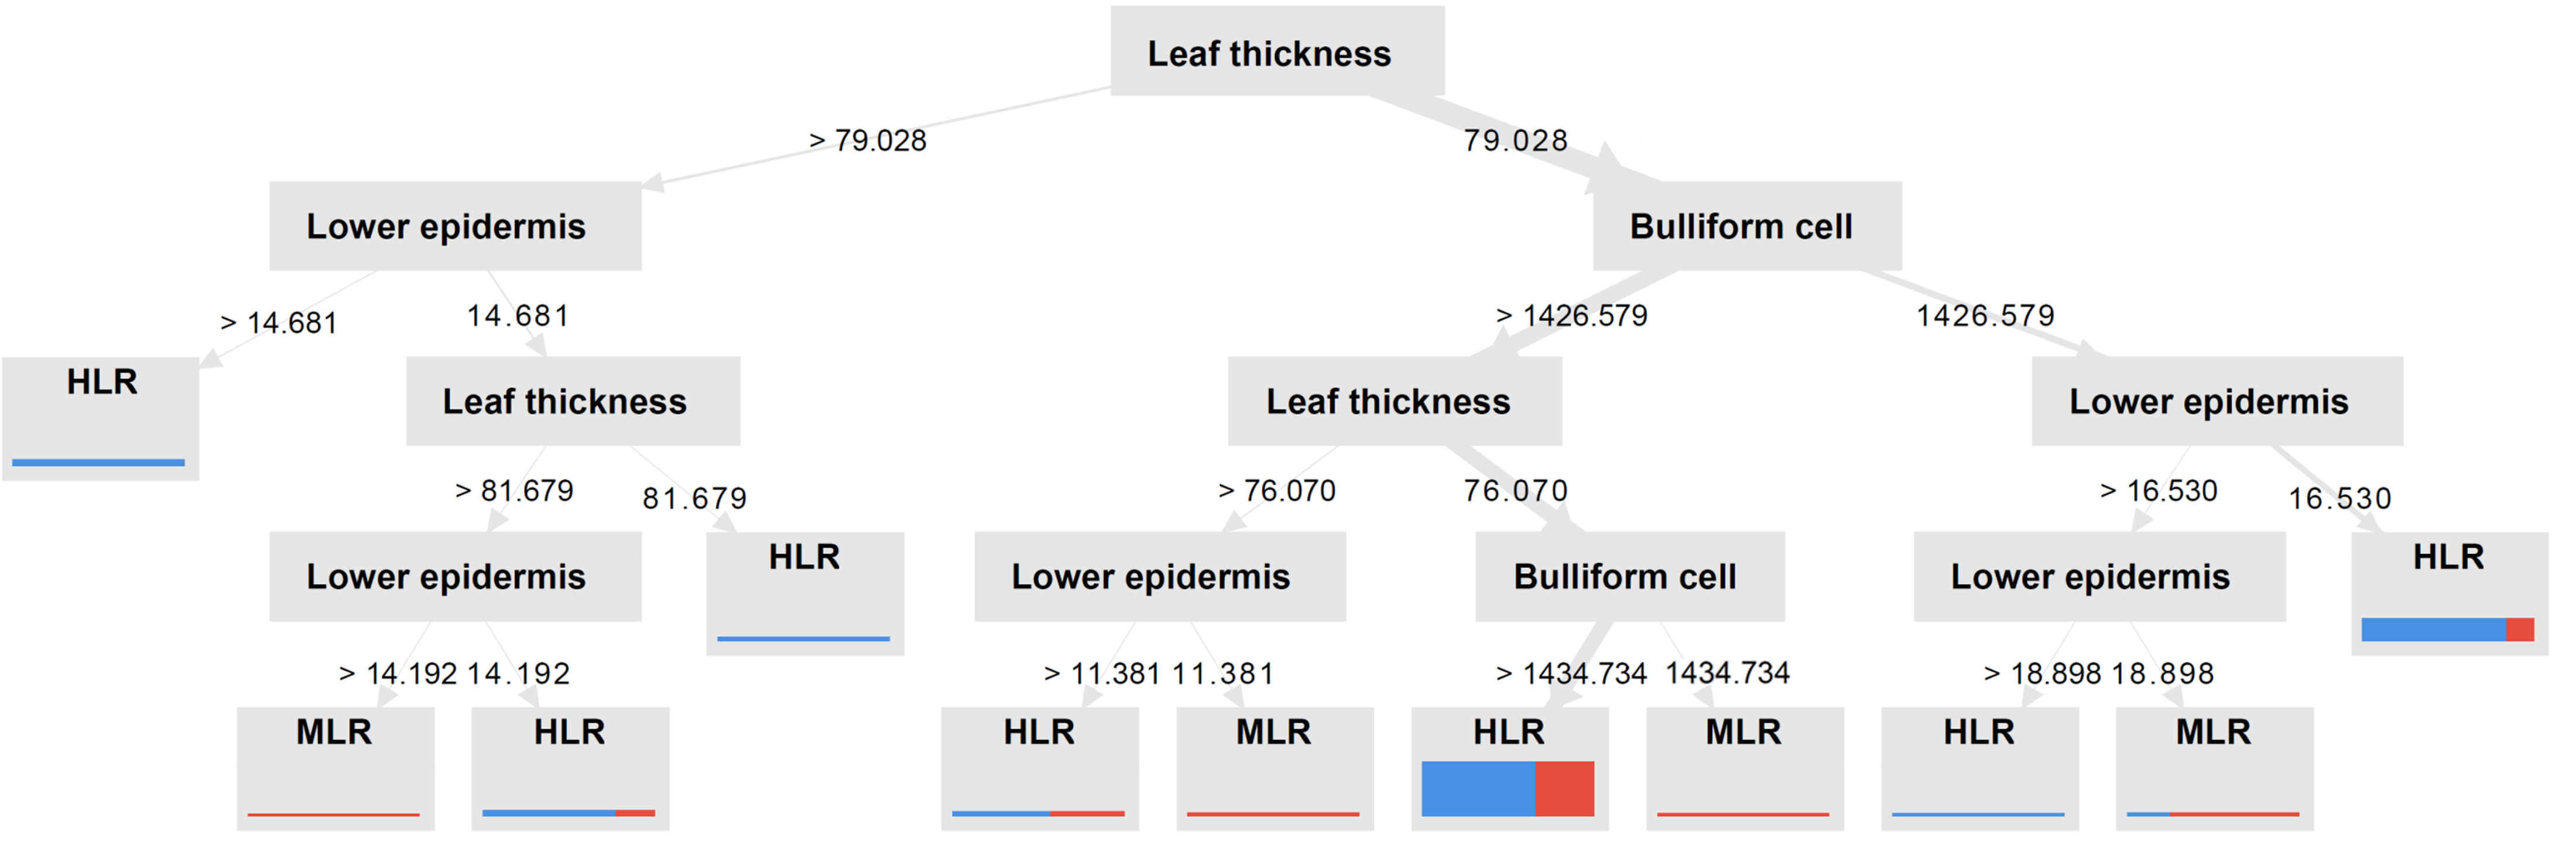
A decision tree was constructed based on the information gain for node splitting, as shown in Figure 10. The tree was created such that leaf thickness was the primary factor of the root node, whereas other node levels were considered in the tree construction. Lower epidermis width and bulliform cell size were two parameters identified to play a role in the decision tree structure. At the root node, leaf thickness divides the tree into two branches. When the leaf thickness was greater than 79.028 µm, the lower epidermis was used to construct new branches. When the lower epidermis thickness exceeded 14.68 µm, the leaf rolled significantly. If the value was lower than this, a new node was constructed based on the leaf thickness. A node with a leaf thickness larger than 81.67 µm used the lower epidermis as the new node; if the value was less than 81.67 µm, it was defined as having a high degree of leaf rolling. If the value at the following lower epidermal node was much greater than 14.19 µm, the leaves were moderately rolled; however, if the value was lower, a high degree of rolling would occur. Node splitting from the root node is based on the presence of bulliform cells. Two additional nodes were created according to leaf and lower epidermis thickness when the bulliform size was greater or less than 1,428.58 µm2. With a bulliform cell area larger than 1,428.58 µm2, if the leaf thickness was greater than 76.07 µm and the lower epidermis thickness was greater than 11.381 µm, there would strong leaf roll; however, if lower, the rolling would be moderate. When the leaf thickness was less than 76.07 µm and the bulliform cells were greater than 1,437.734 µm2, the leaves would display a high degree of leaf rolling; however, there would be moderate leaf rolling if the value was lower. While a bulliform region less than 1,428.58 µm2 led to the creation of the child node, the lower epidermis width was divided into two branches by the following node. If the epidermis was thinner than 16.53 µm, the leaves exhibited a high degree of rolling, but if they were thinner than 18.89 µm, the leaves exhibited moderate rolling. Finally, leaves with a lower epidermal thickness of 18.89 µm or more are considered to exhibit a high degree of rolling.
Figure 10
Decision tree constructed via the splitting algorithm in conjunction with information gain, moderate degree of leaf rolling (MLR), and high degree of leaf rolling (HLR).
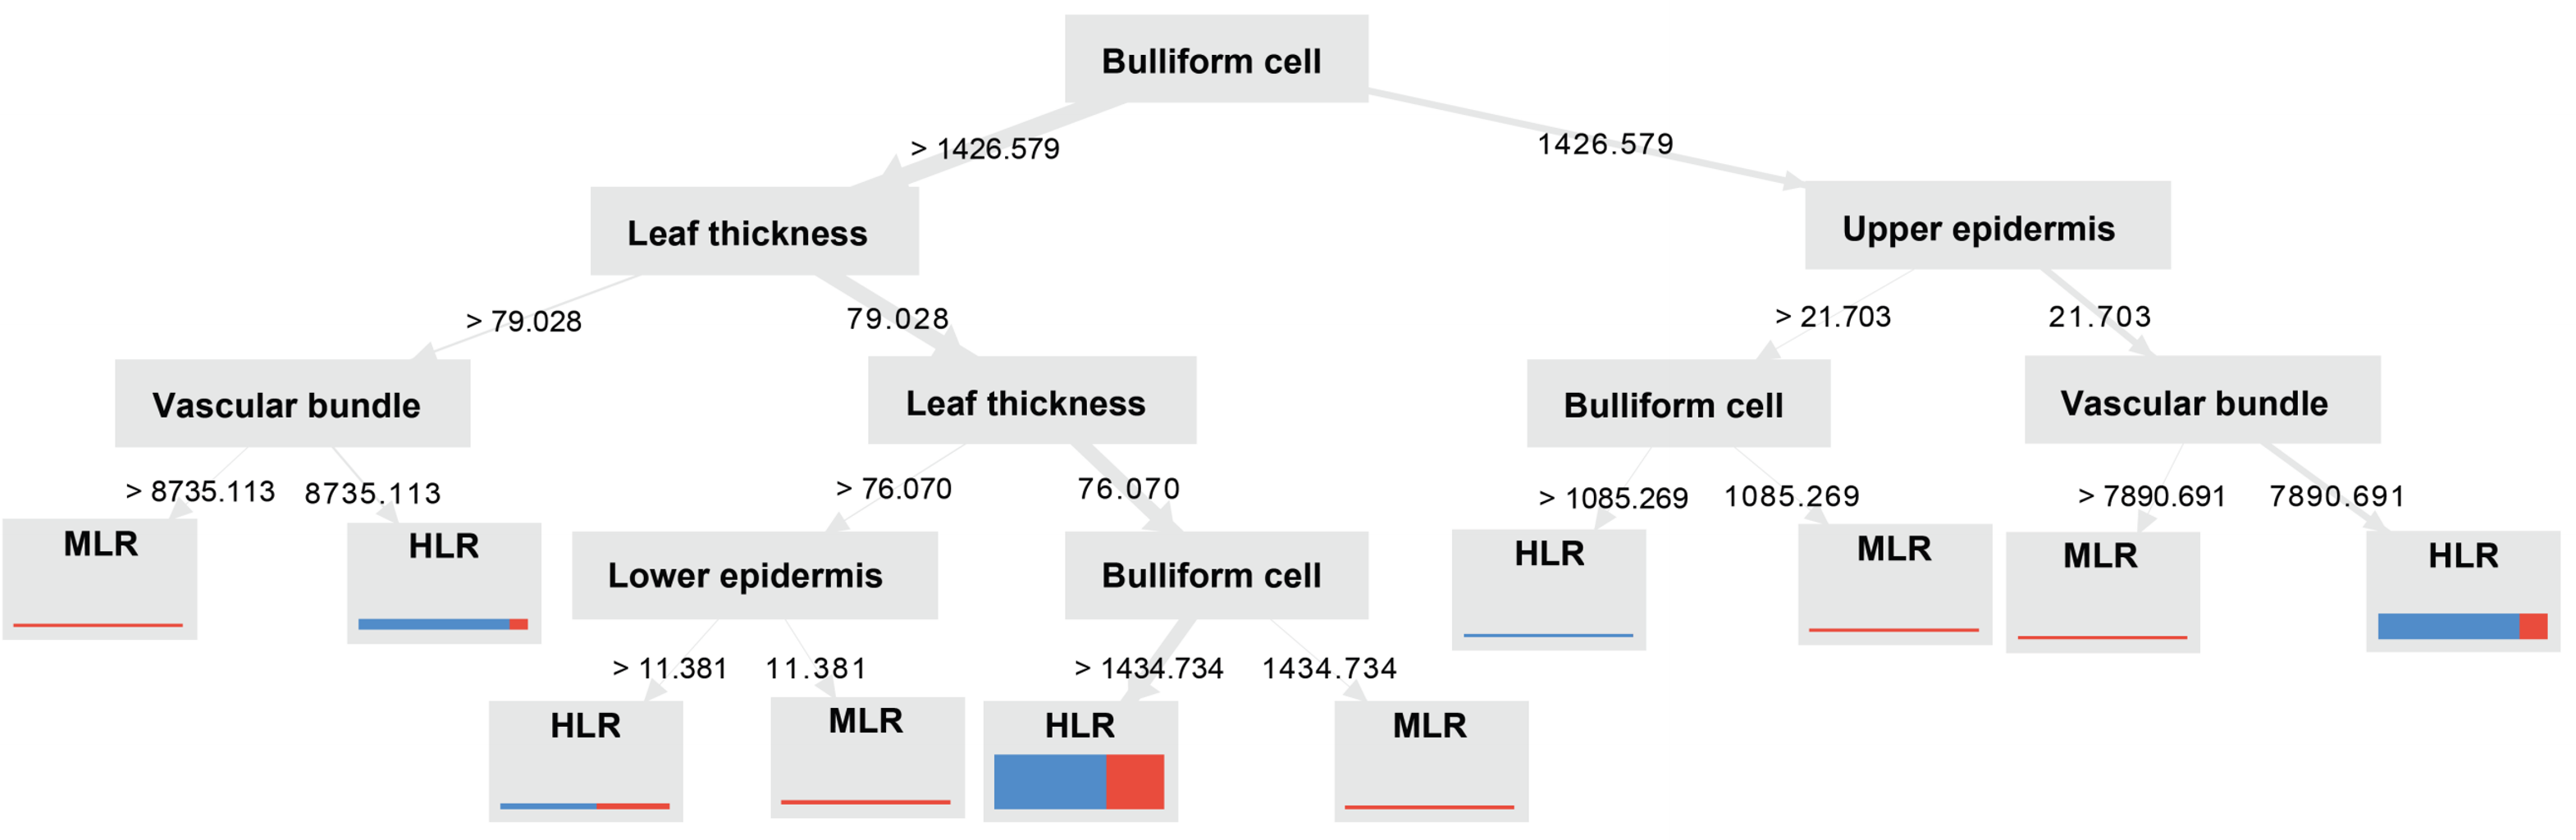
As shown in Figure 11, the root node of the bulliform cells generates decisions based on the Gini index. If the bulliform cell area was more extensive than 1,426.579 µm2, the leaf thickness and upper epidermis were evaluated as constituting the next child node. The vascular bundle area of 8,735.11 µm2 under nodes with a leaf thickness of more than 79.026 µm was determined to be the cutoff for a moderate degree or high degree of leaf rolling. While the node with a leaf thickness less than 79.026 µm was the first splitting node, the lower epidermis and bulliform cells constituted the next nodes. Leaf thicknesses of more than 76.07 µm but less than 79.028 µm exhibited intense rolling when the lower epidermis was greater than 11.381 µm; otherwise, those leaves exhibited a moderate degree of rolling. Leaves thinner than 76.07 µm but with large bulliform cell areas (more than 1,434.734 µm2) were considered to be highly rolled. Nodes containing bulliform cells and vascular bundles were isolated from the upper epidermis when their bulliform cell area was smaller than 1,426.579 µm2 (separated from the root node). To classify leaves as exhibiting a high or moderate degree of rolling, the bulliform cell area of the upper epidermis had to be greater than 1,085.2 µm2, and the epidermis also had to be thinner than 21.70 µm. A high degree of leaf rolling was observed when the vascular bundle area was less than 7,890.691 µm2 and when the upper epidermis was thinner than 21.703 µm. According to the Gini index, a high degree of leaf rolling may be supported by characteristics such as a low epidermal thickness and large bulliform cells. The predictive ability was compared across all three splitting criteria. The accuracy of the gain ratio and Gini index (70.90% and kappa 0.015) was determined to be the same as that of the information gain (68.25% and kappa –0.036) when the decision trees created were used, as shown in Table 4.
. Discussion
Twenty-eight rice cultivars native to northeastern Thailand were used in this study.
Sixteen cultivars exhibited a moderate degree of leaf rolling. The leaf rolling index of these cultivars ranged from 4 to 5, whereas the other 12 cultivars showed a significant amount of leaf rolling (leaf rolling index ranging from 6 to 7). ChaoLuang, LaoTak, and ManPed are the three native rice cultivars with the lowest degree of leaf rolling, whereas DonNangNuan, KamNiaw, and Pandan are the native cultivars with the highest degree of leaf rolling. The rice cultivars developed by the breeders included in this study, CT993, a drought-tolerant rice cultivar, and KDML105, a commercial rice cultivar, are not native. Both exhibited a high degree of leaf rolling. When rice is subjected to drought, one of the adaptations of the plants is the rolling of their leaves. As a result, the area of the leaves decreased because of rolling. Dehydration or water loss is reduced as a result of this decrease. Consequently, this phenomenon helps slow or alleviate the stress caused by dehydration. When the water supply changes, the radiation impact on the canopy can be alleviated when necessary by the rolling of leaves, which substantially decreases the amount of intercepted radiation (Begg, 1980). Singh et al. (2011) showed that, in rice leaves, the water loss rate is positively linked to the degree of rolling, with a 36% decrease in water loss due to partial rolling and a 52% reduction in water loss due to complete rolling. Breeders developing hybrid and superhybrid rice varieties can use leaf rolling to indicate leaf water potential (O’Toole & Cruz, 1979). However, it is not always possible to predict how well these rice cultivars would perform under dry conditions on the basis of leaf rolling alone. This is because the response of rice to drought may be mediated by a variety of mechanisms or reactions, depending on the rice variety. In this study, leaf anatomical traits were used to compare the structural modifications that occurred under drought stress conditions to those that occurred under control (no drought) conditions.
When the rice leaves were exposed to drought, the bulliform cells decreased by 36.8% in the high-leaf rolling group and by 30.8% in the moderate-leaf rolling group. These results indicate that bulliform cell shrinkage causes rice leaf rolling during drought. These findings are comparable to those of Salsinha et al. (2021), who found that rice cultivars exhibit a reduction in the size of their bulliform cells under drought-stress conditions. These phenomena are related to plant-water management. The rate of transpiration decreased as the turgidity of the bulliform cells decreased, preventing a relatively large amount of water loss. These factors in turn cause plants to roll their leaves. By regulating the cell size and number of adaxial epidermal cells, bulliform cells adjacent to vascular bundles surrounding the midrib of epidermal cells are involved in leaf rolling (Li et al., 2017).
Increased leaf thickness was found to be associated with increased size of the upper epidermis, with a 10.98% increase in the high-leaf rolling group and a 9.95% increase in the moderate-leaf rolling group. Drought resistance in most plant species is correlated with structural alterations, such as thicker leaves and epidermis (Balsamo et al., 2006). In grass species, the epidermis or outer layer of the plant is often thick, which may be associated with the prevention of excessive water loss via leaf surfaces (Conesa et al., 2019; Hameed et al., 2012).
In the high-leaf rolling group, the bundle sheath size decreased by 11.95% when the rice leaves were exposed to drought, whereas in the moderate-leaf rolling group, it increased by 7.41%. A study by Cal et al. (2019) found that vascular bundle size and quantity were associated with leaf rolling response. Water flows through the xylem, and this flow is influenced by xylem diameter, plant height, and quantity of xylem fibers that regulate hydraulic conductance (Conesa et al., 2019; Martínez-Vilalta et al., 2014). Similarly, plant adaptation processes are influenced by the structure of vascular anatomy (Qaderi et al., 2019). Under drought-stress conditions, decreased vascular bundle size was a strong indicator of rice cultivar susceptibility to drought stress, whereas the opposite was true for highly drought-tolerant rice cultivars. The amount of structural carbohydrates in vascular tissue decreases in response to prolonged drought stress, which may lead to a loss of cavitation. When exposed to drought, plants experience decreased hydraulic conductance, which results in reduced water uptake, stomatal closure, and ultimately, plant death (Martínez-Vilalta et al., 2014; Qaderi et al., 2019).
For plants that exhibited a high degree of leaf rolling under drought-stress conditions, leaf thickness decreased by 3.27%; for those with a moderate degree of leaf rolling, leaf thickness decreased by 6.82%. Salsinha et al. (2021) revealed that drought stress reduces leaf thickness through a mechanism linked to the net carbon absorption and photosynthetic performance of plants. The stronger a plant’s tolerance to drought, the better its ability to minimize biomass loss via physiological control and other internal processes. In this study, the anatomical properties of the leaves were not correlated with the leaf rolling index based on the cross-sectional images of the leaves. As a result, decision tree and machine learning methods were used to determine the characteristics that indicate whether the leaves had a high or moderate degree of rolling; the decision tree approach is the method of choice for predictions, since this method presents a hierarchical ranking of important features and provides a clear image of effective factors (Ebrahimi et al., 2011). According to the decision trees constructed in the present study, rice should exhibit distinct features for its leaves to be classified as having a high degree of rolling, including (1) a relatively thin lower epidermis with large bulliform cells (gain ratio splitting criteria); (2) substantially large bulliform cells and overall thin structure (information gain); or (3) very small bulliform cells, a thin upper epidermis, and a limited number of vascular bundles (Gini index). We could infer that when the leaves were exposed to drought, they rolled up and a substantial number of anatomical adaptions occurred. Bulliform cells contract and function as a hinge, which enables the leaves to roll upward (Zou et al., 2011). There was also a decrease in the size of vascular bundles, bundle sheath cells, and leaf thickness, with a slight increase in the thickness of the upper epidermal layer. With respect to the leaf anatomical features that give rise to a high degree of leaf rolling, the decision tree model revealed that large bulliform cell size is a substantial component that contributes to a high degree of leaf rolling (Xu et al., 2018; Zou et al., 2014).
The next critical series of components included a relatively thin leaf with a relatively thin lower epidermis and small vascular bundles. Different strategies for leaf structural changes have evolved in species that face numerous stressors, including salt, drought, and high temperatures, to better survive under water-limited conditions (Ebrahimi et al., 2011; Zou et al., 2011). Osmotic adjustment and changes in leaf water potential during dehydration are associated with leaf rolling (Hsiao et al., 1984; Mishra & Panda, 2017; Panda et al., 2021). As previously reported, structural changes in rice leaves are quite specific, indicating substantial interactions between ecotypes and drought levels (O’Toole & Cruz, 1980; Price et al., 2002). The entire adaxial surface of the leaves is covered with highly developed bulliform cells. Owing to their large size, these bulliform cells likely facilitate leaf rolling to prevent water loss from the leaf surface through evaporation (Abernethy et al., 1998).
The use of decision trees to discover complex patterns or relationships is an advantage of machine learning. Studies have reported the feasibility of using machine learning in plant science research. For example, fruit detection of sweet pepper using deep neural networks with an accuracy of 0.838 (Sa et al., 2016), risk forecasting of powdery mildew on strawberry plants by decision trees with an accuracy ranging from 0.82–0.97 (Carisse & Fall, 2021), determination of the most important physiological and agronomic traits contributing to maize grain yield (Shekoofa et al., 2014), and early detection of red palm weevils with an accuracy of 93.08% have been reported (Kurdi et al., 2021). Although the accuracy of the decision tree in this study was only 70.90%, the accuracy of other classification and prediction applications may be lower. However, this study is a preliminary attempt to use data mining techniques to assess plant anatomy in response to abiotic stress, which may lead to other machine-learning applications or implementations in the analysis of anatomical aspects applicable to other plant science research.
