. Introduction
White turmeric (Curcuma aromatica Salisb.) is a herb belonging to the Zingiberaceae family (Anoop, 2015). Tropical and subtropical forests, forest margins, open grasslands, secondary forests, plantations, and areca forests in Asian countries (including India, China, Thailand, Malaysia, Philippines, Vietnam, and Indonesia) are the natural habitats for this species (Sabu, 1991).
White turmeric rhizomes are rich in essential oils and contain many secondary metabolites, including zederone, curdione, neocurdione, curcumol, tetramethyl pyrazine, 1,2-hexadecanediol, 9-oxo-neoprocurcumenol, neoprocurcumenol, curcumin, β-curcumene, ar-curcumene, xanthorrhizol, germacrone, camphor, curzerenone, 7-methanoazulene, 1,8-cineole, β-elemene, and linalool (Ahmad et al., 2011). Among these metabolites, curcumin is the most important compound in white turmeric rhizomes because of its ability to inhibit various cancer cell lines by regulating the cell cycle and inducing apoptosis (Minh et al., 2019). Curcumin has demonstrated other additional benefits, including the treatment and prevention of pro-inflammatory chronic diseases (Aggarwal & Harikumar, 2009), reduction of serum pro-inflammatory cytokine levels in patients with metabolic syndrome (Panahi et al., 2016), and the treatment for many other diseases (chronic renal failure, dry eye, glaucoma, jaundice, and diabetic retinopathy) (Allegri et al., 2010; Trujillo et al., 2013; Wurr et al., 1993).
Under natural conditions, white turmeric rhizomes are gradually induced approximately 210 days after planting during the rainy season (Ravindran et al., 2007). Curcuminoids also accumulate slowly during the development of white turmeric rhizomes (Baranowski, 1986). Moreover, changes in genotype, cultivation location, and processing procedures can result in changes in the chemical profile of commercial rhizomes (Pistellia et al., 2012). Therefore, the quantities of high-quality, genetically identical white turmeric rhizomes are insufficient for cultivation and subsequent extraction of metabolites.
In addition to the long cultivation time, the traditional method of white turmeric propagation has many other disadvantages, including the high cost of rhizome storage for future seasons and the presence of pathogens (Pythium spp., Taphrina spp., and Collectotrichum spp.) in the stored rhizomes (Nayak & Naik, 2006). Moreover, white turmeric has also become a vulnerable species in South Asia due to deforestation, illegal cultivation, and reliance of the pharmaceutical industry on wild roots (Kumar & Sikarwar, 2002).
The in vitro production of microrhizomes can overcome the disadvantages of traditional cultivation methods. First, genetically similar microrhizomes can be produced on a large scale to provide disease-free, superior-quality seed rhizomes for cultivation (Nayak & Naik, 2006; Sharmin et al., 2013). In addition, microrhizomes could replace natural rhizomes as potential materials for secondary metabolite production. Specifically, Mazzolani and Togni (2013) and Thakur et al. (2013) claimed that the concentrations and antioxidant activities of secondary metabolites in Chlorophytum borivilianum Sant. microrhizomes were equal to or higher than those of natural rhizomes.
Despite the health benefits of curcumin and the disadvantages of white turmeric cultivation methods, there are only two studies on white turmeric microrhizome induction and optimization of the curcumin content in microrhizomes. In particular, Wu et al. (2015) investigated the effects of sucrose and α-naphthaleneacetic acid on the accumulation of curcumin and other curcuminoids in white turmeric. Additionally, Nayak (2000) examined the effects of sucrose, 6-benzyladenine, and photoperiod on the induction of white turmeric microrhizomes. There were only three main factors tested in their studies (light, sucrose, and plant growth regulators - PGRs). These factors are insufficient to determine the optimal conditions for microrhizome growth and curcumin accumulation. Therefore, it is necessary to test many other relevant factors.
Considering the disadvantages of traditional cultivation methods and the lack of research to determine suitable conditions for curcumin accumulation in induced microrhizomes, this study examined the influence of several factors (sucrose, 6-benzylaminopurine, kinetin, α-naphthaleneacetic acid, indole-3-butyric acid, yeast extract, salicylic acid, and boric acid) on the growth of white turmeric microrhizomes and curcumin synthesis. In our study, the stimulating effect of boric acid on microrhizome induction and growth was tested for the first time. In addition, yeast extract and salicylic acid were also used for the first time to enhance curcumin accumulation in white turmeric microrhizomes. The curcumin content in induced microrhizomes was compared with that in natural rhizomes to examine the possibility of using microrhizomes for secondary metabolite extraction.
. Materials and Methods
. Plant Materials
Two-month-old white turmeric plantlets (C. aromatica Salisb.), provided by the Department of Biology, Hue University of Sciences, were the plant materials used in this study.
. Experimental Procedures
. Shoot Multiplication
The plantlets were propagated on MS (Murashige & Skoog, 1962) medium containing 30 g/L sucrose, 8 g/L agar, and 1 mg/L 6-benzylaminopurine (BAP), creating a sufficient source of materials for the study within two months (Sharmin et al., 2013). Thereafter, the roots and leaves of the plantlets were trimmed, resulting in three-to-four-centimeter segments. Finally, the segments were subcultured on microrhizome-inducing media.
. Determination of optimal media for microrhizome induction and growth
Experiments were performed to examine the effects of different factors on microrhizome induction and growth. Each experiment lasted for four months. The mean fresh weight, diameter, and induction rate of microrhizomes were calculated for each treatment.
First, the effects of different concentrations of sucrose (30, 60, 80, and 100 g/L) in the growth medium were examined. Sucrose concentrations in the MS medium were based on the optimal sucrose concentration (80 g/L) determined in microrhizome induction studies of several Zingiberaceae species (An et al., 2020; Sunitibala et al., 2001). The sucrose concentration that gave the best results and 11 µM AgNO3 (stated by Singh et al. (2012) as a stimulator for microrhizome induction and growth) were used in subsequent experiments, which were conducted independent of each other.
BAP and kinetin (KIN) at different concentrations, including 1, 3, 5, and 7 mg/L (Nayak, 2000), were added individually to MS medium to examine the effects of cytokinins on microrhizome formation. Auxins, including α-naphthaleneacetic acid (NAA) and indole-3-butyric acid (IBA), were added individually to the medium at different concentrations (2, 4, 6, and 8 mg/L) to study the responses of the cultured plantlets.
The effect of boron on microrhizome growth was tested by adding different concentrations of H3BO3 in the MS medium, including 15.5 (c/4), 31 (c/2), 62 (c), 124 (2c), 248 (4c), and 372 (6c) mg/L (c is the H3BO3 concentration in the MS medium).
The effects of salicylic acid (SA) (50, 100, 300, and 500 µM (Lan et al., 2019)) and yeast extract (YE) (0.5, 2.0, 3.5, and 5.0 mg/L (Abraham et al., 2011)) on induction and growth of white turmeric microrhizome were examined by adding them individually in the culture medium.
The best treatment data from the experiments were pooled together. The average fresh weight and diameter of microrhizomes for each treatment were then compared to those of the pooled group to determine the final optimal medium concentration that yielded higher microrhizome growth values than the pooled group.
. Effects of elicitors (SA and YE) on curcumin accumulation in white turmeric microrhizomes
The curcumin content of four in vitro samples (shoot bases of plantlets grown on basal MS medium and microrhizomes developed on MS media each with optimal sucrose, YE, and SA content) and one rhizome sample (grown in garden soil and then chopped into cubes) were compared in this experiment. This comparative assessment revealed the effects of YE and SA on curcumin accumulation and the potential of microrhizomes for curcumin extraction.
Samples were randomly collected until their fresh weight reached 100 g per sample. The collected samples were then dried at 60 °C for 48 h and homogenized to powder afterwards. This powder (5 g) was mixed with 150 mL of 80% ethanol and refluxed at 30 °C (in dark conditions) for 30 min. The refluxed mixture was subsequently centrifuged at 5000 rpm for 15 min, and the resulting supernatant was filtered through a 0.22 µm membrane. The filtered solution was analyzed by HPLC (high-performance liquid chromatography) (Wu et al., 2015).
HPLC analysis was performed according to the method described by Zhang et al. (2011) (with several modifications). HPLC LC-20AD system with PDA SPD-M20A detector (Shimadzu, Japan) and InertSustain C18 (250 mm × 4.6 mm, 5 µm) column was used. Acetonitrile (ACN): 5% acetic acid (1:1, v/v) mixture was the mobile phase. Column temperature, mobile phase flow rate, detection wavelength, and sample volume were 30 °C, 1 mL/minute, 425 nm, and 20 µL, respectively. All five sample extracts were filtered by using 0.22 µm membranes prior to injecting for HPLC analysis. Curcumin powder (AK Scientific, USA) was used as the standard reference chemical. Curcumin concentrations in the samples were calculated based on the peak areas and the standard calibration curve prepared by using the standard curcumin sample (Wu et al., 2015; Zhang et al., 2011).
Standard function construction: Standard curcumin (10 mg) was added into a 10 mL flask, then volume was made up by adding methanol (MeOH) into the flask to obtain a 1 mg/mL standard curcumin stock solution. This standard stock solution was diluted with MeOH to form a dilution series of 0.02, 0.04, 0.06, 0.08, and 0.1 µg curcumin/mL. The diluted solutions were analyzed by HPLC (under the above conditions) to construct a linear regression model (y = ax + b) describing the relationship between the peak area (mAU s) and curcumin concentration (µg/mL).
. Effects of various microrhizome sizes on ex vitro plant regeneration
White turmeric microrhizomes of different sizes (5–10 mm (L1), 10–15 mm (L2), 15–20 mm (L3), and > 20 mm (L4)) were sown in pots containing a mixture of loam–sand–manure (1:1:1) for two months to determine the optimal microrhizome size for ex vitro plant regeneration. NPK fertilizer (10:10:5) was added to the irrigation water at a concentration of 100 mg/L. The plants were watered twice per week (Galal, 2012).
. Culture conditions
The media (pH 5.8) used in all experiments contained 8 g/L agar and was autoclaved at 121 oC and 1 atm for 21 min. The autoclaved medium (60 mL) was poured into a 250 mL Erlenmeyer flask capped by two layers of aluminum foil.
Each Erlenmeyer flask contained one plantlet. Thirty flasks were used in each treatment experiment.
All cultures were incubated at 24–26 °C under 1.2 m LED light bulbs, each having a light intensity of 34 µmol/m2 s and photoperiod of 8 light hours:16 dark hours (Nayak, 2000; Sunitibala et al., 2001).
. Data analysis
In the microrhizome induction and growth optimization experiments, each treatment was performed in triplicate, with a total of 30 plantlets (3 × 10). After four months of cultivation, one plantlet produced many microrhizomes. Fifty microrhizomes were randomly selected per treatment for data analysis.The sampled microrhizomes were weighed and their diameters measured after trimming their roots and shoots. Plantlets that did not exhibit microrhizome induction were considered to have zero microrhizome weight and diameter.
In the acclimatization experiment, each pot contained 1–2 microrhizomes. After two months of microrhizome ex vitro cultivation, the regeneration rate (%), regeneration time (weeks), and shoot height (mm) were recorded. In each planted size category (Section 2.2.4), 30 pots were randomly selected to calculate the values of the target parameters.
Curcumin content (H) in the five rhizome/microrhizome samples (Section 2.2.3) was determined using the following linear regression model:
where, y: peak area (mAU s)
a, b: slope and intercept coefficients of the function y = ax + b (x: µg/mL)
f: dilution factor
V: volume of the sample (mL)
m: weight of the sample (g).
All data were analyzed using RStudio (version 2021.09.2-382) and IBM SPSS Statistics (version 20). Mean values from the experimental data were compared and separated using ANOVA and Tukey’s test, respectively (α = 0.05). However, to determine the final optimal medium for microrhizome growth, the average microrhizome fresh weight and average diameter of the best treatments for each mentioned factor were compared with those of the pooled group mean values using Hotelling’s T2 test. The normality assumption of the test was checked using the multivariate Shapiro–Wilk test (α = 0.05). In addition, the determinant of the variance-covariance matrix was calculated using the det() and cov() functions in RStudio. The dependent variables for the test were the microrhizome fresh weight and diameter.
. Results
. Effect of sucrose on white turmeric microrhizome induction and growth
High sucrose concentrations had a positive impact on the growth of the microrhizome. Specifically, 100% of the explants on MS media containing 60–100 g/L sucrose produced microrhizomes, whereas microrhizomes were not induced on medium with 30 g/L sucrose (Figure 1A). Additionally, the fresh weight and diameter of the microrhizomes were maximal at 80 g/L sucrose (332.16 mg and 7.64 mm, respectively) (Figure 1B). However, both fresh weight and diameter decreased when the sucrose concentration in the medium was increased to 100 g/L (Table 1).
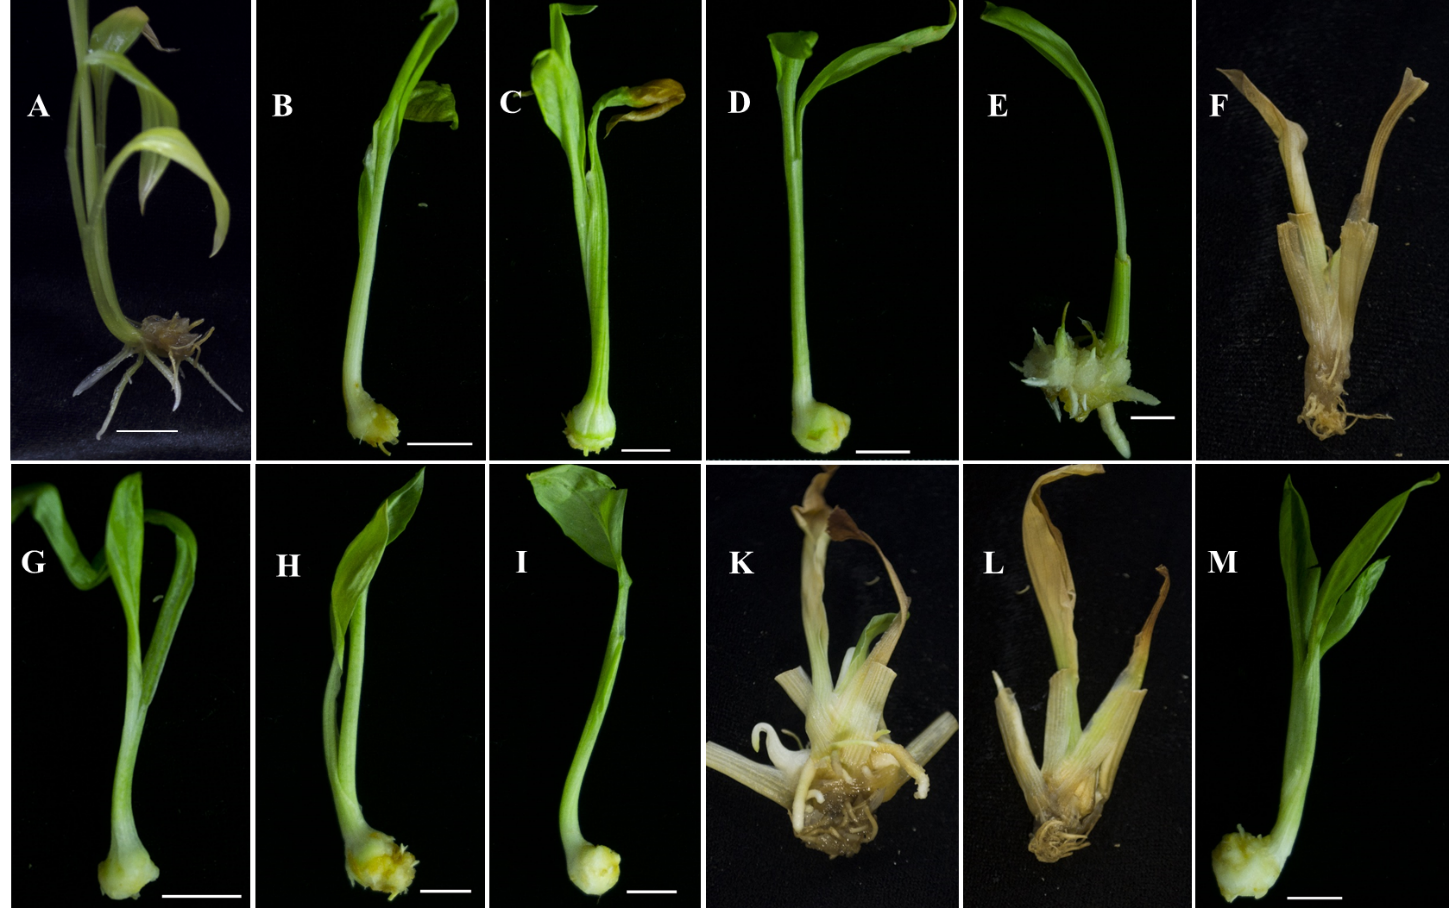
Figure 1
Typical microrhizomes grown on media with different supplements. (A) MS + 30 g/L sucrose; (B) MS + 80 g/L sucrose; (C) MS + 80 g/L sucrose + 11 µM AgNO3 + 1 mg/L BAP; (D) MS + 80 g/L sucrose + 11 µM AgNO3 + 1 mg/L KIN; (E) MS + 80 g/L sucrose + 11 µM AgNO3 + 2–6 mg/L NAA; (F) MS + 80 g/L sucrose + 11 µM AgNO3 + 8 mg/L NAA; (G) MS + 80 g/L sucrose + 11 µM AgNO3 + 2 mg/L IBA; (H) MS + 80 g/L sucrose + 11 µM AgNO3 + 248 mg/L H3BO3; (I) MS + 80 g/L sucrose + 11 µM AgNO3 + 50 µM SA; (K) MS + 80 g/L sucrose + 11 µM AgNO3 + 300 µM SA; (L) MS + 80 g/L sucrose + 11 µM AgNO3 + 500 µM SA; (M) MS + 80 g/L sucrose + 11 µM AgNO3 + 0.5 mg/L YE. Scale bar: 10 mm.
. Effects of PGRs on white turmeric microrhizome induction and growth
Among the PGRs tested, BAP and KIN at 1 mg/L gave the best results, with microrhizome fresh weight and diameter of 531.06 mg and 10.06 mm, and 514.58 mg and 10.02 mm, respectively. Cytokinin concentrations greater than 1 mg/L inhibited microrhizome growth (Figure 1C, 1D, Table 2, and Table 3).
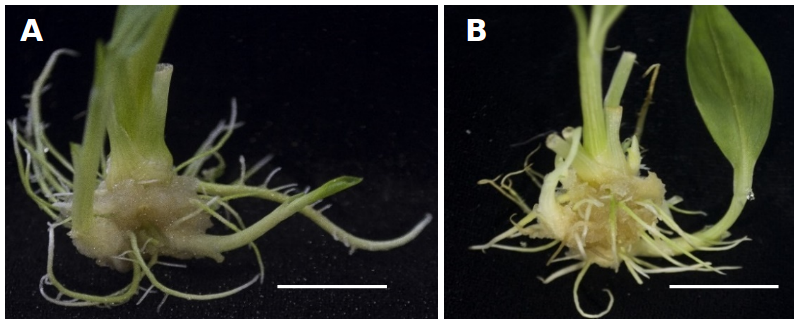
NAA had no significant effect on microrhizome growth. Specifically, microrhizomes grown on media containing 2–6 mg/L NAA were not significantly larger or heavier than those grown on the control medium (0 mg/L NAA) (Figure 1E, Table 4). White turmeric plantlets died after two months of culture in medium supplemented with 8 mg/L NAA (Figure 1F, Table 4). NAA (4 and 6 mg/L) induced callus formation around the roots and microrhizomes (Figure 2). In contrast to NAA, IBA had a stimulating effect on microrhizome growth, with an optimal concentration of 2 mg/L (fresh weight: 500.20 mg, diameter: 9.64 mm) (Figure 1G, Table 5).
Table 1
Impact of different sucrose concentrations on microrhizome induction and growth.
| Sucrose concentrations (g/L) | Induction rate (%) | Microrhizome fresh weight (mg) | Microrhizome diameter (mm) |
|---|---|---|---|
| 30 | 0 | 0.00 ± 00.00c* | 0.00 ± 0.00c |
| 60 | 100 | 222.72 ± 39.54b | 6.22 ± 0.73b |
| 80 | 100 | 332.16 ± 78.33a | 7.64 ± 1.03a |
| 100 | 100 | 225.76 ± 74.33b | 6.26 ± 0.72b |
* Note (applicable for Tables 1–8): within a column, mean values having a letter in common are not significantly different according to Tukey’s test (p > 0.05). The values are 95% CI of mean (mean ± t (49) × SE, where t (49) is the upper 0.025 critical value for the t distribution with 49 degrees of freedom).
Table 2
Impact of different concentrations of 6-benzyl amino purine (BAP) on microrhizome induction and growth.
Table 3
Impact of different kinetin (KIN) concentrations on microrhizome induction and growth.
Table 4
Impact of different α-naphthaleneacetic acid (NAA) concentrations on microrhizome induction and growth.
Table 5
Impact of different indole-3-butyric acid (IBA) concentrations on microrhizome induction and growth.
. Effects of boron on white turmeric microrhizome induction and growth
Boron was supplemented in the culture medium as H3BO3 with MS medium containing 62 mg/L H3BO3 as the control. The optimal H3BO3 concentration for microrhizome growth was 248 mg/L (fresh weight: 599.86 mg, diameter: 10.60 mm) (Figure 1H). Further increasing H3BO3 content (372 mg/L) resulted in decreased microrhizome fresh weight and diameter (349.02 mg and 7.22 mm, respectively). Notably, decreasing the H3BO3 concentration to 31 and 15.5 mg/L had no significant impact on microrhizome growth compared to that in the control medium (Table 6).
Table 6
Impact of different H3BO3 (Boron) concentrations on microrhizome induction and growth.
| H3BO3 (mg/L) | Induction rate (%) | Microrhizome fresh weight (mg) | Microrhizome diameter (mm) |
|---|---|---|---|
| 15.5 | 100 | 391.86 ± 60.87b | 8.32 ± 0.91b |
| 31 | 100 | 360.78 ± 50.71b | 8.06 ± 0.76b |
| 62* | 100 | 328.58 ± 86.88b | 7.50 ± 1.02b |
| 124 | 100 | 418.10 ± 77.28b | 8.54 ± 1.02b |
| 248 | 100 | 599.86 ± 105.48a | 10.60 ± 1.07a |
| 372 | 100 | 349.02 ± 51.28b | 7.22 ± 0.75b |
. Effects of SA and YE on white turmeric microrhizome induction and growth
Low SA concentrations (50 µM and 100 µM) had a stimulatory effect on microrhizome induction and growth. 50 µM was the optimal SA concentration stimulating the formation of microrhizomes with an induction rate of 100%, and an average fresh weight and diameter of 555.88 mg and 10.10 mm, respectively (Figure 1I). In vitro plantlets could not survive in medium supplemented with high SA concentrations (300 and 500 µM) (Figure 1K and 1L, Table 7).
Similarly, only low YE concentration (0.5 mg/L) could stimulate the induction and growth of microrhizomes (fresh weight: 821.12 mg, diameter: 12.56 mm) (Figure 1M). Specifically, microrhizome fresh weight and diameter decreased when the YE concentration was increased from 2.0 to 5.0 mg/L in the medium (Table 8).
Table 7
Impact of different salicylic acid (SA) concentrations on microrhizome induction and growth.
Table 8
Impact of different YE concentrations on microrhizome induction and growth.
. Comparison of the average fresh weight and diameter of microrhizomes induced by the optimal concentrations of sucrose, BAP, KIN, IBA, B, SA, and YE and those of the pooled group
According to Hotelling’s T2 test results, there was no significant difference between the mean fresh weight and diameter of microrhizomes induced by the optimal concentrations of the treatment supplements such as 1 mg/L BAP, 1 mg/L KIN, 2 mg/L IBA, 248 mg/L H3BO3, and 50 µM SA and those of the pooled group. YE at 0.5 mg/L was the only factor that could increase white turmeric microrhizome fresh weight and diameter to values greater than the pooled group’s mean values of 548.98 mg and 10.07 mm for fresh weight and diameter, respectively (Figure 3).
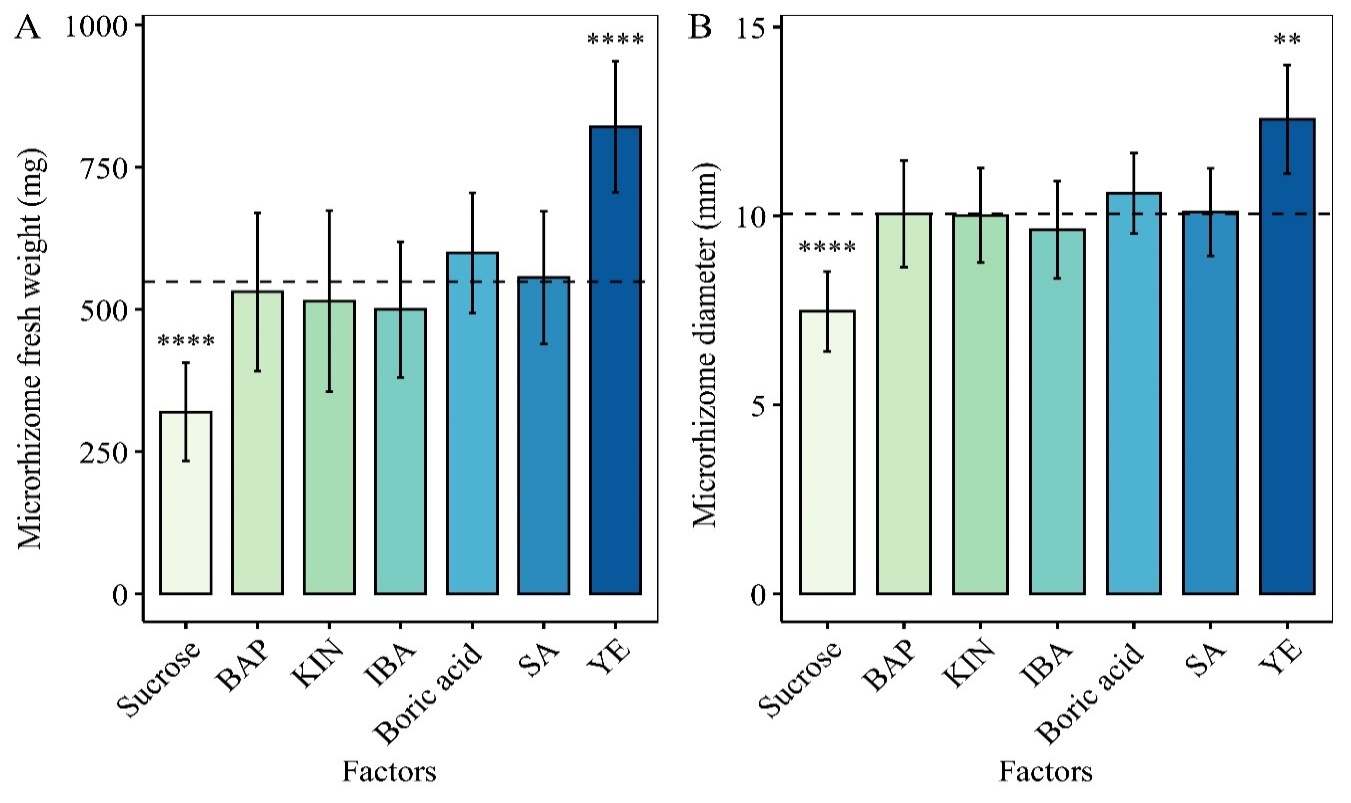
Figure 3
Bar graphs showing Hotelling’s T2 test results for microrhizome fresh weight (A) and diameter (B) grown on medium with 80 g/L sucrose, 1 mg/L BAP, 1 mg/L KIN, 2 mg/L IBA, 248 mg/L H3BO3, 50 µM SA, and 0.5 mg/L YE. The mean microrhizome fresh weight and diameter of 80 g/L sucrose and 0.5 mg/L YE are significantly different from those of the pooled group (**** p < 0.0001, ** p < 0.01). YE at a concentration of 0.5 mg/L stimulated the formation of the largest and heaviest microrhizome. Error bars are 95% CI of mean (mean ± t (49) × SE, where t (49) is the upper 0.025 critical value for the t distribution with 49 degrees of freedom). The dashed lines represent the pooled group’s mean values (548.98 mg and 10.07 mm, for fresh weight and diameter, respectively).
. Effects of SA and YE on curcumin accumulation in microrhizomes
A linear regression model of curcumin content and peak area was constructed and used to calculate curcumin concentrations in the five samples (Figure 4). Microrhizomes grown in induction media supplemented with 80 g/L sucrose, 50 µM SA, and 0.5 mg/L YE, respectively, had curcumin contents that were 2–25 times higher than the natural rhizomes. YE was the best elicitor for stimulating curcumin production (peak area: 6443 mAU s; curcumin content in the sample: 1.79 µg/g). This experiment also showed that there was an extremely small amount of curcumin in the shoot bases of plantlets cultured in basal MS medium (peak area: 98 mAU s) (Table 9).
Figure 4
Standard line and the linear regression model of curcumin concentration (µg/mL) and peak area (mAU s).
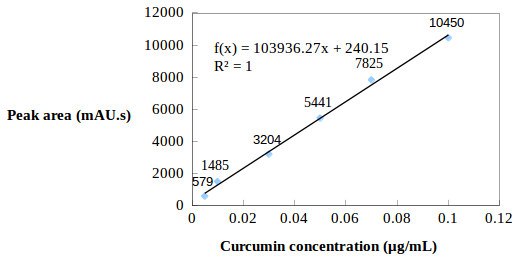
Table 9
Curcumin accumulation in five different samples after four months of culture.
| Sample codes | Peak area (mAU s) | Measured curcumin concentration (µg/mL) | Curcumin content in the samples (µg/g) |
|---|---|---|---|
| YE2 | 6443 | 0.0597 | 1.79 |
| TN2 | 482 | 0.0023* | 0.07 |
| IN2 | 98 | −0.0014* | −0.04 |
| SU2 | 795 | 0.0053 | 0.16 |
| SA2 | 846 | 0.0058 | 0.17 |
[i] Note: Natural rhizome (TN2), shoot base of plantlets in basal MS medium (IN2), microrhizome in the MS medium with 80 g/L sucrose (SU2), microrhizome in the MS medium with 50 µM SA (SA2), and microrhizome in the MS medium with 0.5 mg/L YE (YE2). *Values less than the detection limit of the analysis method.
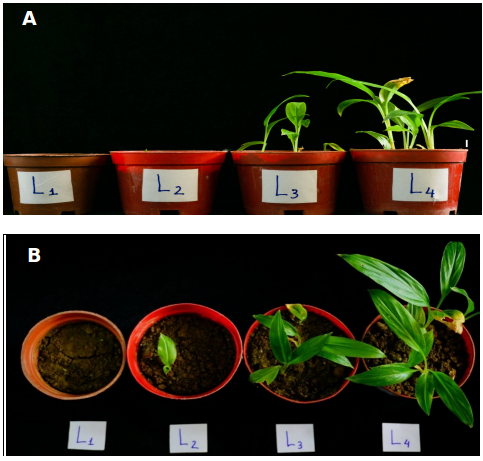
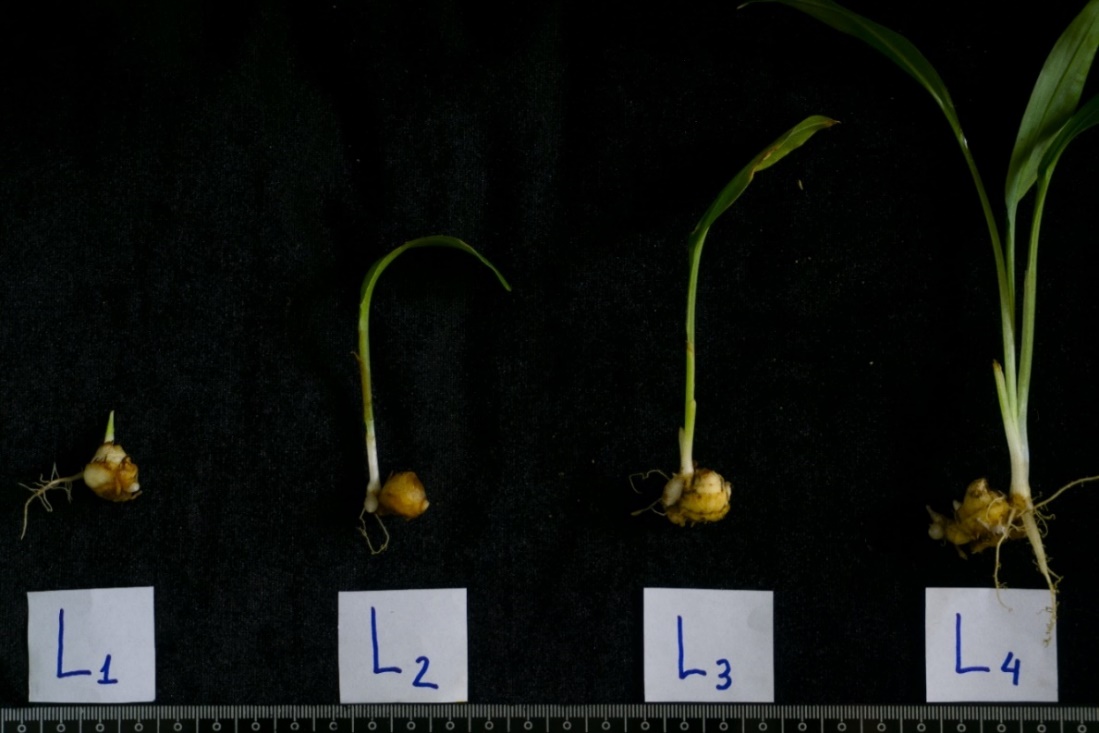
. Effect of microrhizome size on ex vitro regeneration
Table 10 shows that the germination rate and shoot height increased when microrhizome size increased. Additionally, large microrhizomes exhibited a shorter germination duration than that of the smaller size microrhizomes. The optimal size of microrhizome for ex vitro regeneration was L4 (>20 mm), with a germination rate, duration, and shoot height of 83.33%, 5.21 weeks, and 45.10 mm, respectively (Figure 5 and Figure 6, Table 10).
Table 10
Impacts of different microrhizome sizes on ex vitro regeneration.
[i] Note: L1 (5–10 mm), L2 (10–15 mm), L3 (15–20 mm), L4 (> 20 mm). * Within a column, mean values with a letter in common are not significantly different according to Tukey’s test (p > 0.05). The values are 95% CI of means (mean ± t (29) × SE, where t (29) is the upper 0.025 critical value for the t distribution with 29 degrees of freedom).
. Discussion
Owing to its higher content of amino acids, vitamins, and phytohormones, YE has long been known as a plant growth stimulator (Abdelaal et al., 2017; George et al., 2008). According to Kobayashi et al. (1980), low YE concentration (0.1 ppm) is suitable for promoting plant growth. In addition, it is a natural cytokinin that promotes cell division and growth chlorophyll formation, and protein and nucleic acid biosynthesis (El-Desouky et al., 1998; Taha et al., 2021). Furthermore, since YE can induce defense mechanisms against plant pathogens, it is also commonly used in plant tissue culture as an activator to produce secondary metabolites (Abraham et al., 2011). The known beneficial effects of YE on plant growth and secondary metabolite production may explain the formation of the largest and heaviest microrhizomes in the medium with YE in this study, which produced 25 times the amount of curcumin compared to the natural rhizomes (Figure 3, Table 9). The stimulatory effects of YE found in our study suggest that this elicitor may help to replace natural white turmeric rhizomes with microrhizomes. However, YE concentrations above 0.5 mg/L inhibited the formation and growth of microrhizomes (Table 8). This may be because of the adverse effects of high YE concentrations on plantlet growth (Vasil & Hildebrandt, 1966).
In addition to the stimulatory effects of YE, our study is the first to report the growth-promoting effects of SA at a low concentration (50 µM) on the formation of white turmeric microrhizomes (Table 7). However, when SA levels were increased to 300 or 500 µM, the plantlets became necrotic and did not form microrhizomes. Gentile et al. (2020) also observed that SA at 69 mg/L (close to 500 µM) caused leaf necrosis and root inhibition in most crops. SA is a phenolic compound present in many plant species. It is a product of the phenylpropanoid metabolism. In plants, SA triggers physiological and biochemical mechanisms to resist biotic and abiotic stress (Karuppaiah et al., 2003). Therefore, similar to YE, SA can also act as an elicitor to increase curcumin content in white turmeric microrhizomes (Table 9).
However, as shown in Table 9, although white turmeric microrhizomes may replace natural rhizomes, the curcumin levels in the five test samples from our study were much lower than those reported by Pistellia et al. (2012) and Wu et al. (2015). This might be due to genetic differences between our sample and those of other studies. Therefore, white turmeric varieties with a high curcumin content must be carefully selected prior to microrhizome induction and curcumin extraction.
Boron is an essential micronutrient for plants that stimulates tissue growth, cell elongation, and cell division (Brown et al., 2002; Marschner, 1990). Boron deficiency results in decreased cell wall synthesis, carbohydrate transport and metabolism, respiration, indole-3-acetic acid metabolism, phenolic compound metabolism, RNA synthesis, and membrane integrity (Pollard et al., 1977). In addition, boron can affect the growth and induction of roots, shoots, leaves, calluses, and meristematic cells (Al-Mayahi, 2019; Rawson & Subedi, 1996; Shams et al., 2012). We tested the ability of boron to stimulate microrhizome induction and growth based on previously discovered effects. Compared with the control medium, a four-fold increase in boron concentration (248 mg/L) was found to be most suitable for microrhizome induction and growth (Table 6).
Several authors have reported a positive effect of cytokinins on the formation of microrhizomes and microtubers. Smith and Palmer (1970) demonstrated that cytokinins are important factors influencing the induction of microtubers in potato stolons (Solanum tuberosum L.) in vitro. Additionally, Mauk and Langille (1978) observed an increased induction of potato minitubers (from 39% to 75%) upon adding 0.3 and 3.0 mg/L zeatin to the medium. In the present study, only small amounts of BAP and KIN (1 mg/L) stimulated the induction and growth of white turmeric microrhizomes (Tables 2 and 3). This result was in agreement with Chougule et al. (2011), who reported the use of 1 mg/L BAP to obtain the highest weight (0.62 mg) and number (7) of Curcuma longa microrhizomes. However, some studies have shown contradictory conclusions. Islam et al. (2004) utilized high concentrations of KIN for optimal growth of C. longa microrhizomes. In addition, KIN inhibits microrhizome formation in other species of the Zingiberaceae. An et al. (2020) observed weak Zingiber officinale microrhizome growth in MS medium supplemented with KIN.
The effects of the optimal KIN and BAP concentrations on C. aromatica microrhizome growth were comparable (Figure 3). Both compounds produce ribosylated derivatives and N-substituted glucosides in culture medium. Additionally, KIN and BAP are not degraded by cytokinin oxidases (Srivastava, 2002). These might be the reasons for the similarities between the effects of BAP and KIN.
Sucrose is often included in the list of factors that positively influence microrhizome induction in many plant species. In the Zingiberaceae family, 80 g/L sucrose is the optimal concentration for the induction and growth of rhizomes (An et al., 2020; Sunitibala et al., 2001). High concentrations of sucrose could promote the formation of microtubers in other species, including S. tuberosum (8% of sucrose). This positive effect was due to the ability of 8% sucrose to reduce endogenous gibberellins (Xu et al., 1998). Moreover, high sucrose concentrations can counteract the inhibitory effects of nitrogen on the formation of storage organs (Koda & Okazawa, 1983).
High sucrose concentrations may also have several negative effects caused by high osmotic potential (leading to the disruption of pH homeostasis and nutrient imbalance) (Khuri & Moorby, 1995; Oparka & Wright, 1988). However, in Curcuma spp., plants from the acclimatized plantlets grown in a medium with high sucrose content have higher yields and rhizome numbers than those grown in normal basal medium (Nayak & Naik, 2006).
We found that NAA had no apparent effect on the microrhizome growth. Moreover, 8 mg/L NAA was lethal to the white turmeric plantlets (Table 4). George et al. (2008) reported that high NAA concentrations could enhance ethylene synthesis. High ethylene content inhibits organ size regulation and elongation and causes leaf rot by preventing auxin translocation and increasing its degradation (Abeles et al., 1992; Bleecker et al., 1998; Burg, 1968). We also observed callus formation in plantlets grown in medium containing 4 or 6 mg/L NAA. This finding can be explained in the study of George et al. (2008). Specifically, NAA at concentrations of 0.01–1.0 mg/L promoted root formation. However, high NAA levels (above 1.0 mg/L) can stimulate callus formation and inhibit the rooting process (George et al., 2008). Compared to NAA, IBA had a stimulating effect on the growth of white turmeric microrhizomes. Similar results were reported by Thangavel et al. (2014) when the authors combined 2–6 µM IBA with 8 µM NAA, 0.05% YE, and 10% coconut water. The different impacts of NAA and IBA on C. aromaticamicrorhizome growth might be explained by the differences in their cellular transport. Specifically, NAA infiltrates plant cells mainly by diffusion, which is twice as fast as IBA transport by influx carriers (Delbarre et al., 1996; Strader & Bartel, 2011). The endogenous NAA concentration might be higher than that of IBA because of the high NAA permeability. Thus, the endogenous NAA content in our study might have exceeded the optimal range, causing insignificant changes in microrhizome growth (Table 4).
Successful ex vitro regeneration (germination rate: 83.33%) can only be achieved by using large (> 20 mm) microrhizomes. Smaller microrhizomes had longer germination times and lower survival rates (Table 10). This finding was supported by Shirgurkar et al. (2001), who also found that only C. longa plantlets regenerated from medium and large microrhizomes could grow rapidly and had a high survival rate. The low growth potential of small size microrhizomes can be attributed to dehydration under storage conditions, which decreases their survival rate (Ranalli et al., 1994). Large microrhizomes can grow strongly because of the higher proportion of meristematic cells and stored materials (Kabir et al., 2004; Wurr et al., 1993). Moreover, shootlets growing from large rhizomes and tubers have greater length and thickness, increased growth rate, and lowered cultivation duration (Michael et al., 2012).
. Conclusions
The MS medium supplemented with 8 g/L agar, 80 g/L sucrose, 11 µM AgNO3, and 0.5 mg/L YE was found to be the best for white turmeric microrhizome induction and growth. Furthermore, 0.5 mg/L YE was also the most suitable factor to promote the accumulation of curcumin in microrhizomes (curcumin content was higher than that of natural rhizomes).
Increased microrhizome size enhanced germination rate, shoot height, and reduced germination time. Microrhizome acclimatization was successfully achieved using microrhizomes with diameters of > 20 mm.
