Introduction
Plant feeding is considered an important part of 2030 Agenda for Sustainable Development, including 17 Sustainable Development Goals (SDGs). Farmers face the challenge of avoiding causing damage to the environment and producing agricultural products sustainably whilst maintaining high plant yields. The goal of nutrition management is to supply plants with suitable amounts of necessary nourishing materials during the growth season (Noreen et al.,2018). Foliar feeding is a common agricultural management practice used to increase plant growth and yield.
Foliar feeding with nutrients can improve the potential yield and physiological and morphological traits of crops such as rice (Oryza sativa L.). For example, Shaygany et al. (2012) used foliar application of nutrients during different growth stages of rice plants and reported significant increases in the number of panicles per square meter, 1,000-grain weight, biological yield, and grain yield in 2 crop years. The best results were found when foliar application of nutrients was conducted during different stages of transplanting, tillering, and panicle formation (Shaygany et al.,2012). Similarly, Sedghi and Sharifi (2012) demonstrated that supplemental foliar feeding significantly increased the grain yield of hybrid rice. In addition, Radhika et al. (2013) used foliar application of nutrients in rice, and reported that application of 1% foliar treatment three times a day for 15 days after transplanting resulted in increased tillering and panicle initiation, and higher numbers of tillers, panicles, reproductive tillers, and more grains per panicle. Arif et al. (2006) also demonstrated that foliar application of nutrients significantly affected rice plant traits, including panicle number per square meter, grain number per panicle, 1,000-grain weight, biological yield, and grain yield. Arif et al. (2006) reported that foliar application of nutrients during three stages (tillering + the first node + reproductive phase) resulted in the highest numbers of panicles per square meter, grain numbers per panicle, 1,000-seed weight, and biological yield. The highest grain yield was related to the foliar application treatment during two stages, namely the tillering + first node stages (Arif et al.,2006). Asadi et al. (2014) also reported that foliar application of nitrogen (N) and potassium (K) before flowering increased rough rice yield and biological yield, and that foliar application of N at the maximum tillering stage had the greatest effect on the number of tillers per hill and spikelets per panicle. The highest rate of reproductive tillers was also related to the foliar application of N at the maximum tillering and pod formation stages (Asadi et al.,2014). However, Joukar et al. (2016) found that the time of foliar nutrient application did not significantly affect yield, yield components, nor quality attributes of rice grains of the Tarom variety.
Usually, when plants are in an exponential growth period to reach their maximum size, leaves are able to absorb nutrients very efficiently. Therefore, determining the best time for foliar nutrient application can vary between different varieties of rice with different growth characteristics, and between varieties adapted to different climate conditions (Alexander,1985). Rice is an important and strategic crop in the northern part of Iran, and nutrition management is important in order to achieve sustainable rice cultivation practices and increase the efficiency of rice production in this area.
As foliar application of nutrients during different growing stages could have different effects on rice crops, the present study was conducted in order to determine the most suitable time for foliar nutrient application, with the aim of improving agronomical properties of the highly productive Sahel rice variety in Mazandaran Province, Iran.
Material and Methods
Experimental Design
In order to investigate the effects of foliar application of nutrients [N, phosphorus (P), K, iron (Fe), boron (B), zinc (Zn), manganese (Mn), and copper (Cu)] on yield and yield components of rice, an experiment was performed as a randomized complete block design (RCBD) with four biological replicates.
Experimental Site
The current study was performed during two crop years (2016 and 2017) at the Rice Research Institute of Iran. The Rice Research Institute is located in Amol City (latitude: 36° N, longitude: 52°3′ E) at 24 m above sea level. The soil at the experimental site was loamy-clay, with a pH of 7.7.
Plant Material
The rice variety used in this study was the Sahel variety, which was introduced to Iran in 2002 by the Rice Research Institute of Iran in Rasht.
Agronomic Operations
The first plowing operation was performed in midwinter of both years in order to aerate the soil and facilitate furrow operations, and the plots were kept fallow until sowing. Midwinter plowing before rice sowing is common in this area, and allows the soil to be exposed to the air and removes weeds in the soil through drying or freezing (Melikhov & Popov,2017). After bordering and leveling the nurseries and 72 hours before planting the seedlings, the herbicides butachlor (4 L/ha) and bensulfuron-methyl (75 g/ha) were used. After germination, seeding with 50–100 g of seed per square meter was performed in early April, and nurseries were covered with transparent nylon to prevent cold damage and accelerate the growth process. In the last 10 days of April, after growth of the seeds in the nurseries (four leaves unfolded; BBCH code: 14), the plastic cover was removed, and 2 kg of urea fertilizer was applied as topdressing. Until the emergence of cotyledons, rice seedling nutrition depends on endosperm storage, but, from this stage onwards, due to the expansion of the roots and the high nutritional needs of the seedlings, the absorption of nutrients from the roots begins. Since the density of seedlings in nurseries is usually high, the soil of the nursery must be very rich in nutrients. As such, it is necessary to use different fertilizers. Fertilizer was simultaneously applied to the main field, and 100 kg/ha of pure N from urea (one half applied before planting and one half applied after transplanting), 45 kg of P (from super phosphate triple), and 80 kg of K (from potassium sulphate) was added to the soil of the main field.
Transplanting was performed by hand on May 14, 2017 and May 21, 2018, with a density of 16 hills per square meter, and a distance of 25 cm between rows, in 5 × 5-m plots as single transplants. Each block had six plots, and each plot included 20 rows of planting with 25 cm between rows. The distance between the blocks was 2 m.
Weeding was performed twice by hand, at intervals of 20 and 30 days after transplanting. Agronomical management was performed in order to control pests and diseases at different growth stages. After observation of rice stem borer larvae, 10% diazinon granules were applied at 20 kg/ha.
Experimental Treatments
Experimental treatments consisted of foliar application of nutrients at different stages of plant growth. The chemical composition of the liquid fertilizer with concentrations of 1 per mille (1 per thousand) was as follows: N: 7%, P: 7%, K: 7%, Fe: 0.05%, B: 0.05%, Zn: 0.01%, Mn: 0.01%, and Cu: 0.01%. The different experimental treatments included: (A) foliar application of fertilizer in the midtillering stage (five tillers detectable; BBCH code: 25); (B) foliar application of fertilizer in the maximum tillering stage (end of tillering; BBCH code: 29); (C) foliar application of fertilizer in the panicle initiation stage (green ring stage; BBCH code: 30); (D) foliar application of fertilizer in the maximum tillering and panicle initiation stages (BBCH codes: 29 and 30); (E) foliar application of fertilizer in all three stages (BBCH codes: 25, 29, and 30); and (F) no foliar application of fertilizer, i.e., the control treatment (Lancashire et al.,1991). Liquid fertilizer was provided by the Rouyesh Now Institute, which is licensed by the Rice Research Institute of Iran. Foliar application of nutrients was performed at the end of the evening using a 20-L handy sprayer pump at a ratio of 1 per mille (1‰) in the experimental plots.
Evaluation of Agronomic Traits
We measured and analyzed the following rice plant traits: height (cm), number of tillers, number of filled grains per panicle, and 1,000-grain weight (g). These traits were measured using the standard evaluation system (SES) of rice (International Rice Research Institute,2002). Plant height was delineated by measuring the distance from the soil surface to the tip of the highest panicle of a hill. In order to measure leaf area index (cm2) and total dry weight (g), sampling was performed every 15 days from 30 days after planting for a total of six times, while plants at the edges of the plots were excluded. The leaf area index was determined using a leaf area meter (LI-31000, LI-COR; Lincoln, NE, U.S.) after leaves were detached from the plants. The amount of dry matter accumulation (g/plant) was measured after separating different parts of the plants and placing them in an electrical oven at 70 °C for 48 hours. In order to determine chlorophyll concentrations, a chlorophyll meter (SPAD-502; Minolta Camera, Japan) was used, and chlorophyll concentrations were measured at three points of perfectly developed leaves, with 10 plants measured in each experimental plot and measurements conducted at six different growth stages. Equation 1 and Equation 2 were applied in order to measure leaf area and the growth rates of rice plants, respectively (Hunt,1990); where LAI is leaf area index; LA1 and LA2 are leaf areas; GA is growing area per plant (m2); CGR is crop growth rate; W1 and W2 indicate dry matter weights per plant on investigation dates T1 and T2.
At the completely mature stage, an area of 2 m2 in each plot was harvested (rows and plants near the plot margins were not harvested), and rough rice was separated from the grain. After reducing the humidity of the rough rice to 11%, the final yield of each plot was computed and recorded separately.
Statistical Analysis
Statistical analysis was conducted using SAS software. To analyze the data, the results from each crop year were first analyzed separately, and subsequently the homogeneity of the variance of the mean of both crop years was evaluated using Bartlett’s test. Mean comparison of traits was performed by least significant difference (LSD) tests at the p < 0.05 probability level. Graphs were created using Sigma-plot software, version 11.
Results
Plant Height
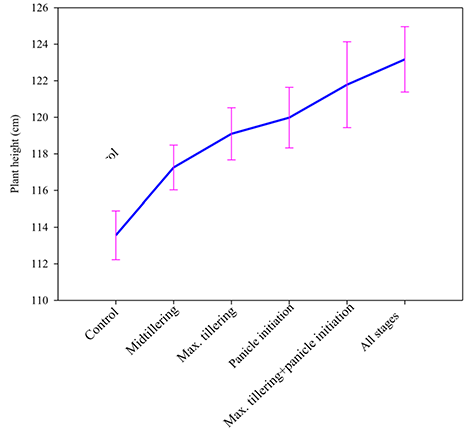
Foliar application of nutrients had a significant effect on the final height of the rice plants in both crop years (Table 1). Foliar application of nutrients in treatment E (foliar application of fertilizer at BBCH stages 25, 29, and 30) resulted in the greatest plant heights. The second greatest plant heights were achieved with Treatment D (foliar application of fertilizer at BBCH stages 29 and 30). The mean final height of plants in Treatments E and D were 7% and 5% greater than the mean final height of plants in the control treatment, respectively. Mean final heights of rice plants (117.25 cm) in Treatment A (foliar application of fertilizer at midtillering or BBCH 25) did not significantly differ from mean final heights of rice plants in the control treatment (113.55 cm) (Figure 1).
Table 1
Analysis of variance of some traits of the Sahel variety in foliar application treatments.
Number of Tillers per Plant
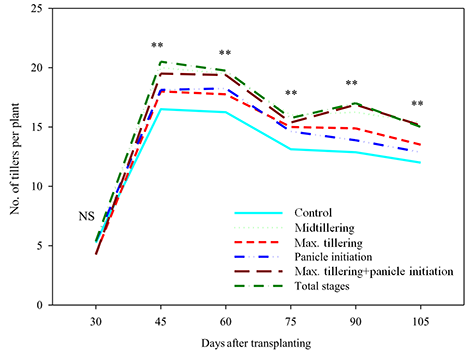
Foliar application of nutrients significantly affected the mean number of plant tillers during the 2 crop years, with the exception of 30 days after transplanting (Figure 2). Results indicate that the highest number of tillers 60 days after transplanting was recorded in Treatment E (foliar application of fertilizer at BBCH stages 25, 29, and 30). Plant tiller numbers in Treatment C (foliar application of fertilizer at panicle initiation or BBCH 30) were statistically significantly different from plant tiller numbers in Treatment F (control). Treatments D and E led to 19% and 21% more plant tillers in comparison with the control treatment (Figure 2). Ninety days after transplanting, foliar application of nutrients also had significant effects on the number of tillers per plant. Results indicate that in this stage, Treatments D and E resulted in the highest numbers of tillers per plant. Furthermore, Treatments C and F (the control treatment) resulted in the lowest plant tiller numbers, with means of 14.50 and 13.25, respectively. This trend continued 90 and 105 days after planting.
Chlorophyll Concentrations
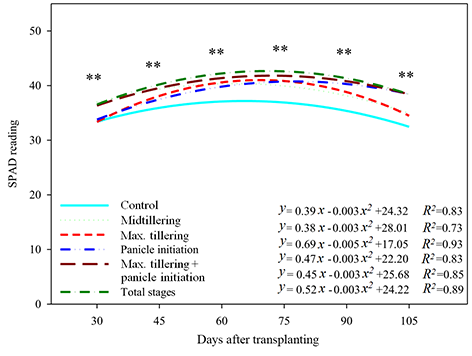
Foliar application of nutrients had significant effects on the mean chlorophyll concentrations in rice plant leaves in both crop years (Figure 3). Thirty days after transplanting, rice plants in Treatment A had the highest chlorophyll concentrations, and rice plants in the control treatment had the lowest chlorophyll concentrations. Treatments A and F significantly affected the chlorophyll concentrations of rice plants, a pattern which remained 45 days after transplanting. Forty-five days after transplanting, rice plants in Treatment A had the highest chlorophyll concentrations, and chlorophyll concentrations in plants in Treatments B and D were not significantly different from those of rice plants in the control treatment (Treatment F). Sixty days after transplanting, the highest chlorophyll concentrations were found in Treatments D and E (Figure 3), and there were no significant differences between these two treatments. However, treatments which involved foliar application of nutrients resulted in higher chlorophyll concentrations than the control treatment, and the differences were clearly statistically significant. At this stage, the mean chlorophyll concentrations in rice plants in Treatments D and E were 13% and 9% higher than in rice plants in the control treatment, respectively. Ninety days after transplanting, foliar application of nutrients also had significant effects on the leaf chlorophyll concentrations. Rice plants in all nutrient application treatments had higher leaf chlorophyll concentrations than rice plants in the control treatment, and the highest chlorophyll concentrations were found in Treatments D and E. Finally, 105 days after transplanting, the leaf chlorophyll concentrations differed significantly between all treatments (Figure 3). Results indicate that, at this stage, rice plants in Treatments D, B, and E had the highest leaf chlorophyll concentrations. Average leaf chlorophyll concentrations in Treatments D, B, and E were approximately 18% higher than in the control treatment. Generally, chlorophyll concentrations increased significantly during the early growth stage (30 days after planting), in Treatments A, E, and B in both crop years. Chlorophyll concentrations in rice plants in Treatments A, E, and B were 8%, 5%, and 4% higher than in rice plants in the control treatment, respectively. As the time since transplanting increased and plants reached the final stage of their growth, this trend remained.
Plant Dry Weight
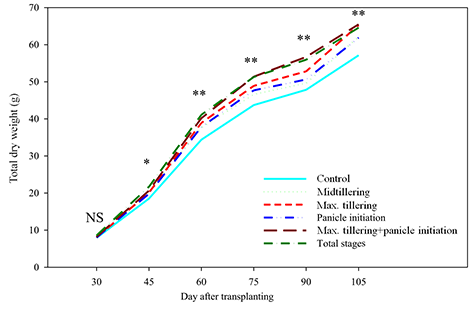
The interaction between foliar application of nutrients and crop year had a significant effect on the mean plant dry weight (with the exception of the stage of 30 days after transplanting) (Figure 4). Forty-five days after transplanting, plant dry weight was highest in Treatments D and E, and plant dry weights were 17% and 11% higher in Treatments D and E than in the control treatment, respectively. At this stage, plant dry weights in Treatments A, B, and C were not statistically significantly different from those in the control treatment. Sixty days after transplanting, the highest plant dry weights were recorded in Treatments E, D, and B, and the lowest dry weight was recorded in the control treatment (Treatment F). The dry weight of plants in Treatment E was 31% higher than that of plants in the control treatment, and this trend remained 75 days after transplanting. Seventy-five days after transplanting, plants in Treatments D and E had the highest dry weights, and plants in the control treatment and Treatment A had the lowest dry weights. There were no significant differences between the other treatments and the control treatment. Ninety days after transplanting, the highest dry weights were recorded in Treatments D and E, and the lowest dry weights were recorded in the control treatment and Treatment C. Finally, 105 days after transplanting, the highest dry weight was recorded in Treatments D, B, and E. Dry weights in Treatments D, B, and E were 14.5%, 14.2%, and 13.0% higher than in the control treatment, respectively (Figure 4).
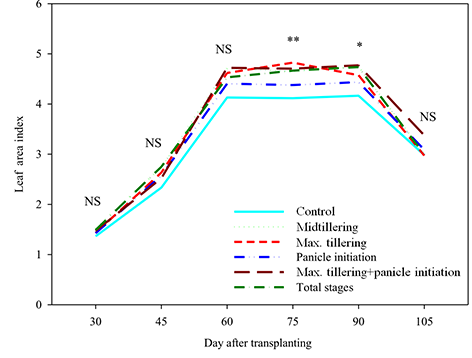
Leaf Area Index
Foliar application of nutrients had significant effects on the mean leaf area index in both crop years 75 and 90 days after transplanting (Figure 5). Seventy-five days after transplanting, the highest and lowest leaf area indices were recorded in Treatment B and the control treatment, respectively. The highest and lowest leaf area indices 90 days after planting were recorded in Treatment D and the control treatment, respectively.
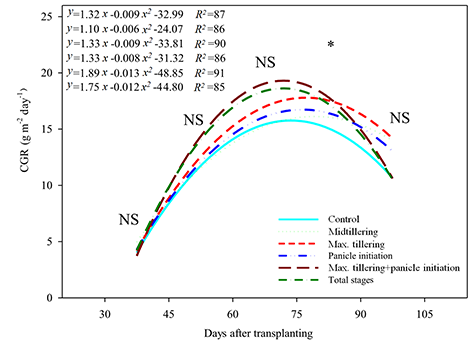
Crop Growth Rate
Foliar application of nutrients had significant effects on the mean rice growth rate in both crop years during the later growth stages (Figure 6). Between 75 and 90 days after transplanting, the highest crop growth rate was recorded in Treatments E and D, and the lowest crop growth rate was recorded in the control treatment. Crop growth rates in Treatments E and D were 23% and 22% higher than in the control treatment, respectively. Subsequently, foliar application of nutrients (mean: 19.22 g/m2/day) was conducted at the maximum tillering stage (B). Furthermore, treatments were applied during panicle initiation (C) and midtillering (A). However, our results indicate that 75–90 days after transplanting, the crop growth rate decreased when treatments were applied during maximum tillering + panicle initiation (D) and during all three stages (Treatment E) (Figure 6). The highest crop growth rate at this stage was recorded in Treatments A, B, and C, although there were no statistically significant differences among treatments of foliar application of nutrients at different vegetative growth stages. Differences in growth rates at maturity stages between treatments applied during midtillering and maximum tillering indicate that foliar application of nutrients during the vegetative stage resulted in less than 1% difference in the measured plant traits between the treatments, but when treatments were applied after panicle initiation, differences in plant traits between the different treatments exceeded 10%.
Number of Filled Grains per Panicle
Foliar application of nutrients had significant effects on the mean number of filled grains per panicle (Table 1). Foliar application of nutrients resulted in significantly higher numbers of filled grains per panicle. The highest and lowest numbers of filled grains per panicle were recorded in Treatments D and the control treatment, respectively. Foliar nutrient application resulted in filled grain numbers per particle that were 22.5% (Treatment D), 21.3% (Treatment B), and 21.2% (Treatment E) higher than in the control treatment (Table 2).
Table 2
Mean comparison of foliar application of nutrients on the traits of number of filled grains per panicle, 1,000-seed weight, and grain yield.
Thousand-Grain Weight
Foliar application of nutrients did not significantly affect the mean 1,000-grain weight. This result was found for both 2017 and 2018, and for the mean 1,000-grain weight of the two years combined (Table 1).
Grain Yield
Foliar application of nutrients had significant effects on mean grain yields in both crop years (Table 1). The highest and lowest grain yield were recorded for Treatments D and the control treatment, respectively. Treatments E and B resulted in the second and third highest mean grain yields.
Discussion
Generally, in rice plants vegetative growth is divided into two stages of active and delayed vegetative growth, which continue until panicle initiation (Smith & Hamel,1999). Some new higher yield rice varieties absorb only 25% of the total N and P, and 35%–45% of the total K, Ca, Mg, and S until the end of tillering. After this stage, accumulation of nutrients is intensified, and reaches a maximum 45–65 days after planting, such that the highest rate of N absorption in these varieties is observed 65 days after planting (Crusciol et al.,2016). Other researchers have also reported significant effects of foliar nutrient application on rice plant height (Deswal & Pandurangam,2018; Sultana et al.,2018). Shaygany et al. (2012) reported that foliar application of macro- and micronutrients at transplanting, tillering, and panicle initiation stages affected the number of tillers per rice plant. Increasing the number of tillers per plant by foliar application of nutrients has also been reported by other researchers (e.g., Farooq et al.,2018; Khursheed et al.,2018). As mentioned previously, determining the chlorophyll concentrations in leaves is considered an important index of plant yield, because chlorophyll is the key to photosynthesis, and there is a high correlation between chlorophyll concentrations and plant health. Previous studies demonstrated that foliar application of nutrients, in addition to significantly increasing the carbohydrate concentrations in the plant, can lead to increased biochemical activities in the leaf, as well as increasing concentrations of chlorophyll and carotenoids, which in turn is likely to improve the rate of photosynthesis (Singh et al.,2014; Zayed et al.,2011). Other researchers also found that the foliar application of nutrients increased chlorophyll concentrations in leaves (Deswal & Pandurangam,2018; Zayed et al.,2011).
In most rice varieties, 65%–70% of the total dry matter is accumulated during the 110–140-day growth period, and the remaining 30%–35% of dry matter accumulates after flowering (Smith & Hamel,1999). Therefore, it seems that foliar application of nutrients, and its effect on photosynthesis, plays an important role in increasing dry matter during the generative stage of the rice. Based on the results of this study, it seems that foliar application of nutrients at the end of the vegetative growth period is more effective in increasing dry matter of the Sahel rice variety than foliar application of nutrients during the early reproductive stages. Previous studies also found an increase in the amount of dry matter after the foliar application of nutrients (Khursheed et al.,2018; Mohan et al.,2017). It seems that some of the most important mechanisms behind increases in plant dry weight 75 and 90 days after transplanting are the increase in the leaf area index, as well as increases in carbohydrate concentrations. The leaf area index could also be increased through increasing the number of tillers per plant (Evans,1978). Previous studies also reported significant effects of foliar application of nutrients on leaf area indices (Deswal & Pandurangam,2018; Khursheed et al.,2018).
Treatments A, B, and C could be used to try to increase crop growth rates and convert more dry matter into grains. Similarly, Kumar et al. (2017) reported that the highest crop growth rate in rice resulted from foliar application of nutrients at the stages of tillering and panicle initiation as well as the milky stage. Furthermore, Hussain et al. (2012) reported that foliar application of nutrients significantly affected the leaf area index and crop growth rate of rice. The filling of the grain is necessary for producing high rice yields, and this is affected by the foliar application of nutrients at the time of panicle initiation. As such, the foliar application of nutrients can result in increased accumulation and transmission of nonstructural carbohydrates in stems and leaf pods, which increases activities of enzymes such as sucrose synthetase, and in turn increases the number of filled grains per panicle and the rate of grain formation and grain weight in rice plants (Silviya & Stalin,2017). Previous studies have also reported significant effects of foliar application of nutrients on the number of filled grains per panicle (e.g., Radhika et al.,2013; Zheng et al.,2010). It seems that the number of filled grains panicle, number of tillers per plant, and plant dry matter play an important role in determining the 1,000-grain weight of rice. Although we did not find significant differences in the mean 1,000-grain weights of rice plants in different treatments in our study, some previous studies reported significant effects of foliar nutrient application on 1,000-grain weight (Khursheed et al.,2018; Shaygany et al.,2012; Sultana et al.,2018). However, some other studies also did not find significant effects of foliar application of nutrients on 1,000-grain weight (Begum et al.,2003; Farooq et al.,2018).
In the 2 crop years, foliar application of nutrients at two stages (maximum tillering and panicle initiation) had the greatest effect on yield of the rough rice of the productive Sahel rice variety. Traits including the number of filled grains per panicle and the number of panicles per plant play important roles in improving yields in rice breeding programs (Kohnaki et al.,2013). Our results suggest that notable increases in grain yield and total dry weight of rice plants resulted in an 11% increase in grain yield compared with the control treatment. Generally, at the flowering stage of rice plants, the growth of vegetative parts decreases, and approximately 2 weeks before heading, a larger proportion of organic materials (including sugars and starch) accumulates in leaf pods and stems, with maximum values reached by the time of heading. After heading, carbohydrate concentrations decrease in the leaf pods and stems due to transport of carbohydrates to the panicles, and approximately 3 weeks later the concentrations of carbohydrates in the leaf pods and stems reach their minimum values. Therefore, after flowering, photosynthesis is very effective and is strongly correlated with grain yield (Smith & Hamel,1999). As such, it is important to note that 60–90 days after transplanting, especially during the canopy stage, rice plants accumulate carbohydrates. During this stage, rice plant growth rates increased in Treatments B (maximum tillering), C (panicle initiation), and E (all stages). Foliar application of macro- and micronutrients to plants of the Sahel rice variety, especially at the end of vegetative growth and during early generative growth, improves photosynthesis, accumulation of carbohydrates, and the transmission of dry matter to grains. Results of different studies in this field showed that the balanced application of nutrients during midgrowth and next stages may increase the proportion of reproductive tillers and the leaf area index after heading (Peng et al.,2007), improve accumulation and transmission of nonstructural carbohydrates (Zheng et al.,2010), prevent decreases in the number of spikelets (Zheng et al.,2010), and finally lead to increased grain yield (Singh et al.,2014). The amount of dry matter is critical to the grain yield, and the availability of sufficient dry matter is crucial to obtaining high grain yields (Song et al.,2013). Previous studies also reported significant effects of foliar application of nutrients on grain yields (Khursheed et al,2018; Singh et al.,2014; Sultana et al.,2018).
Conclusion
It is important to provide rice plants with sufficient available nutrients in order to avoid yield reduction. The nutrients should be easily available during the time of highest consumption and demand of the plant. This is especially important in new varieties of higher yield rice, because these varieties may have higher nutrient requirements than traditional varieties. We found that there were no significant differences when foliar application of nutrients treatments were applied during maximum tillering + panicle initiation and all stages, and found that regarding the yield, foliar application of nutrients during two vegetative and reproductive stages would be more efficient and cost-effective compared to foliar application during all three stages. Therefore, in this study we found that applying macro- and micronutrients at the stages of maximum tillering + panicle initiation had the greatest effect on physiological traits and yield components of rice of the Sahel variety. Providing rice plants with nutrients at the end of the vegetative growth stage improved photosynthesis, plant growth rates, and dry matter accumulation in rice of the Sahel variety under the climatic conditions of the Mazandaran Province of Iran.
Handling Editor
Barbara Hawrylak-Nowak; University of Life Sciences in Lublin, Poland; https://orcid.org/0000-0002-2935-1491
