. Introduction
The development of a community of segetal weeds is determined by habitat conditions, abundance of nutrients in soils, and agricultural measures (Albrecht & Pilgram, 1997; Andreasen et al., 2018; Bond & Grundy, 2001; Swanton et al., 2015). Different weed communities are formed on dry and nutrient-poor soils than on fertile and moist ones and also in crop rotation than in monoculture (Woźniak & Soroka, 2022). As proposed by MacLaren et al. (2020), various cropping systems and agricultural measures increase the diversity of the weed community and reduce their competitiveness against crops. In the experiment conducted in the crop rotation system by Woźniak and Soroka (2015) on nutrient-dense soil, the weed community was formed by species belonging mainly to the syntaxonomic classes Stellarietea mediae, Molinio-Arrhenatheretea, and Agropyretea intermedio-repentis.
The importance of weeds to agrosystems varies but they are usually competitive to crops, which in most instances leads to crop yield reduction (Jeschke, 2014; Marshall et al., 2003). According to Mahajan and Timsina (2011), nutrient-rich soil allows weeds to produce greater biomass, which makes them stronger competitors against crops. As reported by Oerke (2006), in uncontrolled conditions, weeds may cause even a 34% decline in the global yields of all crops. Weeds do not pose a large threat to crops in a multiple-species crop rotation but may be difficult to eradicate (even using herbicides) in the monoculture (Bourgeois et al., 2019; Weisberger et al., 2019). According to Mortensen et al. (2012), various cultivation systems and weed control methods deployed in crop rotation diminish weed competitiveness against crops. In turn, crop cultivation in the monoculture promotes the compensation of sparingly-controllable multiple weed species (Chauhan et al., 2012; Woźniak, 2023). In the study conducted by Woźniak and Soroka (2022), these were mainly Apera spica-venti and Avena fatua, i.e., weeds higher than wheat. As reported by Storkey (2006) and Gaba et al. (2017), these weeds are highly competitive to cereals.
The main sources of cultivable field infestation by weeds are their seeds deposited in the soil (Feledyn-Szewczyk et al., 2020; Franke et al., 2009). Their number depends on plant fertility, dispersal method, and agricultural practice, including plant succession in a crop rotation and tillage system (Andreasen & Stryhn, 2008; Legere et al., 2011). As reported by Storkey and Westbury (2007) and Smith et al. (2020), these weeds appear on fields due to natural processes of seed dispersal and dormancy, whereas the abundance of nutrients and limited biotic resistance of agrosystems promote their colonization by multiple weed species, including ruderal ones. Bagavathiannan and Norsworthy (2012) report that the falling of seeds onto soil is crucial to the field infestation; hence, it is necessary to eradicate weeds before they produce seeds. Seeds of many weed species ripe before crop harvest and are dispersed by wind. This holds true especially for the weeds heavily populating cereal monocultures or crops grown in the no-till systems (Feledyn-Szewczyk et al., 2020; Woźniak & Soroka, 2022). As reported by Hernández Plaza et al. (2015), the no-till system promotes weed species with fine seeds with high fertility, capable to germinate from the soil surface. Consequently, the no-till system promotes the quantitative preponderance of grassy weeds over dicotyledonous species. In turn, crops grown in the conventional tillage are most heavily infested by large-seeded weed species able to germinate from deeper soil layers. As a consequence, weed communities observed in the conventional tillage system are characterized by greater biological diversity than those in the no-till system, which leads to their lesser competitiveness against cultivated crops (Bitarafan & Andreasen, 2020; Zimdahl, 2004).
Based on a literature overview and agricultural practice, a hypothesis was formulated assuming that the cultivation of winter wheat in a 33–35-year monoculture may lead to the preponderance of a few weed species, best adapted to habitat conditions and agricultural practice. The predominance of these weeds may be counteracted by crop rotation including various groups of plants. Therefore, this study aimed to evaluate qualitative and quantitative changes in weed flora found in the crop rotation and in the 33–35-year winter wheat monoculture.
. Material and methods
. Experiment localization and scheme
A strict field experiment was established in 1988 at the Uhrusk Experimental Farm (51°18′N, 23°36′E) belonging to the University of Life Sciences in Lublin (south-eastern Poland). The results presented in the manuscript were collected in the years 2021–2023, i.e., in the 33rd–35th year of the experiment. The experimental scheme involved winter wheat cultivation in crop rotation and monoculture. The plant sequence in the crop rotation was as follows: potato (Solanum tuberosum) – winter wheat (Triticum aestivum) – common peas (Pisum sativum) – winter durum wheat (Triticum durum). Winter wheat and the other crops were sown on 25 × 6 m plots, in 3 replications, in the randomized block system.
Winter wheat of ‘Bilanz’ cultivar was grown in the conventional tillage system. The agricultural measures applied in the crop rotation system after the harvest of the previous crop, i.e., potatoes, included harrowing and a cultivation unit consisting of a cultivator and a string roller. In the monoculture, shallow ploughing (at a depth of 10 cm) was performed after wheat harvest and pre-sowing ploughing (at a depth of 18 cm) with harrowing in the 3rd week of September. Winter wheat was sown in the first week of October, at the sowing density of 380 seeds per m2. Before sowing, the soil was fertilized with 150 kg N ha−1, 30 kg P ha−1, and 85 kg K ha−1. The phosphorus and potassium fertilizers were applied prior to wheat sowing, whereas the nitrogen ones were administered prior to sowing – 20 kg N ha−1, and in the springtime: at the tillering stage – 70 kg N ha−1, at the shooting stage – 40 kg N ha−1, and at the ear formation stage – 20 kg N ha−1. Weed control entailed harrowing stands in the springtime at the wheat tillering stage and 7 days later.
. Soil and weather conditions
The Uhrusk Experimental Farm is located in the eastern part of Lubelskie Province, in the macroregion of Polesie Wołyńskie and the mesoregion of Pagóry Chełmskie (Kondracki, 2009). This area is characterized by great diversity in terms of soil cover and hydrological conditions (Dobrzański & Borowiec, 1961). The experiment was established on a field located at 170 m a.s.l. The soil at the farm is classified as Rendzic Phaeozem (IUSS Working Group WRB, 2015), with the following mineral composition: 52% of sand, 25% of dust, and 23% of loam, and has slightly alkaline pH (pHKCl = 7.1). It has high contents of available forms of phosphorus (194 mg P kg −1) and potassium (202 mg K kg−1) and an average content of magnesium (70 mg mg kg−1). The total nitrogen content of the soil is 0.80 g N kg−1 and that of organic carbon is 12.4 g C kg−1.
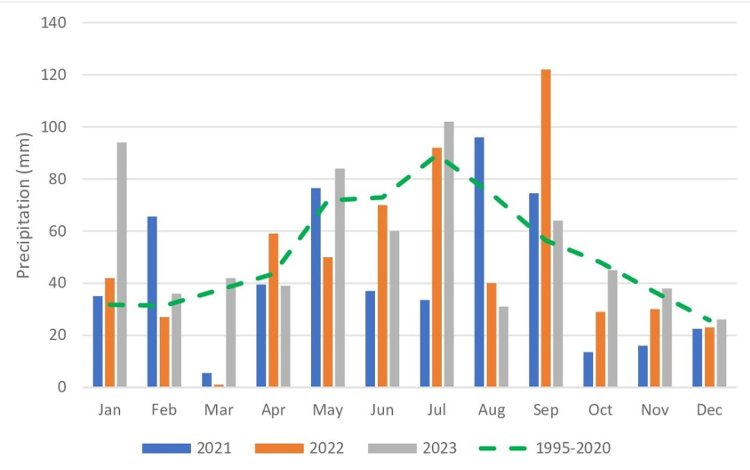
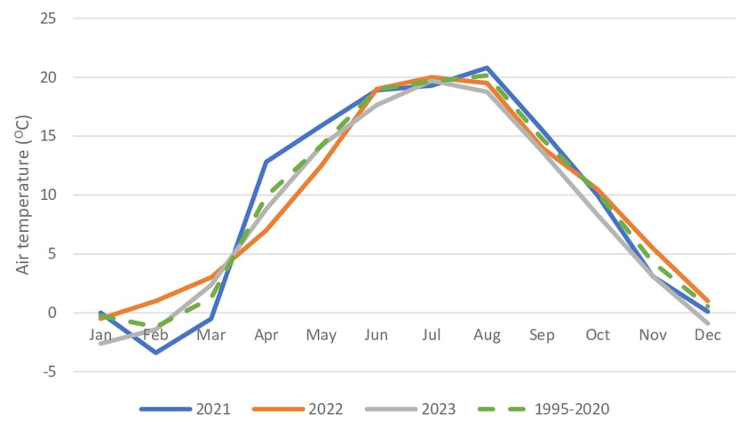
The growing season (period with the average daily air temperature over +5 °C) spans 210–215 days and begins at the end of March. The annual sum of atmospheric precipitation recorded over the study years ranged from 515 mm to 661 mm, with the majority of precipitation observed in the spring and summer months, i.e., from April to September, ranging from 357 mm to 433 mm, respectively (Figure 1). The highest air temperatures were recorded in the summer months: June, July, and August, whereas the lowest ones – in the winter months, i.e., December, January, and February (Figure 2).
. Production traits and statistical analysis
The experiment aimed to assess: (1) the number and air-dry weight of weeds at the tillering (22–23 in the BBCH scale) and milk maturity (73–75 BBCH) stages of winter wheat (Meier, 2018); (2) species composition of weeds at the wheat tillering and milk maturity stages; (3) horizontal (layered) distribution of weeds in the wheat canopy at the milk maturity stage; (4) Shannon–Wiener’s biodiversity index (H′) at the wheat tillering and milk maturity stages; and (5) Sørensen’s similarity coefficient (S) of weed communities in the crop rotation and monoculture at the wheat tillering and milk maturity stages.
The number of weeds, weed species composition, and air-dry weight of weeds were evaluated on a 1 m2 area randomly selected from each plot. In turn, the assessment of the air-dry weight of weeds consisted in collecting weeds from the specified areas, placing their aerial parts on open-work shelves in a well-ventilated and dry room till they reached constant weight.
The assessment of the horizontal (layered) distribution of weeds in the wheat canopy was carried out according to the following criteria: (1) the upper level – populated by weeds higher than wheat; (2) the middle level – including weeds reaching the full height of wheat; (3) the lower level – constituted by weeds reaching half the wheat height; and (4) the ground level – populated by creeping weeds reaching a few centimeters in height.
The Shannon–Wiener’s biodiversity index of weeds in the crop rotation and monoculture was computed according to the following formula:
Results obtained were subjected to the analysis of variance (ANOVA), whereas the significance of differences between mean values for crop succession (cropping system) and study years and their interactions was determined with the Tukey’s HSD test, P < 0.05.
. Results
. Number and air-dry weight of weeds
At the tillering stage of winter wheat, the weed density per m2 was almost 3-fold greater in the monoculture than in the crop rotation (Table 1). A higher number of weeds was also determined in 2023, compared to the other study years. Likewise, the air-dry weight of weeds was higher in the monoculture than in the crop rotation, as well as in 2023 than in the other study years. At the milk maturity stage of winter wheat, the number of weeds was comparable in the monoculture and crop rotation, whereas their air-dry weight was over 2-fold higher in the monoculture than in the crop rotation (Table 2). Also, more weeds were recorded on the plots in 2021 than in the other study years, whereas the highest weed weight was determined in 2021 and 2023.
Table 1
Number and air-dry weight of weeds per m2 in the tillering stage of winter wheat.
Table 2
Number and air-dry weight of weeds per m2 in the milk maturity stage of winter wheat.
The variance analysis components allow concluding that, at the winter wheat tillering stage, the number and air-dry weight of weeds were affected to a greater extent by the cropping system than by the study years (Table 3). In turn, at the milk maturity stage of winter wheat, the number of weeds depended only on the study years, whereas their air-dry weight was mainly affected by the cropping system.
Table 3
Variance analysis for the number and air-dry weight of weeds.
. Species composition of weeds
At the tillering stage of winter wheat, the plots were infested by 9 to 11 weed species in both the crop rotation and monoculture systems (Table 4). In 2021, the most abundant weeds identified on the crop rotation plots included Consolida regalis, Capsella bursa-pastoris, Papaver rhoeas, and Veronica persica; in 2022, the most abundant were Stellaria media, Apera spica-venti, C. regalis, and C. bursa-pastoris, whereas in 2023 they included C. regalis, Galeopsis tetrahit, S. media, and C. bursa-pastoris. The prevailing weed species identified in the monoculture plots included A. spica-venti, C. regalis, Matricaria perforata, and P. rhoeas in 2021, A. spica-venti, Galium aparine, C. regalis, and V. persica in 2022, and A. spica-venti, Lamium purpureum, C. regalis, and P. rhoeas in 2023 (Table 5).
Table 4
Species composition of weeds at the tillering stage of winter wheat development in crop rotation.
Table 5
Species composition of weeds at the tillering stage of winter wheat development in monoculture.
At the milk maturity stage of wheat, its plots were infested by 12 to 14 weed species (Table 6). In 2021, the most abundant weed species turned out to be Avena fatua, A. spica-venti, L. purpureum, and G. aparine; in 2022, these were A. fatua, A. spica-venti, V. persica, and P. rhoeas, whereas the prevailing weed species noted in 2023 included A. spica-venti, A. fatua, Fallopia convolvulus, and P. rhoeas. In the wheat monoculture, the plots were populated by 8 to 11 weed species (Table 7). In 2021, the most abundant of these turned out to be A. spica-venti, A. fatua, Centaurea cyanus, and Cirsium arvense; in 2022, these were A. spica-venti, A. fatua, C. regalis, and G. aparine, whereas the most abundant species identified in 2023 included A. spica-venti, A. fatua, C. arvensis, and C. cyanus.
Table 6
Species composition of weeds at the milk maturity stage of winter wheat development in crop rotation.
Table 7
Species composition of weeds at the milk maturity stage of winter wheat development in monoculture.
. Horizontal distribution of weeds in winter wheat canopy
At the milk maturity stage of winter wheat, the weeds of the upper and middle levels represented from 82% to 92.3% of the weed community in the crop rotation and from 98.5% to 100 of the weed community in the monoculture (Table 8).
Table 8
Percentage contribution of weeds in particular levels at the milk stage of winter wheat.
. Weed infestation indices
At the tillering stage of winter wheat, a higher value of the Shannon–Wiener’s diversity index was computed for the weed community in the crop rotation compared to that in the monoculture (Table 9). Also, greater diversity was recorded for the weed community in 2023 than for those from the other study years. Likewise, at the milk maturity stage of winter wheat, a higher value of the Shannon–Wiener’s diversity index was determined for the weed community from the crop rotation than from the monoculture and also for the weed community from 2021 than from 2022. The variance analysis components indicate that the Shannon–Wiener’s diversity index of weeds was affected to a greater extent by the cropping system than by the study years at both developmental stages of wheat compared (Table 10).
Table 9
Shannon–Wiener’s (H′) diversity index computed for weeds of winter wheat.
Table 10
Variance analysis for Shannon–Wiener’s (H′) diversity index for weeds.
| Specification | Value | CSa | Yb | CS × Y |
|---|---|---|---|---|
| Tillering stage of wheat | F | 23.01 | 7.77 | 2.39 |
| p | ** | ** | ns | |
| Milk maturity stage of wheat | F | 197.6 | 4.05 | 1.08 |
| p | ** | * | ns |
The Sørensen’s coefficient of weed community similarity reached 70–76% at the tillering stage and 68–78% at the milk maturity stage of winter wheat (Table 11).
. Discussion
The weed infestation of agroecosystems is the resultant of agronomic conditions, agrotechnical measures applied and biological characteristics of weeds, including seed production and methods of their dispersal (Davis et al., 2005; Feledyn-Szewczyk et al., 2020; Hernández Plaza et al., 2015). Minimized tillage and cereal monocultures are the underlying causes of fields being predominated by several weed species that are difficult to control (Garnier & Navas, 2012; Neve et al., 2009). Also in the present study, a few weed species of the upper and middle levels of the wheat canopy accounted for 98.5% to 100% of the weed community in the monoculture. Storkey (2006) and Gaba et al. (2017) have shown that weeds higher than cereals are more competitive to them. As reported by Marshall et al. (2003), weeds exhibiting a high growth rate have a huge competitive potential against cereals. In turn, Fried et al. (2009) and Perronne et al. (2015) have demonstrated that the agronomic conditions promoting crop performance promote also weeds having the same phenology and nutritional demands. In turn, a study conducted by Finn et al. (2013) has shown that the diversity of crop species and forms in the crop rotation may minimize weed competitiveness against them. Also, Clements et al. (1994) have proved that crop rotation reduces weed abundance and promotes their diversity by modifying the conditions of tillage, fertilization, and plant protection accordingly to the target crop. Also in the present study, the crop rotation was observed to cause a 2–3-fold reduction in the number and air-dry weight of weeds, compared to the monoculture. The number of weed species identified in the monoculture was lower than of those found in the crop rotation; however, the monoculture was characterized by a greater prevalence of grassy weeds (A. spica-venti and A. fatua) over the other weed species. Weed abundance in the monoculture can only be reduced by means of herbicides; however, as evidenced by Mohler (2001), the frequent use of herbicides may modify the composition of a weed community towards species resistant to the herbicide’s active substance. According to Hicks et al. (2018), weeds may develop resistance to herbicides within a short time span. As reported by Heap (2024), 273 weed species identified across the globe have been found resistant to herbicides, and 21 out of 31 known mechanisms of their action have been confirmed.
The diversity of weed species and the variety of cropping systems applied diminish the competitiveness of weeds against crops (MacLaren et al., 2020). Also in the present study, the Shannon–Wiener’s diversity index was significantly higher in the wheat canopy from the crop rotation than from the monoculture. In turn, the similarity of the weed communities assessed in the crop rotation and monoculture based on the Sørensen’s coefficient ranged from 70% to 76% at the tillering stage and from 68% to 78% at the milk maturity stage of winter wheat. The remaining part of the weed community included little abundant species or those appearing sporadically. These included Fumaria officinalis, Centaurea cyanus, Lamium purpureum, and Viola arvensis at the tillering stage and Cirsium arvense, Elymus repens, Galeopsis tetrahit, and Polygonum lapathifolium at the milk maturity stage. Many of these species are specific to the weed community found in root plants, which served as the previous crop for wheat in the present study. As reported by Woźniak (2023), the alternating cultivation of spring and winter crops effectively modifies the species composition of weeds and reduces their abundance in the canopy as well as counteracts the compensation of troublesome species.
. Conclusions
At the tillering and milk maturity stages of winter wheat, an almost 3-fold higher number of weeds was recorded in the monoculture than in the crop rotation. Also, the air-dry weight of weeds was higher in the monoculture than in the crop rotation at both developmental stages compared. At the milk maturity stage of winter wheat, the weeds of the upper and middle levels accounted for 82–92.3% of the weed community in the crop rotation and for 98.5–100% in the monoculture. A higher value of the Shannon–Wiener’s biodiversity index was computed for the weed community from the crop rotation than from the monoculture. In turn, the Sørensen’s coefficient of similarity computed for weed communities reached 70–76% at the tillering stage and 68–78% at the milk maturity stage.
