Introduction
In Ecuador, cacao (Theobroma cacao L.) is one of the primary sources of economic income for the agricultural and agribusiness sectors. The national variety (Forastero) is the most commonly cultivated in Ecuador and has high prestige in international markets due to its organoleptic benefits (Loor et al.,2009; Solorzano et al.,2012). Fine aroma cocoa accounts for only 6% of the world production. However, Latin America produces 80% of this total, with Ecuador contributing 54%, making it the largest producer of cocoa in the world (Acebo,2016).
Over time, the performance of T. cacao national type has decreased, which is thought to be caused by genetic and environmental factors (Quiroz & Amores,2002). The productive capacity of T. cacao will depend on the reproductive efficiency of forming fruits, flowers, pollen, and egg cells, which can be genotype specific (Mena & García,2014). Likewise, a higher quantity of pollen grains allows a more efficient dispersion and as a result, a more significant number of fertilized ovules, which commercially represent an increase in the seeds per fruit (Adjaloo & Oduro,2013). Similarly, the processes of formation and germination of pollen grains also depend on environmental variables such as photoperiod, irradiation, precipitation, temperature, and relative humidity (García-Cruzatty,2014).
Theobroma cacao has been considered a cauliflorous species because the flowers are born directly from the branches, and the time in which a floral button emerges until it opens is approximately 30 days. This process is directly influenced by environmental factors (Pinargote,2015).
The current scientific literature does not report data on the production of pollen in T. cacao, despite the socioeconomic importance of the species. Therefore, our research aimed to study the pollen production in genotypes of T. cacao national type and CCN-51. We focused on the relationship between pollen production and the main environmental factors. This knowledge is essential in the establishment of conservation plans and genetic improvement of the species, especially in national genotypes.
Material and Methods
Study Site and Parameters
The study was carried out in 2017 and 2018 using genotypes of Theobroma cacao L. located at the experimental center “La Teodomira” (01°20′25″ south latitude, and 80°23′14″ west longitude, at an altitude of 60 m a.s.l.) owned by the Faculty of Agronomic Engineering, Universidad Técnica de Manabí, Ecuador. According to the Holdridge (1947) classification, the area corresponds to the ecological formation of a dry-tropical forest. The following weather conditions were analyzed: precipitation (mm), air temperature (°C), and relative humidity (%). High precipitation (e.g., 284.7 mm) was observed in February. The months of August, September, and November were the driest. In March and April, the highest air temperature of 26.9 °C was recorded and the highest relative humidity was noted in February (84.0%). The meteorological condition characteristics during the study months are shown in Table 1.
Table 1
Environmental variables of the experimental farm “La Teodomira,” Ecuador, average from 2017 and 2018.
Vegetal Material
Eleven genotypes of T. cacao national type and one of the Trinitarian type were assessed. The national genotypes corresponded to the CCAT collection (Center for Fine Cocoa and Aroma Tenguel) and are coded as follows: L11-H19, L21-H38, L21-H43, L26-H64, L29-H04, L46-H57, L46-H75, L46-H88, ETT-103, L18-H58, L49-H98, and CCN-51 (Trinitarian).
Pollen Production
The total number of pollen grains per flower was estimated by direct counting using the methodology of García et al. (2015): n = 10 flower buds (preanthesis) were randomly collected at 1.50 m of plant height (middle stratum) from 12 genotypes (n = 3 trees per clone) for 12 consecutive months. The flower buds were collected once a month. The flower buds were preserved in FAA (formaldehyde, alcohol, acetic acid) at 4 °C until use. In T. cacao, all genotypes have five flower anthers, which were placed in test tubes containing 200 µL of suspension solution (distilled water, 100 µL; methyl blue, 75 µL; glycerin, 25 µL). Then, the anthers were macerated with a glass rod and 1 µL of the suspension was placed into the slots of a Neubauer chamber (Marienfeld, model 0610130) for counting using an optical microscope (Motic, model BA4103). Finally, the number of pollen grains per anther (GPA) was determined using the formula below, and this value was multiplied by the total number of anthers from each flower.
Experimental Design and Statistical Analysis
For the analysis of the determining components, the levels of the genotype factor and the month factor were ordered in a factorial manner and distributed in a completely randomized design with four repetitions per flower (10 flowers per branch). The significance of the factors and their interaction was established using analysis of variance (ANOVA). The comparison of the means for pollen production between clones and months was made with Tukey’s HSD test at 5% significance level. Prior to these analyses, the normality and homoscedasticity were tested. The significance of the relationship between the determinants of pollen production was assessed by regression analysis and coefficient of correlation (r) and Pearson’s critical value at a 0.01 level of error. A regression analysis was conducted between the number of pollen grains per flower and the meteorological conditions, temperature, and precipitation. For these analyses, Statistica 7.0 software (Statsoft, Tulsa OK) was used.
Results
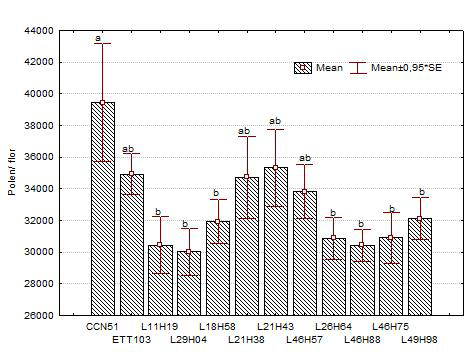
In Figure 1, the mean number of pollen grains produced per flower in 12 clones of T. cacao L. is shown. The (CV: 21.45) genotype group showed a mean of 32,914 ± 2,814 pollen grains per flower. Statistical difference between genotypes was verified (p = 0.0248), with CCN-51 being the genotype that produced the most pollen per flower (39,445 ± 13,549), followed by genotype L21-H43 (35,329 ± 8,875). In contrast, genotypes L29-H04 and L46-H88 produced the lowest amount of pollen (30,017 ± 5,470 and 30,444 ± 3,652, respectively (Figure 1).
Figure 1
Number of pollen grains per flower in 12 clones of Theobroma cacao L. The letters indicate means that are significantly different from one another according to the Tukey’s test at 5% error probability. Vertical bars represent the standard deviation of the mean value.
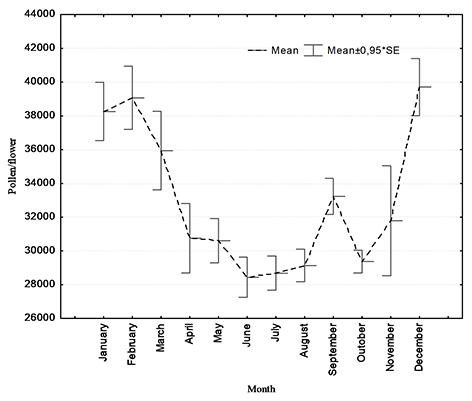
The monthly production of pollen in T. cacao differed across growing season (Figure 2). The highest pollen production was measured in December, January, February, and March, which corresponded to the rainy season. For example, in December 40,606 ± 2,892 pollen grains per flower was estimated, while in the drier months of June and July, the pollen production was low, 28,440 ± 558 and 28,673 ± 503 pollen grains per flower, respectively.
Figure 2
Average monthly production of pollen per flower in Theobroma cacao L. from Santa Ana, Manabí, Ecuador. The error bars indicate standard deviation of the mean value.
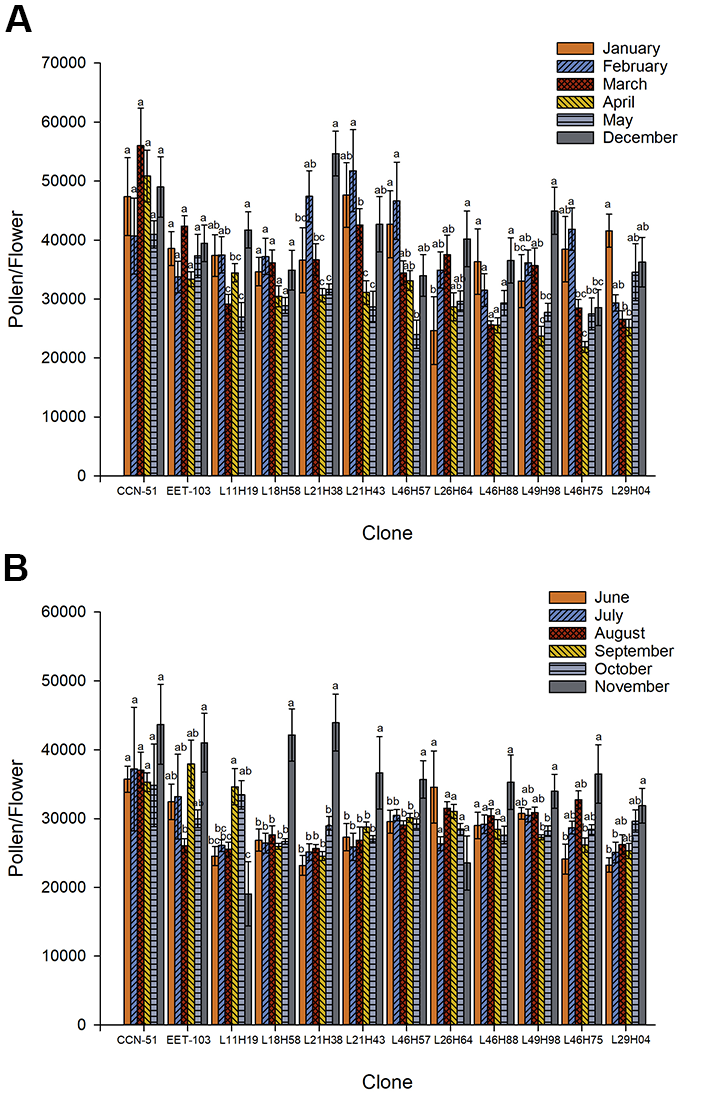
The monthly pollen production for each T. cacao clone studied across two seasons is presented in Figure 3A,B. The rainy season started in December 2017 and ran from January to May 2018; the dry season ran from June to November 2018. In the CCN-51 clone, a higher amount of pollen was observed in March (56,015) than in February (40,681); however, no significant differences (p = 0.28) were found during the months evaluated. In the ETT-103 clone, a tendency for higher production of pollen was reported in March (42,398.99) than in April (33,358); however, the difference between these measurements was not found to be significant (p = 0.14). For the clone L11-H19 (p = 0.0001), the differences in pollen production were found between the growing seasons; in December, higher amount of pollen (43,792) was found than in March, April, and May. In L18-H58, no differences were found in pollen production (p = 0.18), while clone L21-H38 produced more pollen per flower in December (56,949) than in January, March, April, and May (p = <0.0001). For the clone L21-H43, more pollen was produced in February (51,777) than in March, April, and May (p = 0.0011). In the L46-H57 clone, the highest amount of pollen was produced in February and January (46,651 and 42,686), which was significantly different (p = 0.009) from that produced in May. In the clone L26-H64, the highest number of pollen grains was produced in December (40,213), which was significantly higher (p = 0.037) than the amount of pollen produced for January (24,656). In the L46-H88 clone, no differences were observed (p = 0.06) in pollen production across the different growing seasons. The clone L49-H98 showed significant differences (p = 0.0001) in pollen production between December (44,966) and January, April, and May. In the clone L46-H75, a significant difference (p = <0.0001) was found between the pollen production in February (41,858) and the other months, except January. In L29-H04, there was a significant (p = 0.002) statistical difference in the pollen production across seasons, with the highest amount of pollen produced in January (41,606) compared to that produced in March and April (Figure 3A).
Figure 3B illustrates the analysis of pollen production across the dry season. In the CCN-51 clones (p = 0.27), L26-H64 (p = 0.075) and L46-H88 (p = 0.12), no significant differences were found in the pollen produced by flowers. However, we noted a trend for high pollen production in CCN-51 and L46-H88 in November (43,685 and 35,292, respectively) and for L26-H64 in June (34,580). In clone ETT-103 (p = 0.04), high pollen production occurred in November (41,015) and was different only from the mean pollen production in August. For the clone L11-H19, significant effects (p = 0.0002) were also found. The pollen production value recorded in September (34,646) differed from that for June, July, August, and November. In clones L18-H58 (p = <0.0001), L21-H38 (p = <0.0001), L21-H43 (p = <0.01), and L46-H57 (p = 0.02), significant differences were found between wet and dry seasons; the highest pollen production was recorded in November (42,151, 43,934, 36,651, and 35,696, respectively). Differences were also found between the evaluated months (p = 0.008) for clone L49-H98; in November, the amount of produced pollen was higher (33,974) than that in October and September. In the L46-H75 clone (p = 0.002), more pollen production was found in November (36,489) than in September and June. For clone L29-H04 (p = 0.004), greater effects on pollen yield were observed in November (31,883) than in June and July. In general, these results indicated that the clones exhibited different behaviors during the studied months, some produced more pollen than others, and this production increased in the rainy season than in the dry season.
Figure 3
Monthly pollen production per flower in studied clones of Theobroma cacao L. from Santa Ana, Manabí, Ecuador during (A) the rainy and (B) dry seasons. The letters indicate means that are statistically different according to the Tukey’s test at 5% error probability. Vertical bars represent the mean value ± standard deviation.
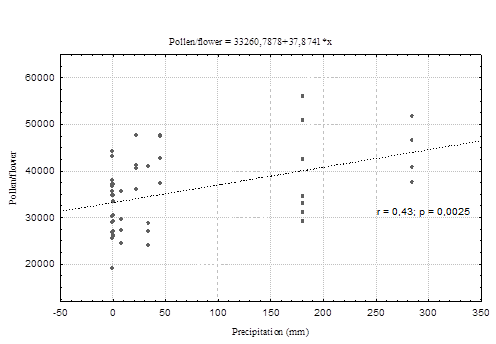
There was a moderate positive correlation between monthly precipitation and pollen production per flower (r = 0.43). Our results showed a higher production of pollen grains per flower in the months where the highest rainfall was recorded. Likewise, in the months where there was no rainfall on record, pollen production was lower (Figure 4).
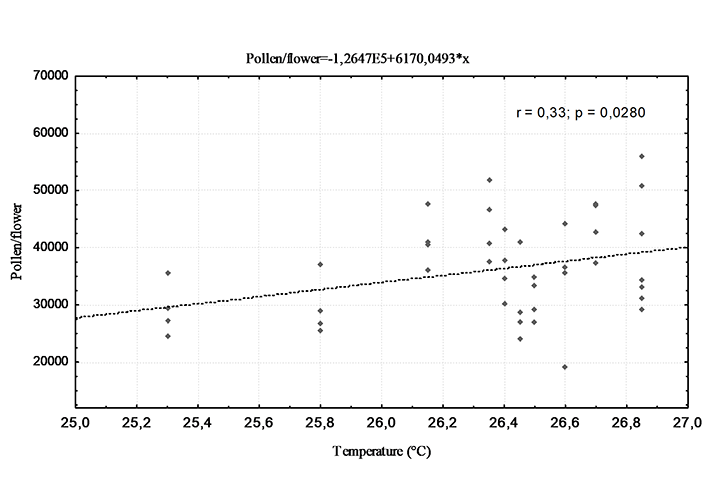
The mean air temperature affected the pollen production in the T. cacao clones tested in this study. There was a positive correlation between the variables of average monthly air temperature and pollen production per flower (r = 0.33), where higher pollen production was noted during the months with a higher air temperature than in months with lower recorded air temperature (Figure 5).
Discussion
Theobroma cacao produces between 26,000 and 44,000 pollen grains per flower, varying between genotypes, an amount that is in the range for Salmalia malabarica Sch. and Endl, entomophilic species of the Malvaceae family, which produces approximately 42,000 pollen grains per flower (Reddi & Reddi,1986). Higher amounts of pollen produced per flower were reported for Malva higher (Malvaceae; 6,586 pollen grains) (Hidalgo et al.,1996). The variation in pollen production per flower have been reported in different plant species (Fernández et al.,2008), even in species belonging to the same family, where extreme changes can affect male reproduction variables (García-Cruzatty et al.,2017). In fact, while the amount of pollen produced in flowers is a genetically determined characteristic (Antoń & Denisow,2018; Denisow et al.,2018), it has been frequently documented that this characteristic can vary significantly between species and between cultivars or varieties (Antoń & Denisow,2018).
Alonso et al. (2013) reported that pollen production is not a constant character and strongly depends on environmental conditions and can vary significantly between individuals of the same species and across growing seasons. Likewise, in Oenothera spp., the flowering degree of an individual is strongly influenced by the availability of nutrients in the soil and other environmental conditions, which can influence pollen production per flower, individual or population (Antoń & Denisow,2018). In particular, the exposure duration of a plant to low temperatures or drought stress can impact its pollen production (Antoń & Denisow,2018; Denisow et al.,2018).
The biology of cacao mainly responds to climatic events such as rain and air temperature, similar to other plant species (Lesica & Kittelson,2010). Meteorological conditions play an essential role in the production of pollen in T. cacao and are directly related to the variety of the phenological states and reproductive functions of the species (Dubón,2015; Torres-Gutiérrez,2012; Vargas et al.,2005; Vera-Chang et al.,2016). Based on research conducted in Ecuador, there is a positive relationship between the deposition of pollen to stigmas and climatic variables such as maximum air temperature (r = 0.46), precipitation (r = 0.33), relative humidity (r = 0.27), and wind speed (r = 0.29) (Mena-Montoya et al.,2020). Differences in pollen production between growing seasons have frequently been reported for some plant species, which would be related to differences in climatic conditions. Low air temperatures and a deficit in precipitation considerably decrease the amount of pollen produced in flowers (Bożek,2019), corroborating in the present investigation with the cocoa crop, since in the months when there was less presence of rainfall, it was at the time that there was less production of pollen.
The results of this investigation determined that the monthly production of pollen grains was higher in the months with high air temperature. The production of flowers per tree and pollen grains per flower are directly related to the number of fruits, which is consistent with a study conducted in Ghana that showed a strong correlation (r = 0.63) between air temperature and yield in T. cacao (Adjaloo & Oduro,2013). Likewise, the amount of pollen that reaches the stigmas could be related to pollen production, which in turn is correlated with maximum air temperature (Mena-Montoya et al.,2020). Air temperature is the main factor that affects the development of the plant, with pollination being one of the phenological stages most sensitive to extreme temperatures. In controlled environment studies, warm temperatures increased the rate of phenological development with a more significant impact during the reproductive stage. The effect of air temperature is usually strengthened by water deficits or excess soil water, demonstrating that understanding the interaction between temperature and soil water status is necessary to develop strategies for maintaining pollen production when temperature increases, which is associated with a climate change (Menzel & Sparks,2006).
In Ecuador, during the months with higher air temperature, there was also more rainfall (e.g., December, January, February, March, April). According to Torres-Gutiérrez (2012), adequate water supply is essential for the metabolic processes in T. cacao because precipitation is a main factor that affects the reproduction and fruit production of the species (Torres-Gutiérrez,2012; Vargas et al.,2005). Generally, the reproductive processes of plant species are run by a series of specialized structures that fulfill specific functions (Shaw et al.,1988). For example, the filament plays an essential role in the transportation of water and nutrients to the anther (Shaw et al.,1988) and proteins that protect the complex pollen wall system against dehydration (Schwacke et al.,1999). The availability of water in the soil enhances the efficient production of viable pollen grains and helps in their dispersion (Shaw et al.,1988). Understanding the relationship between precipitation and the formation of pollen grains per flower in T. cacao is necessary for efficient crop production.
Conclusions
For the first time, the production of pollen in T. cacao national and CCN-51 varieties has been reported. The Trinitarian clone (CCN-51) produces more pollen than the national (Outsider) genotypes; however, the national genotypes produce similar amounts of pollen. Genotypes of T. cacao national and CCN-51 can be used in breeding programs because pollen production is an essential indicator for selecting promising genotypes for cultivation. In the rainy season, there was a greater production of pollen because the higher temperature and precipitation during this season determine the production of pollen.
Handling Editor
Bożena Denisow; University of Life Sciences in Lublin, Poland; https://orcid.org/0000-0001-6718-7496
Authors’ Contributions
LVP, AZM, and JCO conducted field and laboratory work, gathered and analyzed data, and contributed to writing and discussion of the manuscript; LCGC conducted fieldwork, contributed with the discussion of the manuscript, and supervised the study; FZG contributed to data analyses and editing of the manuscript
