Introduction
Barley (Hordeum vulgare L.), one of the first and earliest crops domesticated by humans, is a major cereal grain grown in temperate climates globally. It is one of the oldest crops in the world and ranks fourth after wheat, rice, and maize (Poets et al., 2015). In Tunisia, barley is mainly cultivated in arid and semiarid climates in areas with annual rainfall of below 400 mm. In less developed Mediterranean countries such as Tunisia, barley plays a key role as its grain and straws are the principal feed for livestock. Small ruminants such as sheep and goats are the main livestock in Tunisia, representing a valuable dietary contribution in rural areas and a principal economic output (Medimagh et al., 2012). Genetic improvement to increase yield is underway in the Tunisian breeding program. Yield in barley is a complex trait governed by several genes and is a result of interactions between several components. The development of high yielding varieties adapted to local conditions depends on the understanding of the existing variability and genetic relation between barley accessions. Therefore, evaluating genetic diversity of barley lines using molecular markers is important in barley breeding for successful exploration, genetic stability, and effective conservation, because morphological characters are limited in number and unstable (Azartamar et al., 2015). Amplified fragment length polymorphism (AFLP), random amplified polymorphic DNA (RAPD), simple sequence repeats (SSR), and single nucleotide polymorphism (SNP) have been used to study genetic diversity and structure in crops (Bwalya et al., 2020; Mwangi et al., 2019). Several studies have been performed on barley to assess their genetic diversity in different germplasm collections using molecular markers. However, most studies were based on either cultivar collections (Tondelli et al., 2013) or mixtures of cultivars and landraces (Elakhdar et al., 2016). Moreover, these studies have been conducted using SSRs (Yahiaoui et al., 2014), SNPs (Cronin et al., 2007), and DArT array (Ovesná et al., 2013). SSR markers have been broadly used in plant genetic research because they are available, highly informative, and distributed throughout the genome (Varshney et al., 2005).
The main objective of this study was to analyze genetic diversity, which exist among the 32 Tunisian lines including four varieties, using 26 molecular markers. The study will facilitate cultivar development and effective use of genetic resources.
Material and Methods
Plant Materials and DNA Extraction
Thirty-two Tunisian barley lines; including four cultivars (Rihane, Manel, Lemsi, and Kounouz), one with uncertain improvement status, and 27 landraces; were used in this study. All accessions were obtained from the U.S. National Plant Germplasm System (NPGS) international database. According to the passport data, 28 accessions were collected or donated from Tunisia between 1922 and 1972 (Table 1). Eight seeds from each accession were germinated and leaves harvested at three-leaf stage after 15 days of planting. Genomic DNA was extracted using GRS Genomic DNA kit (Grisp, Portugal) according to the instruction of the manufacturer. DNA quality and quantity were determined using a UV-Vis spectrophotometer and visual comparison of 2% agarose gel electrophoresis.
Table 1
List of 32 Tunisian barley lines used for genotyping.
PCR Amplification of SSR Markers
All accessions were typed using 25 SSR markers and one InDel marker (HvBM5-Intr) that were reported and obtained from GrainGenes marker report (https://wheat.pw.usda.gov/) (Table 2). PCR amplification was performed in a total volume of 10 µL, consisting of 6 µL of GRS Hotstart Taq Mastermix (Grisp, Portugal), 0.25 µL of each SSR marker (10 µM), and 1 µL of DNA (50 ng). The PCR product was analyzed on a 2% agarose gel, and DNA amplification performed in a FastGene Ultra Cycler (96-well) (Nippon Genetics, Germany). The PCR was then subjected to the following conditions: initial denaturation at 95 °C for 5 min followed by 35 cycles of denaturation at 95 °C for 30 s, annealing at 52 °C to 62 °C for 30 s, and final extension at 72 °C for 30 s.
Table 2
Information of 26 molecular primers used for analysis of 32 genotypes in this study.
Data Analysis of Genetic Diversity and Population Structure
The number of alleles, observed heterozygosity (Ho), expected heterozygosity (He), and loci polymorphic information content (PIC) were determined using CERVUS software version 3.0.7 (Kalinowski et al., 2007). Cluster analysis of relationships between accessions based on SSR marker data was performed with the method of ward using DARwin 6.0 (Perrier & Jaccquemond-Collet, 2014). SSR marker genotyping results were used to estimate the population structure of the 32 barley accessions using STRUCTURE software. The distribution of ΔK values was determined by evaluating the logarithmic likelihood [L(K)] (Evano et al., 2005). To determine the population structure of the studied accessions, genotyping data were processed with STRUCTURE software 2.3.4, which implements a model-based Bayesian cluster analysis (Pritchard et al., 2000). A putative number of subpopulations ranging from K = 1 to 10 was assessed using 50,000 burn-in iterations, followed by 50,000 recorded Markov chain iterations. To estimate the sampling variance of inferred population structure, 10 independent runs were carried out for each K. The actual number of subpopulations was determined using the logarithm of likelihood for each K; ln P(D) = L(K), and the optimum value of ΔK was obtained by ΔK = [L″(K)]/SD, according to the report of Evanno et al. (2005), to determine the most likely number of groups. Based on the subpopulations inferred by structural analysis, we carried out analysis of molecular variance (AMOVA) to assess the population differentiation using GenAlEx version 6.5 (Peakall & Smouse, 2012) with 999 times boost-strapping.
Results
Allelic Diversity of SSR Markers
In this study, we used 32 Tunisian barley lines, including four cultivars developed by the Tunisian breeding program. Twenty-six molecular markers, distributed across the seven chromosomes of barley, were used to genotype the selected lines. The number of polymorphic alleles ranged from two to five in the studied barley accessions. A total of 89 alleles were detected, with an average of 3.4 alleles per locus (Table 2). EBmac0701 and Bmag0496 SSR markers recorded the highest number of alleles. The value of polymorphic content (PIC) ranged from 0.088 (EBmag0793) to 0.703 (Bmac0134), with an average of 0.45. The average value of PIC for all the 26 polymorphic primers was 0.45. The mean of Ho was 0.23 ranging from 0 to 0.750, whereas the mean of He ranged from 0.094 to 0.731, with a mean value of 0.51.
Clustering and Population Structure
Estimated likelihood [ln P(D)] was found to be greatest when K = 5, suggesting that the population used in this study can be divided into five clusters (Figure 1). The modern cultivars, Rihane and Lemsi, were found in Cluster 1, whereas Kounouz and Manel were distributed in Cluster 2.
Figure 1
Population structure of 32 barley accessions genotyped using 26 markers. Means of log likelihoods and their standard deviations computed with STRUCTURE software over 10 runs and for a number (K) of expected clusters ranging from 1 to 10 and ΔK values as a function of K (Figure 2A). As indicated in this figure, K value for 5 was optimal. This indicates that accessions could be divided into 5 clusters. Each cluster was represented by different color (Figure 2B).
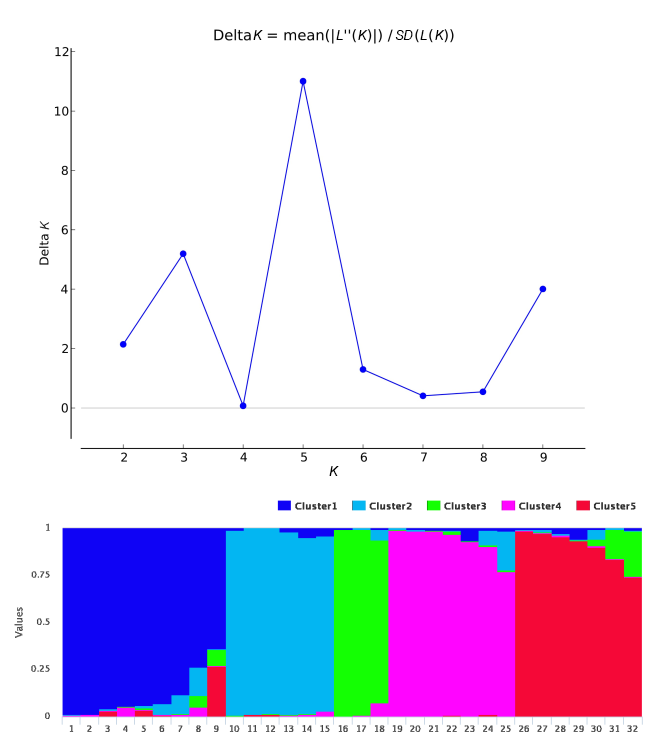
The average distance (expected heterozygosity) between accessions in each cluster was 0.46. The highest value of 0.53 was observed in Cluster 5, indicating greater genetic diversity within the clusters; however, Cluster 3 showed the lowest value of 0.42. Genetic differentiation (FST) ranged from 0.21 in Cluster 5 to 0.46 in Cluster 3, with a mean of 0.34.
AMOVA test was applied to the codominant data matrix to obtain information on the variation within and among populations using GenAlEx software. The results of the AMOVA indicated that most genetic variation was among individuals (47%) (Table 3).
Phylogenetic Analysis
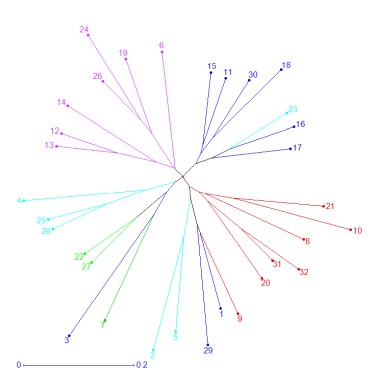
Unweighted neighbor-joining dendogram was constructed based on Nei’s similarity coefficient of 32 genotypic data and revealed the genetic relationship among the accessions. The tree showed four groups of accessions (Figure 2). All accessions collected from Kébili (south of the country) were found in Groups 3 and 4. Cultivars and accessions collected from the north and north west of the country were located in Groups 1 and 2. When the unrooted phylogenetic tree was compared with the clusters obtained from the STRUCTURE analysis, the phylogenic tree matched well with the cluster separation in the STRUCTURE analysis. Accessions in Cluster C4 belonged to Group A3, accessions in Clusters C3 belonged to group A2, and accessions in Cluster C5 belonged to Group A1. Accessions in Clusters C1 and C2 belonged to Groups A1, A2, and A4.
Figure 2
Unweighted neighbor-joining dendrogram showing genetic relationship among the 32 barley accessions based on the genetic dissimilarity matrix data of SSR markers alleles. All the accessions were divided into four groups. The colors of branches indicate accessions corresponding to the clusters (Cluster 1 to 5) from population structure analysis as in Figure 1. Numbers indicate accessions mentioned in Table 1.
Principal Coordinate Analysis
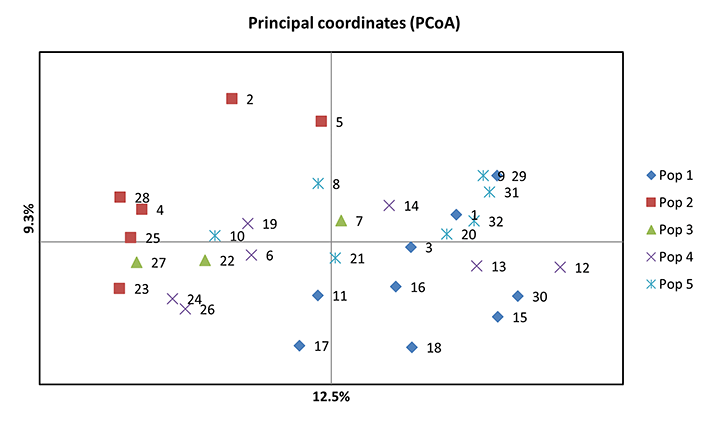
Principal coordinate analysis (PCoA) was conducted to further assess the population structure identified using SRUCTURE. The principal coordinates explained 12.5% and 9.3% of the total variation. The PCoA was largely consistent with the results of STRUCTURE. The first principal coordinate (PCo1) clearly separated 32 barley accessions into 5 groups (Figure 3).
Discussion
Estimating the genetic diversity of plant genetic resources is one of the important prebreeding activities in crop breeding. Assessing genetic diversities is important in identifying genotypes that underlie important phenotypic and genetic shifts during domestication (Vigouroux et al., 2008) and distinct genetic groups for retention of germplasm (Agrama & Eizenga, 2008). Identification of barley cultivars, lines, and accessions of Tunisian genetic resources have been based on phenotypic traits and agromorphological data. Such methods cannot provide reliable information for calculation of genetic distance and validation of pedigree (Stanton et al., 1994).
In this study, we used 32 Tunisian barley lines (Hordeum vulgare L.), including four cultivars developed by the Tunisian breeding program. Twenty-six molecular markers, distributed across the seven chromosomes of barley, were used to genotype the selected lines. The average PIC value was 0.45 and is similar to the values reported by Hamza et al. (2004) (0.45) and Zhang et al. (2014) (0.46) for 96 barley accessions generated from 69 loci but less than those reported by Jilel et al. (2008) (0.78) and Pasam et al. (2014) (0.54). The average PIC value obtained in this study is higher than the average PIC (0.36) reported by Elakhdar et al. (2016). In general, a PIC value higher than 0.5 is useful in genetic studies because it can distinguish the polymorphism of a marker (DeWoody et al., 1994). He values demonstrate the diversity level of markers, and the values obtained in this study are high; the diversity of markers reported by Pompanon et al. (2005) is also high. He values ranged from 0.094 to 0.731, with a mean value of 0.51, suggesting that there is an extensive genetic variation within the 32 barley accessions genotyped in this study.
Unrooted phylogenetic tree was compared with the clusters obtained from STRUCTURE analysis using SSR markers. The phylogenic tree matched well with the cluster separation in STRUCTURE analysis. The phylogenetic tree clearly differentiated groups according to their geographic origin.
The estimation of genetic diversity and population structure of 32 Tunisian barley lines using molecular markers may provide more accurate information to barley breeders than the classical pedigree method. The 26 primer pairs used in this study may also be of potential value for further research on genetic mapping, segregation analysis, and phylogenetic status analysis of newly introduced germplasm.
Handling Editor
Joanna Kaczmarek; Institute of Plant Genetics, Polish Academy of Sciences, Poland; https://orcid.org/0000-0001-6437-5678
