Introduction
As sessile organisms, plants must shape their growth and development in a time-dependent manner to survive a complex and changing environment. Plants perceive and integrate internal (e.g., circadian clock) and external signals (e.g., light and temperature) to adjust their self-development. In this process, large numbers of components, from genes and molecules to cells and tissues, interact at various scales. To reveal details of the molecular machinery, many molecular analyses have been performed on the different plant stages from seed germination to leaf expansion to flowering. Recently, an emerging approach to monitor these elements in large numbers is the statistical analysis of spatial and temporal transcriptome data, a method that allows one to follow thousands of genes simultaneously. This can yield new insights into the underlying biological mechanisms of plant development.
Light is the most important environmental signal that influences plant growth and development. Higher plants have evolved a wide range of photoreceptors to sense information about the light in their environment. Among these photoreceptors, red light and far red light-absorbing phytochromes (phys) are the best characterized (Neff et al.,2000; Whitelam et al.,1993). Far-red elongated hypocotyl 3 (FHY3) and far-red-impaired response (FAR1) function as positive regulators and initiate phyA signaling by directly activating transcription of the downstream targets FAR-RED ELONGATED HYPOCOTYL1 (FHY1) and FHY1-LIKE (Hudson et al.,1999; Lin et al.,2007; Wang & Deng,2002). Recent studies have demonstrated that FHY3 and FAR1 play multiple roles in plant growth and development, such as in photomorphogenesis (Wang & Deng,2002), chloroplast division (Ouyang et al.,2011), chlorophyll biosynthesis (Tang et al.,2012), circadian clock (Li et al.,2011), abscisic acid responses (Tang et al.,2013), and plant immunity (Wang et al.,2016). These functions indicate that FHY3 and FAR1 are crucial for plant growth and development. Our previous report showed that the adult fhy3 far1 mutant had slow, stunted growth, and displayed severe cell death under a long-day condition; this phenotype became even more severe under a short-day condition (Wang et al.,2016). Overexpression of the chlorophyll biosynthesis gene (HEMB1), salicylic acid (SA) metabolism and signal transduction-related genes (NahG, PAD4, SID2, and EDS1), and myo-inositol 1-phosphate synthase (MIPS1) could rescue these phenotypes in the fhy3 far1 mutant (Ma et al.,2016; Tang et al.,2012; Wang et al.,2016). In addition, chromatin immunoprecipitation-sequencing (ChIP-seq) studies have shown that FHY3 has over 1,000 putative direct targets in Arabidopsis, suggesting that FHY3 might have broader functions in plant growth and development (Ouyang et al.,2011). However, when and why FHY3/FAR1 act as either activators or repressors in various developmental stages are still unknown.
RNA-seq is an effective method to analyze time-course gene expression and to obtain system-wide information about gene transcription and regulation. Recently, a high temporal-resolution investigation of maize seed transcriptomes separated the early endosperm dynamic transcriptome into four distinct groups corresponding to four developmental stages and unraveled the genetic control of early seed development (Yi et al.,2019). Using coexpression analysis, the core conserved stress-responsive genes (CARG) were discovered as involved in the response to multiple abiotic stresses in sesame species (Dossa et al.,2019). Through the weekly transcriptome analysis of Arabidopsis halleri for 2 years, seasonal transcriptomic dynamics were revealed, and a large number of seasonal genetic oscillations were defined. This was the first time molecular studies in the lab were combined with ecological studies in natural environments (Nagano et al.,2019).
Material and Methods
Preparation of Plant Material
Plant materials used in this study include the double mutant fhy3 far1 (Lin et al.,2007; Wang & Deng,2002) and wild type Nossen (NO). To avoid germination inconsistency results from seed material at different maturity levels, all seeds were surface sterilized and sown onto the MS plates containing 0.5% sucrose and 0.8% agar. After incubation for three days at 4 °C, seeds were transferred to the growth room with 60% humidity, and were cultured in a 16/8 hr (light/dark) photoperiod at 22 °C for 7 days. Then, the in-dish-grown 7-day-old seedlings were transferred into soil:vermiculite (3:1) mixture and were maintained under identical growth conditions with regular watering.
NBT and DAB Staining
For nitroblue tetrazolium (NBT) and 3,3′-diaminobenzidine (DAB) staining, leaves were separately submerged in staining solution (NBT staining solution: 1 mg mL−1 NBT, 0.1 mg mL−1 NaN3, 10 mM potassium phosphate, pH 7.8; DAB staining solution: 0.1 mg mL−1 DAB, 50 mM Tris-acetate buffer pH 5.0) and stained overnight. The staining solution was replaced with a destaining solution (ethanol/glacial acetic acid/glycerol; 3:1:1) and was boiled for 10 min. After staining, all samples were photographed using a dissecting microscope.
Electrolyte Leakage Measurement
An electrolyte leakage assay was performed using a method described by Chen et al. (2013). Leaves were submerged in 5 mL of distilled water for 48 hr. The conductivity of the solutions was measured with a conductivity meter at regular intervals. Three biological replicates were set up for each of the measurement intervals. Statistical analysis was performed using the Student’s t test.
Transcriptome Sequencing
For the transcriptome samples, plant samples (fhy3 far1 mutant and NO wild type plants) were collected at four developmental stages: at 1-week-old cotyledons and at 2, 3, 4-week-old rosette leaves. Three independent biological replicates were set up for each genotype at the four given time points. We first randomly selected the 1-week-old seedlings of fhy3 far1 and NO in the culture dish (about 20 seedlings for each sample). Then, the cotyledon sample was collected by manual dissection, snap-frozen in liquid nitrogen, and stored at −80 °C before processing. For the rosette leaf sample, each sample was obtained by pooling leaves from at least three plants. Specifically, for each 2-week-old sample, we randomly selected five plants in good growth status and collected the two largest true leaves from each plant. For the older samples, we selected three plants and then collected one larger true leaf at the same position from each plant.
Total RNA was isolated using the RNA Pure Plant Kit (Tiangen). RNA-seq libraries were constructed according to the manufacturer’s protocol of the NEBNext Ultra RNA Library Prep Kit. The library was created using an Illumina HiSeq 2000 sequencing system.
RNA-Seq Data Analysis
Differentially expressed genes were screened by DESeq2 software (log2 fold change ≥ 1). The Blast2GO and ClusterProfiler programs were used to determine gene ontology (GO) and Kyoto Encyclopedia of Gene and Genomes (KEGG) functional enrichment, and q values less than 0.05 were considered as significant enrichment.
RNA Extraction and Quantitative RT-PCR
Plant total RNA was extracted using an RNA extraction kit (Tiangen), and first-strand cDNA was synthesized by reverse transcriptase (Invitrogen). Real-time PCR was performed according to the manufacturer’s protocol of the SYBR Premix ExTaq Kit (Takara). All primers used are listed in Table S1. Three biological replicates were performed for each sample, and expression levels were normalized against those of UBQ controls.
Coexpression Analysis
For the weighted gene coexpression gene analysis, genes with a Pearson correlation coefficient (r) greater than 0.9 were considered to be significantly coexpressed genes with FHY3 and FAR1. The coexpression network was built using the Perl script, and data correlation and visualization were performed using the Cytoscape ver. 3.4.10 program (Smoot et al.,2011).
Plasmid Construction
To obtain the open reading frames of FAR1, EDS1, PAD4, and SAG101, the first-strand cDNA was reverse transcribed from total RNA extracted from Col WT seedlings using oligo (dT)18 primer and high-fidelity FastPfu DNA Polymerase (TransGen). Fragments were cloned into the pEASY-Blunt vector (TransGen), resulting in pEASY-FAR1/EDS1/PAD4/SAG101 constructs, respectively. It should be noted that the translational stop codon in these genes was deleted to facilitate follow-up cloning. The primers are listed in Table S1, and all clones were validated by sequencing.
To construct vectors for the yeast two-hybrid assay, pEASY-PAD4 was digested with EcoRI and BamHI, and the PAD4 fragment was inserted into the pLexA vector (Clontech) cut by EcoRI and BamHI to give rise to pLexA-PAD4. The pEASY-EDS1 plasmid was cut with MfeI and XhoI, and pEASY-SAG101 was digested with MfeI and SalI, and the corresponding fragments were ligated into the EcoRI/XhoI sites of pLexA, producing pLexA-EDS1 and pLexA-SAG101, respectively. The yeast vectors pAD-FHY3 and pAD-FAR1 were described previously (Lin et al.,2007).
To prepare constructs for the BiFC assay, fragments from pEASY-FAR1 or pEASY-EDS1 cut with XbaI and XhoI were cloned into the pUC-SPYNE vector (Walter et al.,2004) digested with XbaI and XhoI, generating pYFPN-FAR1 and pYFPN-EDS1, respectively. The EDS1 gene was released from pEASY-EDS1 cut with XbaI and XhoI and cloned into the XbaI–XhoI sites of the pUC-SPYCE vector, to generate pYFPC-EDS1.
To construct LUC reporter genes driven by the SID2 promoter, a 2-kb fragment upstream of the SID2 ATG translation start code was PCR amplified with the SID2P1 and SID2P2 primers from Col genomic DNA. The PCR fragment was inserted into the pGEM-T Easy (Promega) vector to produce pGEM-SID2p. After sequencing confirmation, the SID2 promoter was released from pGEM-SID2p cut with MfeI and SacI and ligated into the EcoRI–SacI site of YY96 vector (Yamamoto et al.,1998) to produce SID2p:LUC.
Yeast Two-Hybrid Assay
Yeast two-hybrid analysis was performed according to the Yeast protocols handbook (2009). Briefly, the AD fusion plasmids were transformed into the Ym4271 strain, while LexA-fusion plasmids were transformed into EGY48 strain. After mating, transformants were grown on SD/Trp-Ura-His dropout plates containing X-gal for blue color development, from which the relative β-galactosidase activity was quantified.
BiFC Assay
For the BiFC assay in Nicotiana benthamiana leaves, Agrobacterium tumefaciens strain GV3101 containing the described plasmids was grown overnight in LB medium. The cultures were pelleted and resuspended in equal volumes of induction medium (10 mM MgCl2, 10 mM MES pH 5.7, 0.2 g L−1 acetosyringone) for 3 hr at 28 °C. The p19 protein of the tomato bushy stunt virus was used to suppress gene silencing (Voinnet et al.,2003). The desired agrobacterium cultures were combined to an OD600 ratio of 0.7:0.7:1 (YFPN-fused plasmid:YFPC-fused plasmid:p19 silencing plasmid) and were infiltrated into the leaves of 3-week-old N. benthamiana. Fluorescence was visualized in the epidermal cell layers of the leaves 2–3 days after infiltration using a confocal microscope (Olympus).
Luciferase Reporter Assay
For transient expression assays, Agrobacterium strains containing SID2p:LUC reporter plasmids, various effector constructs (Myc-FHY3, Myc-FAR1, or Myc-EDS1), 35S:GUS internal control and p19 silencing plasmids were mixed at a ratio of 0.7:0.7:0.3:1, and these were coinfiltrated into the abaxial surface of N. benthamiana leaves. Three days after infiltration, proteins from N. benthamiana leaves were extracted with the 1× Cell Culture Lysis Reagent (Promega). LUC and GUS activities were quantified as previously described (Tang et al.,2012). The relative reporter gene expression levels were expressed as LUC/GUS ratios.
Results
Loss of FHY3/FAR1 Stunts Plant Growth and Initiates Premature Cell Death
In our previous study, we noticed that the fhy3 far1 mutant plant displayed a stunted stature in the adult stage (Wang et al.,2016). To further investigate how FHY3 and FAR1 regulate plant growth, we analyzed the phenotypes of the fhy3 far1 mutant at different developmental stages. Aside from having an elongated hypocotyl, the fhy3 far1 mutant did not differ much from the NO (Nossen) wild type during the first 2 weeks (Figure 1A). Remarkably, 3-week-old fhy3 far1 grew slowly and had a retarded leaf area increase rate (Figure 1F). During week 4, the wild type grew rapidly, and its average leaf area quadrupled, reaching 5.9 cm2. In comparison, the fhy3 far1 mutant had significantly reduced vegetative growth, and its leaf area was less than one-tenth of the wild type. The leaves of the fhy3 far1 mutant visibly developed necrotic lesions.
Figure 1
Phenotypic analysis of the fhy3 far1 double mutant. (A–C) Morphology of the NO wild type (WT) and fhy3 far1 plants grown on soil under long day (LD; 16 hr light / 8 hr dark) for 2–4 weeks. Bars: 1 cm. Nitroblue tetrazolium (NBT) (D) and 3,3′-diaminobenzidine (DAB) (E) staining of WT and fhy3 far1 leaves grown under LD conditions for 3 weeks. Bars: 1 mm. (F) Areas of 3-week-old and 4-week-old leaves were measured using ImageJ software. Data are represented as mean ± SD; n = 9. (G) Electrolyte leakage of the double mutant and wild type. Three-week-old leaves were immersed in water, and electrolyte leakage was measured periodically. Asterisks denote statistically significant differences in electrolyte leakage compared with WT (p < 0.01, Student’s t test). Similar results were obtained in three independent experiments.
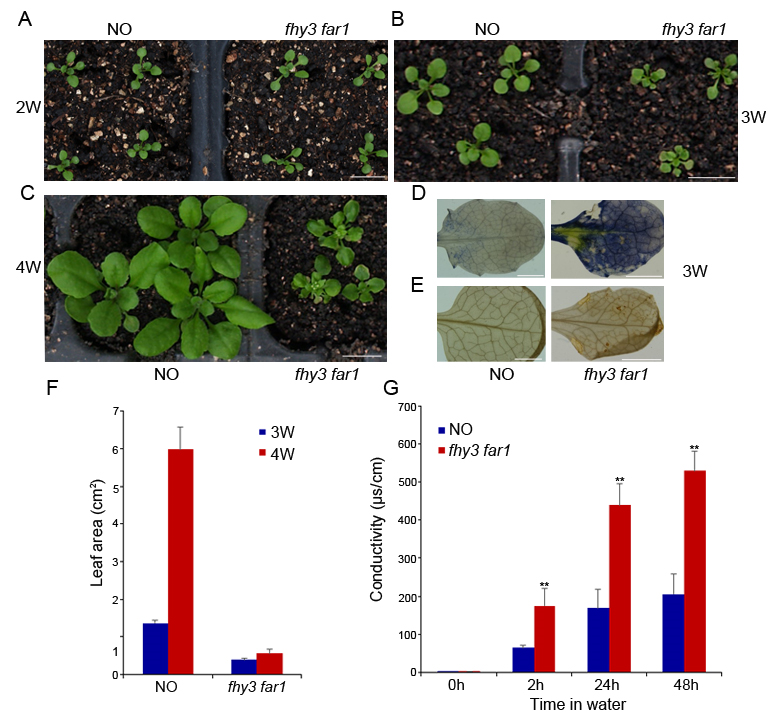
When stained with 3,3′-diaminobenzidine (DAB) and nitroblue tetrazolium (NBT) (which indicates hydrogen peroxide and superoxide accumulation), the 3-week-old leaves of fhy3 far1 were heavily stained, whereas those of the wild type were barely stained (Figure 1E,F). To determine whether photooxidative damage resulted in cell death in the fhy3 far1 mutant, we analyzed the cell death-induced electrolyte leakage of the 3-week-old leaves. In agreement with the DAB and NBT staining results, electrolyte leakage was significantly greater in fhy3 far1 than in wild type (Figure 1G). Taken together, our results indicate that FHY3 and FAR1 play key roles in controlling plant growth especially during the early third week.
Weekly Dynamic of Transcriptomes in the Wild Type
In order to explore the possible molecular mechanism of plant growth and development, 24 leaf samples at four different developmental stages were collected and subjected to Illumina paired-end sequencing. After cleaning and filtering out low quality and ambiguous reads, 506 million clean reads containing 151 Gb of valid data were acquired (Table 1). The sequencing data were deposited in the National Center for Biotechnology Information (NCBI) database (accession number: SRP229410).
Table 1
Summary of the wild type and double mutant transcriptome data obtained by Illumina sequencing.
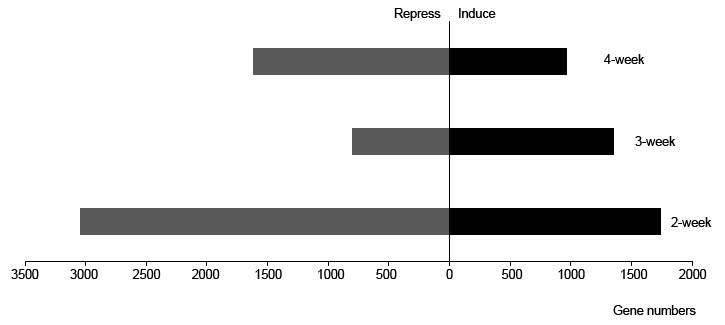
To reveal the vital biological processes of the different growing stages, we first analyzed the weekly transcriptome dynamics of the wild type. Compared with the previous week, there were 1,741 upregulated genes and 3,050 downregulated genes (Figure 2). A total of 1,353 and 1,741 genes were induced in the third and fourth weeks, respectively, whereas 805 and 1,619 were repressed. Based on the analysis of the numbers of differentially expressed genes (DEGs), we found that the early-stage gene modification was highly dynamic, especially in 2-week-old leaf tissue, and that this transcriptome modulation would play a vital role in the subsequent growth and development of plants.
Figure 2
The number of differentially expressed genes (DEGs) in each week. Number of DEGs with a q value of <0.05 and a fold change of >2 in the 2, 3, and 4-week-old NO leaves.
To gain further functional insights, DEGs were assigned to GO terms such as cellular component, molecular function, and biological process. Comparing GO annotations from genes in 2-week rosette leaves with those of 1-week cotyledons, we found that the 2-week upregulated genes were closely related to the dynamic arrangement of microtubules (MTs), These comparisons included cellular component (kinesin complex and microtubule), molecular function (microtubule motor activity and microtubule binding), and biological process (microtubule-based movement and microtubule cytoskeleton organization) (Figure 3A). The dynamic behavior of the MTs played a pivotal role in controlling cell growth and shape formation, and MT-associated proteins (MAPs) controlled MT dynamics, stability, and organization (Lloyd & Hussey,2001; Sedbrook,2004). The IQ67 DOMAIN (IQD) protein family is known as the largest and most important class of MAPs in plant development and in plant responses to the environment (Bürstenbinder et al.,2007; Liang et al.,2018). Here, we found that IQD8, IQD21, and IQD25 displayed significantly increased expression in the 2-week leaf growth (Figure 4). JAGGED, a zinc finger transcription factor encoding a gene controlling anisotropic growth, was also induced in the second week stage (Schiessl et al.,2014). Moreover, DNA replication, chromatin binding, and translation categories were significantly overrepresented, and a larger number of nuclear- and ribosome-localized proteins were also enriched among the 2-week upregulated genes. This was consistent with the established Arabidopsis MAP proteome data (Hamada et al.,2013). In the MAP-enriched proteome database, proteins implicated in replication, transcription, and translation were highly enriched. Moreover, proteins involved in RNA transcription-related processes constituted 23.5%, proteins involved in DNA replication accounted for 5.0%, and proteins with roles in translation accounted for 5.7%. The second week is a critical period for plant growth, and in this period, plants initially differentiate the true leaf and conduct early leaf morphogenesis through cell proliferation and cell expansion. A similar transcriptional change was observed in the temporal transcriptome of maize seed development. Consistent with the active nuclear division and cell proliferation that occur at the coenocyte formation stage of the maize seed, functional categories of DNA replication, transcription factor activity, DNA binding, microtubule-based movement, microtubule motor activity, and nucleosome assembly were also overrepresented in its coexpression modules (Yi et al.,2019). Hence, tissue formation of different plant materials may have common mechanisms. In the second week, the wild type (NO) initially conducts early true leaf morphogenesis by activating DNA/RNA-related processes and microtubule arrangement. When examining the downregulated genes, the largest negative DEGs mainly belonged to oxidoreductase activity and plant stress-response which are often accompanied with higher redox activity (Figure S1). In addition, it should be noted that addition of sucrose in the MS medium would influence gene expression in 1-week-old seedlings. To avoid germination inconsistency resulting from seed materials at different maturity, all seeds were sown onto the MS plates containing 0.5% sucrose and were grown for 7 days. It is known that sucrose not only serves as a carbon skeleton supply but also acts as a signal molecule that regulates a variety of growth and developmental processes in plants. It has been reported that low concentrations (0.5%–1%) of sucrose promotes seed germination, primary root growth, and hypocotyl elongation at the earliest stages of plant growth (Singh et al.,2017). We compared the 1-week upregulated genes with sucrose-responsive genes (Blasing et al.,2005) and found that 87 sucrose-induced genes were upregulated in the 1-week-old cotyledons grown in a dish compared to the 2-week-old leaves grown in soil (Appendix S1). This was consistent with the presentation of the functional category of sucrose metabolic processes among the 2-week downregulated genes (Figure S1).
Figure 3
Enrichment of selected categories of GO biological processes in genes upregulated in 2 (A), 3 (B), and 4 (C) week NO leaves compared to the previous week. Functional annotation of upregulated genes into the biological process, cellular component, and molecular function categories within the gene ontology (GO) database.
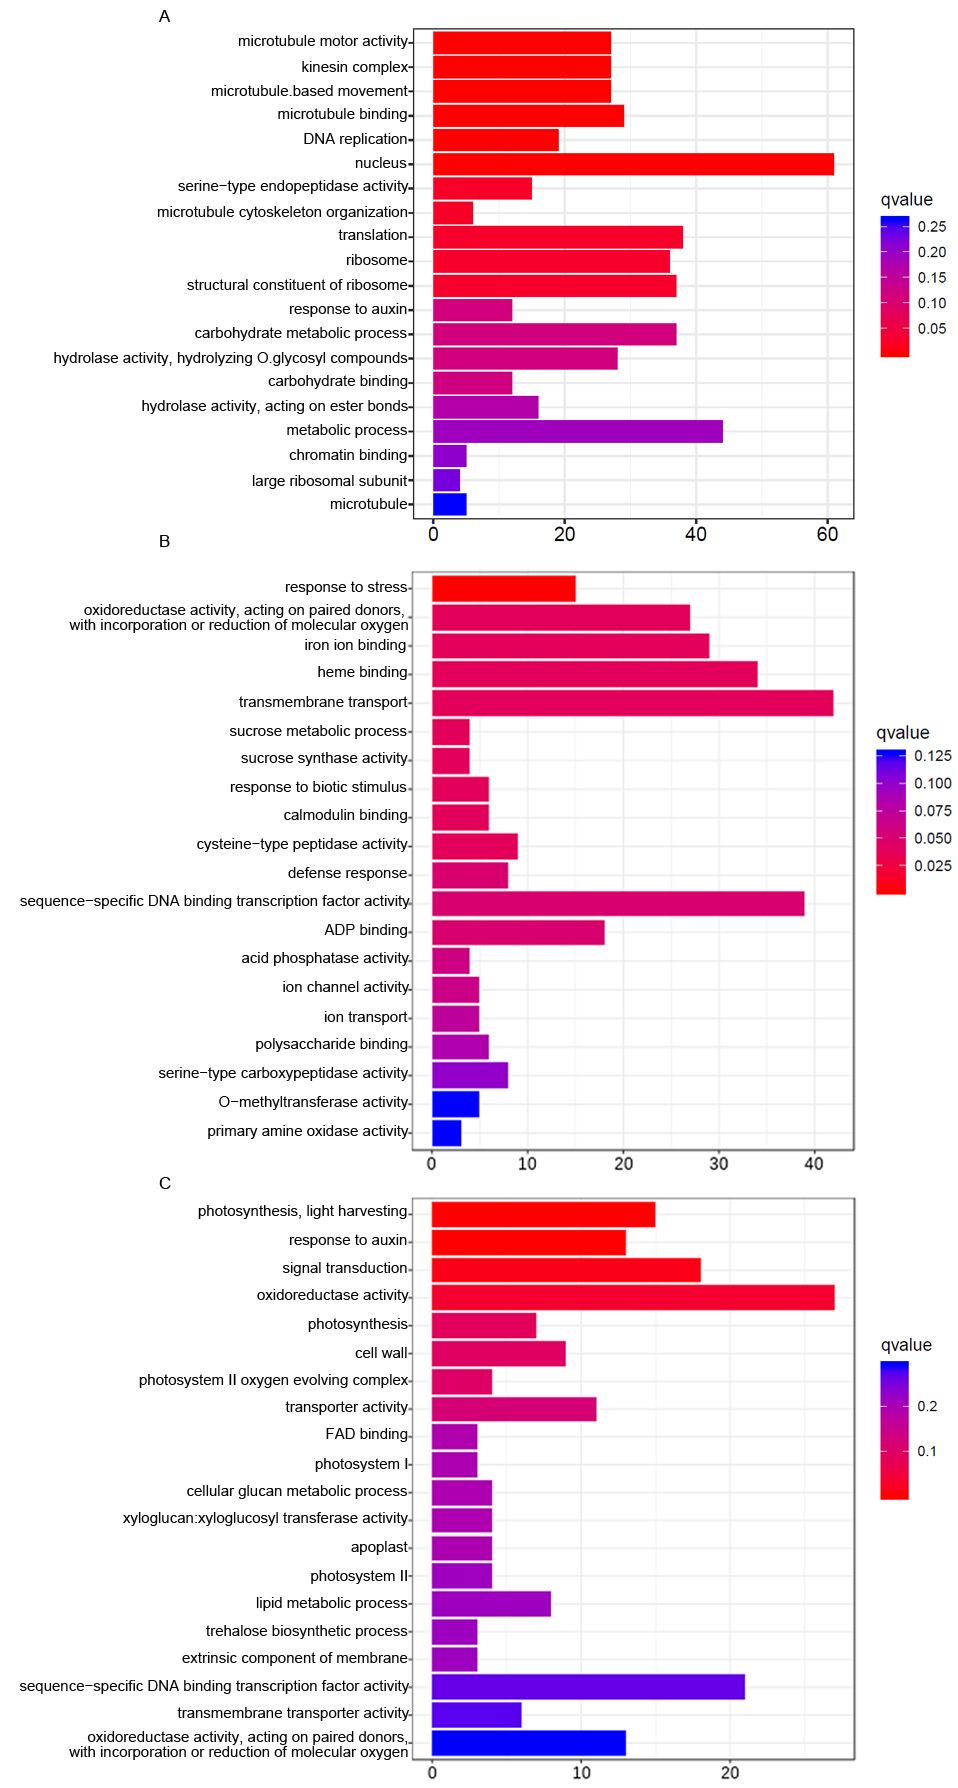
Figure 4
Validation of RNA sequencing results by real-time quantitative PCR. Relative expression of various genes determined by qRT-PCR in the NO wild type during different developmental stages. Relative expression was normalized to UBQ1 levels. Bars indicate the SD of three biological replicates.
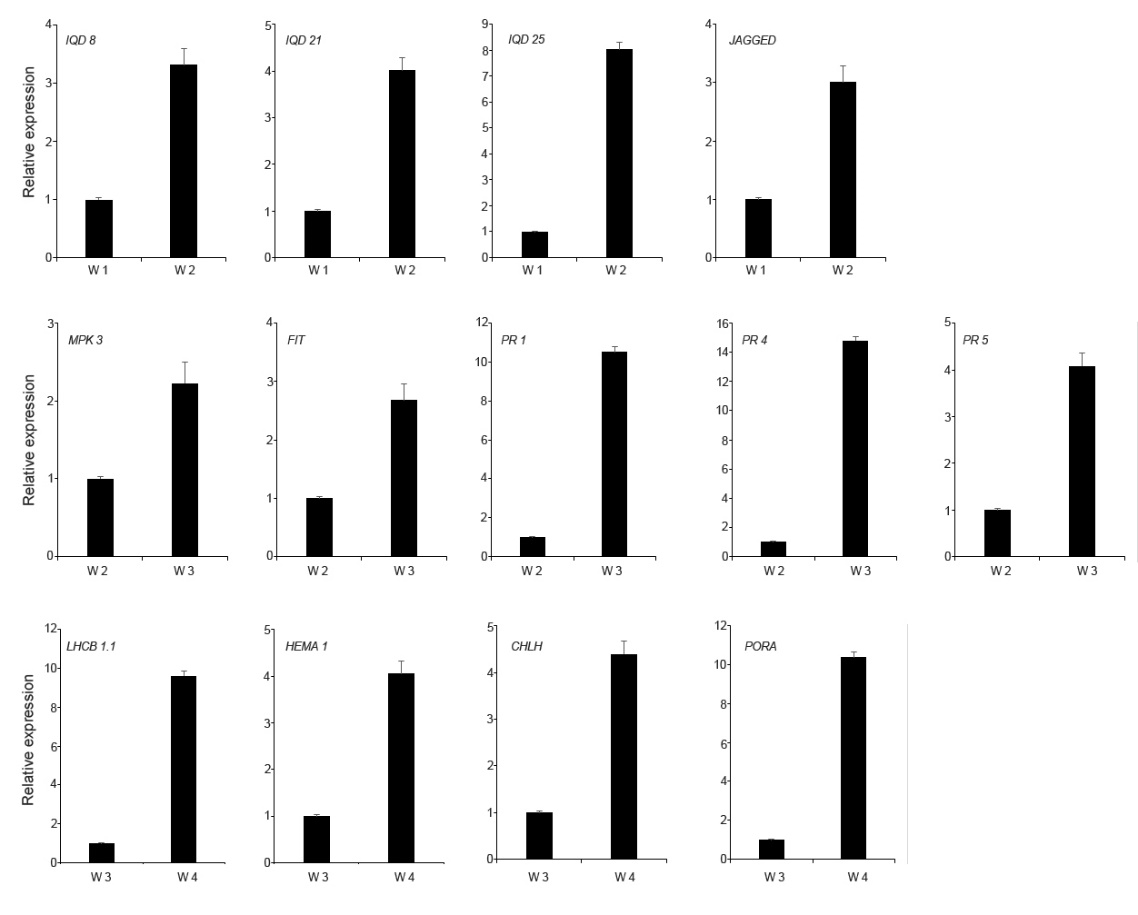
It is often assumed that growth and defense are negatively correlated. Plants must efficiently allocate their resources between stress-response pathways and growth-promoting pathways to be successful during the developmental stage. Compared with the second week, a larger number of stress process-related genes were positively regulated in the third week (Figure 3B). These primarily included the following: oxidoreductase activity, iron homeostasis, and response to stress and defense. Enhanced cellular oxidation has an important function on the regulation of plant growth and stress responses (Considine & Foyer,2014). Iron ions can exist in both the ferric and the ferrous forms and can function as a crucial redox catalyst in many cellular processes such as DNA replication, energy production, and plant immunity (Cassat & Skaar,2013; Ganz & Nemeth,2015; Luo et al.,1994). MPK3 encodes a mitogen-activated protein kinase that is an important component of ROS signaling pathways (Mittler et al.,2011). The bHLH transcription factor FIT functions as the central regulator of the Strategy I iron-uptake response (Colangelo & Guerinot,2004; Jakoby et al.,2004). As shown in Figure 4, the expression levels of MPK3 and FIT were increased in the leaves during the third week. We compared the 3-week upregulated genes with genes responding to pathogen infection (Bartsch et al.,2006). We found that 225 pathogen-induced genes were represented in the upregulated group (Appendix S1). In addition, a total of 17 R genes, which code for proteins that recognize a specific pathogen effector, were induced in the third week stage. Consistently, transcript levels of PR genes (pathogenesis-related gene) including PR1, PR4, and PR5 were also greatly upregulated. Together, these results indicate that the 3-week plant initially activates response signals to modify plant growth in response to changing environmental conditions. Subsequently, we analyzed the DEGs of 4-week leaves by comparing with the third week, and we found that upregulated DEGs were mainly assigned to photosynthesis (Figure 3C). These genes include those that encode major photosynthetic complexes of the LHCA and LHCB protein families, photosystem I/II subunits, and chlorophyll synthesis-related key enzymes (HEMA1, CHLH, GUN4, CAO, and PORA). Four of these, i.e., LHCB1.1, HEMA1, CHLH, and PORA, were selected and were confirmed to be induced in the fourth week stage by quantitative RT-PCR (qRT-PCR) analysis (Figure 4). Furthermore, the categories of oxidoreductase activity, response to auxin, and signal transduction were also significantly overrepresented among the 4-week upregulated genes. Intracellular redox interactions are important for developmental processes. Chloroplasts are powerful generators of redox signals through the core process of photosynthesis. The plant cell requires monitoring of chloroplast status to emit signals that regulate nuclear gene expression in a timely manner. Compared with the ROS transcriptional footprints (Willems et al.,2016), we found that 23 Genomes Uncoupled (GUN) retrograde signaling-related genes were represented in the 4-week upregulated genes, including two chlorophyll biosynthetic genes and 12 photosystem subunit genes (Appendix S1). Plants rely on photosynthesis to convert solar energy, carbon dioxide, and water into chemical energy and biomass. This increased photosynthetic efficiency contributes to rapid biomass accumulation, and this was consistent with the rapidly increased leaf area of the 4-week-old wild type.
Analysis of Differentially Expressed Genes (DEGs) in fhy3 far1 Mutant
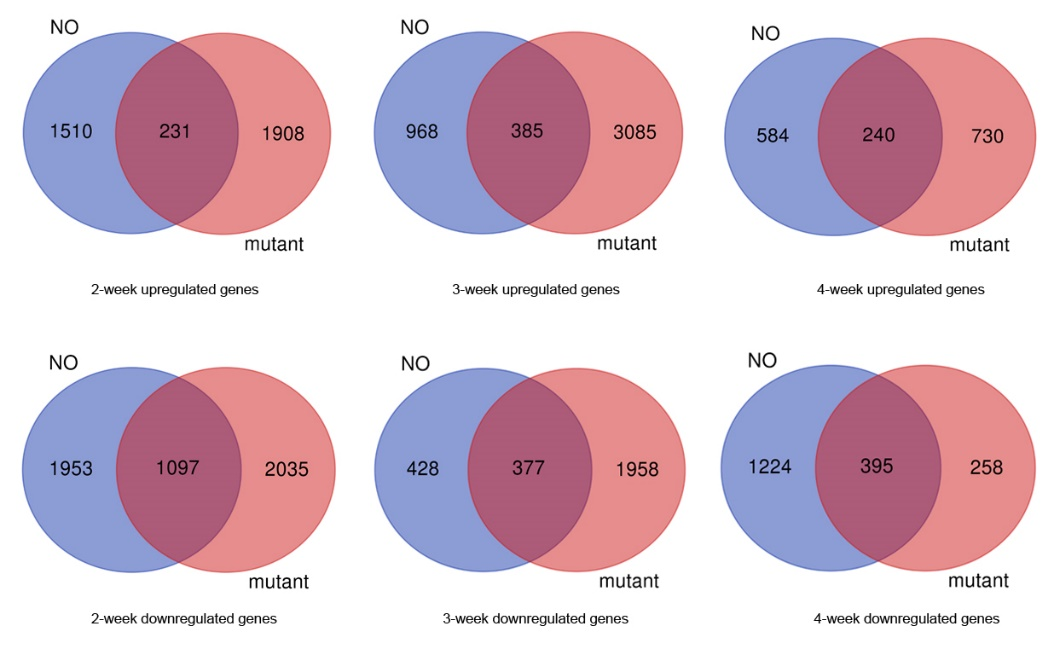
To further examine key biological processes in the various developmental stages, we conducted 4 weeks of transcriptome analysis of the growth retardation mutant fhy3 far1. Compared with NO, the number of DEGs in each developmental phase of the fhy3 far1 mutant was significantly increased especially in the first 3 weeks (Figure 5). In the mutant, there were 2,139 upregulated genes and 3,132 downregulated genes in the 2-week samples, while in the 3-week leaves, 3,475 genes were upregulated and 2,335 ones were downregulated, respectively, compared with the previous week. Out of those upregulated genes, only 231 out of 2,139 (10%) and 385 of 3,475 (11%) showed similar expression patterns with the wild type. These results indicate that FHY3 and FAR1 play an important role in various plant developmental stages, especially during the first 3 weeks, and that the loss of FHY3 and FAR1 causes large-scale changes in transcriptome.
Figure 5
Transcriptome analysis of FHY3/FAR1-regulated genes. The Venn diagram shows the overlap of upregulated and downregulated genes in NO and fhy3 far1 samples under various stages. The numbers in the circles indicate the number of genes changed in each week.
After classifying the DEGs under their GO terms, we found that fhy3 far1 had the largest positive difference in DEGs under transmembrane transport activity in the second week, including drug transmembrane transport, ion transport, transferase activity, and channel activity (Figure S2). We also observed that the oxidoreductase activity also showed high activity in the second week. Together with the eukaryotic ortholog groups (KOG) analysis result, we found that defense responses were pretriggered in the second week (Figure S3), and those that induced transmembrane transport activity and oxidoreductase activity may partly contribute to the immune response. Comparing the genes responding to pathogen infection, we found that 530 pathogen-induced genes were represented in the 2-week upregulated group of fhy3 far1 (Appendix S1). Unlike the wild type, early morphogenesis-related microtubules activity was also delayed to the third week in the mutant. Compared to gene expression in the second week, 132 MAPs-coding genes were found to be upregulated in the 3-week-old mutant (Appendix S1). It is known that both MT assembly and dynamics are assisted by the coordinated action of MAPs. Comparing DEGs of fhy3 far1 and NO in various development stages also revealed that the number of DEGs in the second week was far greater than in the other stages and that many genes closely related to microtubule activity were indeed differentially expressed in this week (Figure 6B). These results suggest that FHY3 and FAR1 are two key transcriptional factors that positively regulate MT assembly and properly inhibit the hypersensitive response in the second week to ensure optimal plant growth. Loss of FHY3 and FAR1 led to the gradual appearance of the stunted stature and necrotic lesions in the third week. In addition, we found that the protein kinase activity and protein phosphorylation categories were also significantly overrepresented among the DEGs of fhy3 far1 and NO. Protein phosphorylation is a dominant mechanism of information transfer in cells. Both the MT arrangement process and plant immunity response are accompanied by the phosphorylation of a large number of proteins. In the regulation of MT arrangement, MAPs and other regulators of MT dynamics are modified post-translationally through reversible phosphorylation to reorganize the microtubule cytoskeleton for environmental and developmental changes (Sasabe et al.,2006; Wasteneys & Ambrose,2009). It is also known that mitogen-activated protein kinases (MAPKs) are important regulators of plant immunity. Compared to wild type, we observed that several MAPK-encoding genes (MPK1, MPK2, MPK3, MPK7, MPK11, and MPK15) and MAPK cascades (MKK4/MKK5-MPK3 and MKK1/MKK2-MPK4) that are involved in plant responses to biotic stress were activated in the 2-week-old mutant. Together, these data indicate that FHY3 and FAR1 play important regulatory functions in the key biological processes in the early developmental stages of the plant, and that the loss of these two transcription factors can cause large-scale changes in the transcriptome and disrupt cellular metabolism, finally resulting in stunted growth and an out-of-control defense response.
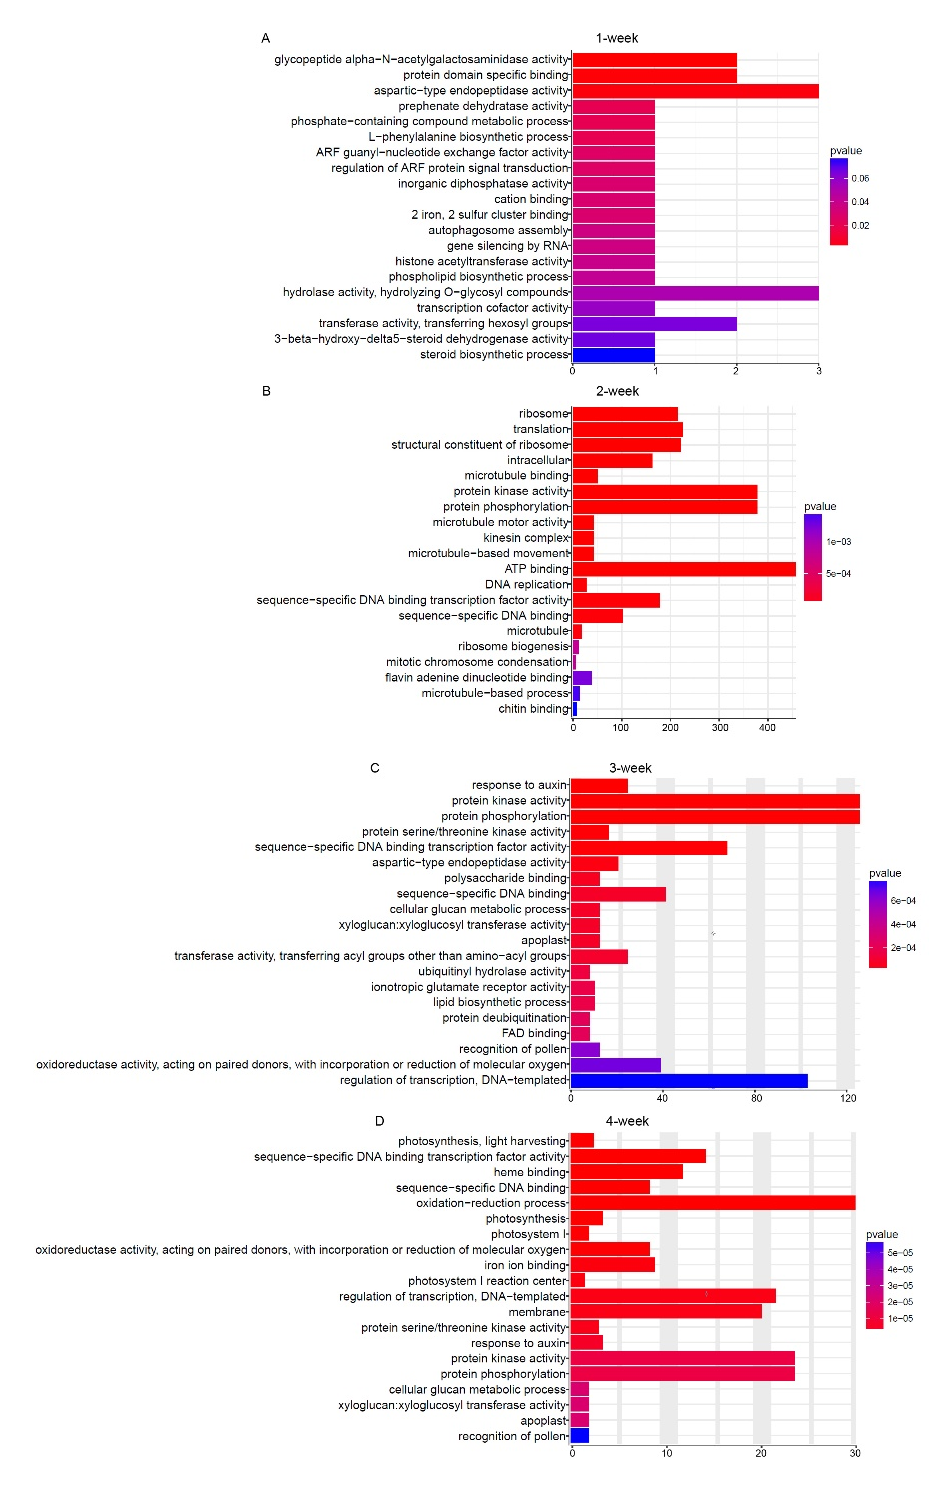
Figure 6
FHY3/FAR1 regulates genes with diverse functions. Enrichment of selected categories of GO biological processes in genes differentially expressed in fhy3 far1 compared to the wild-type genome in 1 (A), 2 (B), 3 (C), and 4 (D) week. Functional annotation of those differentially expressed genes into the biological process, cellular component, and molecular function categories within the GO database.
Identification of FHY3/FAR1 Coexpressed Genes
To obtain more information about the regulatory function of the transcription factors FHY3/FAR1, coexpression analysis using the Cytoscape software was carried out to determine specific genes that may be associated with the two genes. We identified a total of 40 genes that were coexpressed with FHY3 and 81 genes that were coexpressed with FAR1 during the early 4 weeks of growth (Figure 7). Among those genes, there were 19 genes with coexpression of both FHY3 and FAR1. This indicates that FHY3 mostly works with its homolog FAR1 to exert regulatory function; moreover, we found that FAR1 seems to have a broader regulatory role. Then, we divided the coexpressed genes into different molecular clusters. As shown in Figure 7, red-labeled genes represent the 19 coexpressed genes of both FHY3 and FAR1. Most interestingly, there were seven defense response genes (including two TIR-NBS-LRR R genes), two cell differentiation related genes, three hormonal biosynthesis regulation genes (ABA3, KAO1, and WRKY46), and four oxidoreductase activity genes that were coexpressed with FHY3. Consistent with previous studies, the fhy3 far1 double mutant showed a lesion mimic phenotype, and a number of defense related genes were largely induced (Wang et al.,2016). These results indicate that FHY3 is involved in the defense response, likely by regulating the TIR-NBS-LRR-mediated genes. Another gene that deserves attention is WRKY46, a well conserved WRKY domain transcription factor that plays crucial roles in plant innate immunity as well as in abiotic stress responses (Ding et al.,2014; Götz et al.,2008; Hu et al.,2012). It has been reported that WRKY46 could regulate abscisic acid (ABA) signaling and auxin homeostasis to inhibit lateral root development under osmotic stress conditions (Ding et al.,2015). Similarly, FHY3 could modulate ABA signaling and SA signaling to regulate plant development and plant immunity (Tang et al.,2013; Wang et al.,2016).
Figure 7
Coexpressed network analysis of FHY3 and FAR1. FHY3/FAR1-coexpression module was created using Cytoscape ver. 3.4.10. Red-labeled genes represent coexpressed genes of both FHY3 and FAR1. Edges with correlation values smaller than 0.9 were removed.
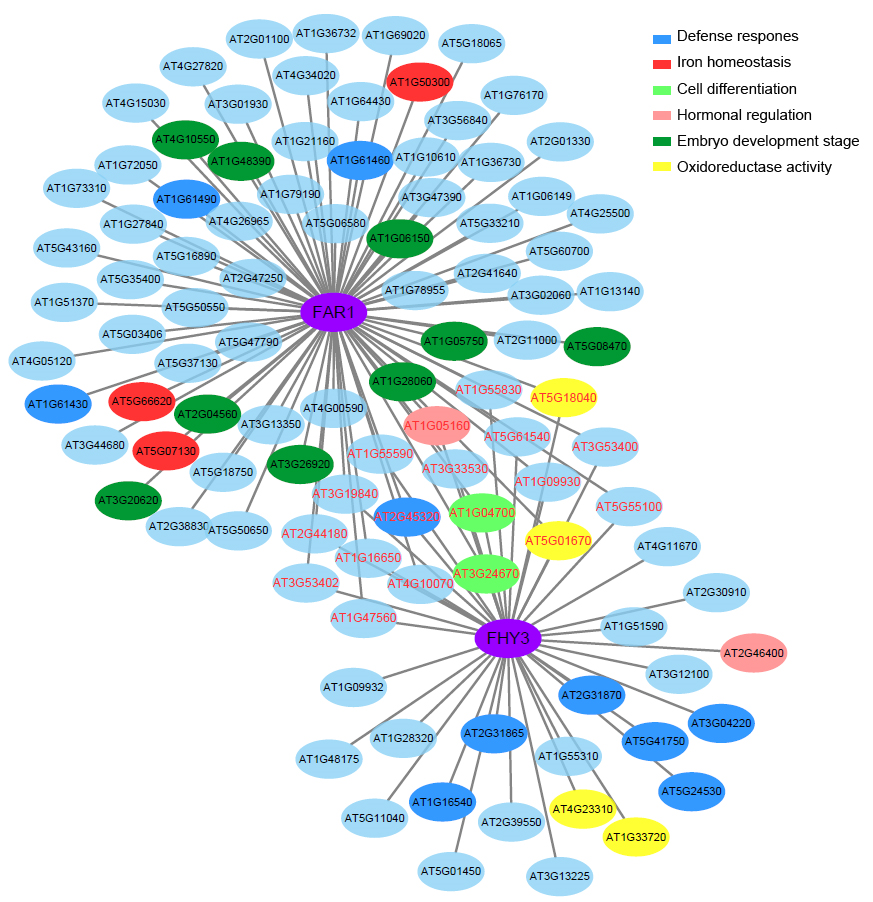
Thus, we speculate that FHY3 may associate with WRKY46 to collectively regulate cellular hormone levels to control the growth and stress response processes. Going back to FAR1, we found that it has nine coexpressed genes which were specifically expressed at the embryonic stage, four defense response genes, and three iron homeostasis-related genes. Thus, we speculate that FAR1 may play an important role in the early development stage, and this may be through the regulation of redox homeostasis and inhibition of the early immune response to promote plant growth. Combined with the phenotype of fhy3 far1 mutant, these data indicate that the two light signaling factors may be associated with the positive regulation of early embryonic development and in the later growth stage may negatively regulate expression of defense-related genes to balance plant growth and immunity.
FAR1 Physically Interacts With EDS1
Our previous study indicated that FHY3 and FAR1 negatively modulate plant immunity by regulating the NB-LRR-mediated SA signaling pathway to the defense response (Wang et al.,2016). Enhanced disease susceptibility1 (EDS1) is regarded as a central regulator of plant innate immunity, and it interacts with two sequence-related proteins, Phytoalexin deficient 4 (PAD4) and Senescence-associated gene 101 (SAG101), and operates upstream of pathogen-induced SA accumulation (Feys et al.,2001,2005). To explore how the transcription factors FHY3/FAR1 participate in the regulation of immune signaling, we first focused on three nuclear localization immune signaling factors, EDS1, PAD4, and SAG101, which appear to travel between the nucleus and cytoplasm. The movement of these proteins is important for transcriptional reprogramming in disease resistance (Wiermer et al.,2007; Vlot et al.,2009). We attempted to test whether these proteins could interact with FHY3 and FAR1 in the nucleus. In a yeast two-hybrid assay, we found that a combination of LexA-EDS1 (EDS1 fused to the DNA-binding domain of LexA) and AD-FAR1 (FAR1 fused to the activation domain of B42) strongly activated LacZ reporter gene expression, indicating that EDS1 and FAR1 interact in yeast cells (Figure 8A,B). We also observed that FHY3 weakly interacted with EDS1; however, no interaction was observed between FHY3/FAR1 and PAD4 or SAG101 (Figure 8A). To test this notion in vivo, we carried out a bimolecular fluorescence complementation (BiFC) assay in Nicotiana benthamiana leaves via an Agrobacterium-mediated transient expression approach. As positive controls, YFPN-EDS1 (EDS1 fused to the N-terminus of yellow fluorescence protein) and EDS1-YFPC (EDS1 fused to the C-terminus of YFP) interacted and produced fluorescence signals in the nucleus and cytoplasm (Figure 8D). We observed that coexpression of YFPN-FAR1 and EDS1-YFPC resulted in strong fluorescence in the nuclei of N. benthamiana leaves (Figure 8C), suggesting that FAR1 and EDS1 interact in this subcellular compartment. However, expression of either FAR1 or EDS1 failed to produce YFP fluorescence. Thus, we conclude that FAR1 and EDS1 interact in the nucleus.
Figure 8
Interaction between FAR1 and EDS1. (A) Yeast two-hybrid assay showing the interaction between LexA- and AD-fused proteins. Growth of blue yeast cells indicates an interaction between the two proteins. (B) Quantification of yeast two-hybrid interactions by determining β-galactosidase activity. Bars indicate the SD of six individual yeast colonies. (C) BiFC assay showing that YFPN-FAR1 and EDS1-YFPC interact to reconstitute a functional yellow fluorescence protein (YFP) in the nucleus (indicated by arrows) of Nicotiana benthamiana leaves. Bar: 50 μm. (D) Transient expression assay of SID2p:LUC in N. benthamiana. Relative LUC activity was normalized to the 35S:GUS internal control. Bars indicate the SD of three replicates. (E) Venn diagrams showing the overlap of differentially regulated genes in fhy3 far1 with previously reported EDS1-induced genes (Bartsch et al.,2006).
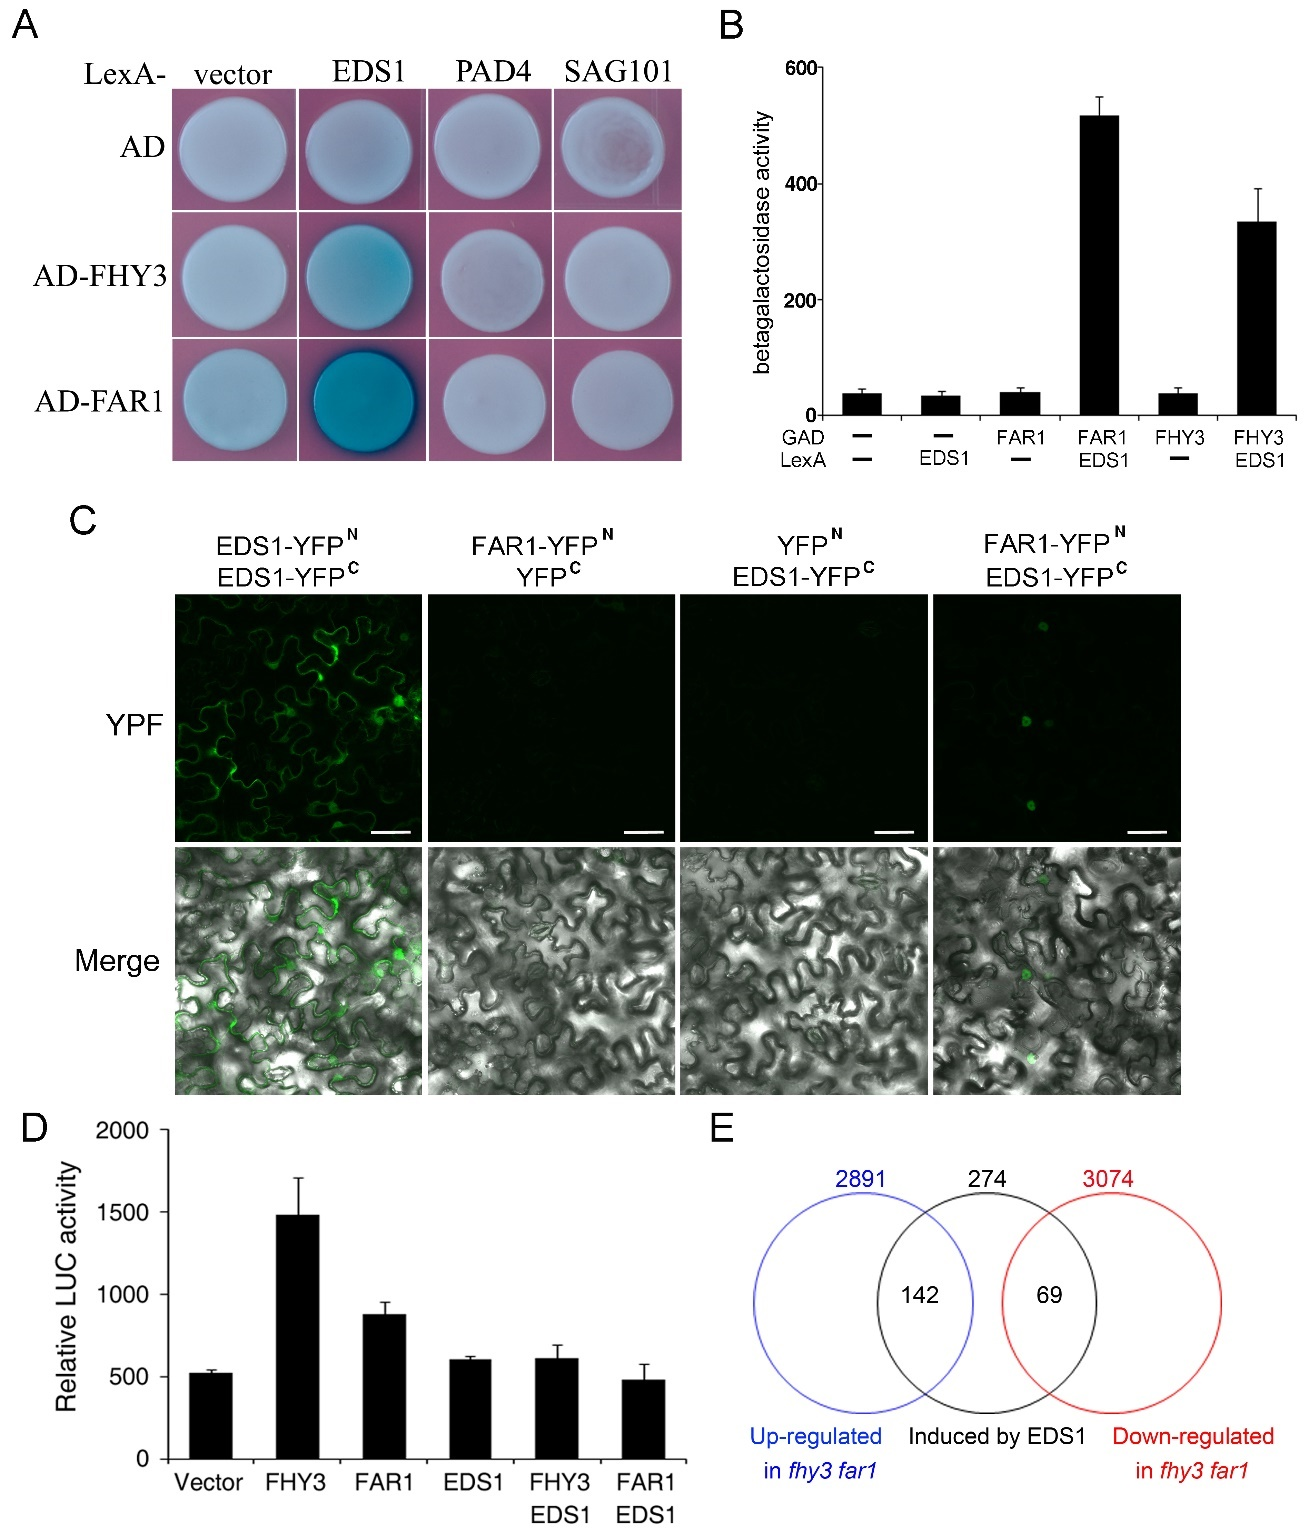
To explore the molecular relevance of the FAR1-EDS1 interaction, we constructed a luciferase reporter gene driven by SID2 (SALICYLIC-ACID-INDUCTION DEFICIENT, which encodes a key enzyme in pathogen-induced SA biosynthesis) promoter (SID2p:LUC) and performed a transient expression assay in N. benthamiana leaves with FAR1 and/or EDS1 effectors. FAR1 did not affect the expression of SID2p:LUC, whereas EDS1 strongly induced its expression (Figure 8D). Most intriguingly, the coexpression of EDS1 with FAR1 markedly reduced the expression promoted by EDS1 alone (Figure 8D), suggesting that FAR1 inhibits the activity of EDS1 on downstream gene expression. To further investigate the effect of FHY3/FAR1 on the molecular function of EDS1, we comparatively analyzed the gene regulatory function of FHY3/FAR1 and EDS1 on the transcriptome level. Through the analysis of the gene expression profiles of 4-week-old fhy3 far1 and eds1, we found that 142 out of 274 (52%) EDS1-induced genes were represented in the downregulated group of FHY3/FAR1 while 69 (25%) EDS1-induced genes were found to be downregulated in fhy3 far1 (Figure 8E) (Bartsch et al.,2006). Together, these results indicate that FHY3 and FAR1 are involved in the defense response, likely through the ESD1-mediated immune signaling pathway.
Discussion
FHY3 and FAR1 Play a Broad Regulatory Role in Plant Phase Growth
As sessile organisms, plants need to adjust themselves in time according to changes in the external environment. The extensive molecular interplay between external and internal signals allows for a plant’s developmental regularity. In this study, we revealed three major biological processes during the early 4 weeks of plant growth using a time-course transcriptome analysis: morphogenesis promoted in the second week, large-scale defense responses triggered in the third week, and rapid biomass accumulation supported by increased photosynthesis in the fourth week. RNA-seq analysis revealed that the loss of both FHY3 and FAR1 completely disturbed the three aforementioned biological processes. In the fhy3 far1 mutant, defense responses were pretriggered in the second week, while morphogenesis-related microtubules activity was delayed to the third week, and photosynthesis was also affected in the fourth week. These indicate that FHY3 and FAR1 play a wide regulatory function on plant growth and development in various developmental stages. Although research on the physiological and molecular mechanisms of FHY3/FAR1 in many biological processes has made great progress, when and how they sense plant endogenous growth signals and integrate various environmental signals to play their growth-dependent regulating functions still require further study.
FHY3/FAR1 Integrate Plant Immune Signaling
EDS1 and PAD4 localize to both the nucleus and cytosol. The dynamic distribution between these two compartments upon pathogen recognition is likely responsible for proper signal relay (Garcia et al.,2010; Wiermer et al.,2007). Two studies have improved our understanding of defense signaling by revealing that EDS1 forms protein complexes with the TIR-NBS-LRR disease resistance proteins RPS4 and RPS6 in the nuclei and activates defense signaling (Bhattacharjee et al.,2011; Heidrich et al.,2011). However, the nuclear actions of EDS1 remain poorly understood. Our finding that FAR1 interacts with EDS1 and represses its activity sheds light on the molecular role of EDS1 in the nucleus, where it might regulate transcriptional reprograming by interacting with other transcription regulators. In addition, certain photoreceptor mutants (e.g., phyB) have shown some susceptible phenotypes (Kazan & Manners,2011). This indicates that light has a profound influence on plant immunity. Our study links two key components of the phyA signaling pathway, FHY3 and FAR1, with the defense response, and we found that these two factors likely function as a node of crosstalk between light and immune signaling. Further investigation is needed to elucidate the molecular mechanisms behind their effects on the downstream gene expression of EDS1.
Supporting Material
The following supporting material is available for this article:
Figure S1. Enrichment of selected categories of GO biological processes in genes downregulated in the 2, 3, 4-week leaves of NO compared to the previous week.
Figure S2. Enrichment of selected categories of GO biological processes in genes upregulated in the 2, 3, 4-week leaves of fhy3 far1 compared to the previous week.
Figure S3. Enrichment of selected categories of KOG biological processes in genes upregulated in the 2, 3, 4-week leaves of fhy3 far1 compared to the previous week.
Table S1. List of primers used in this study.
Appendix S1. Summary of characteristic genes in the different development stage of wild type (NO) and mutant (fhy3 far1).
Handling Editor
Przemysław Wojtaszek; Adam Mickiewicz University in Poznań, Poland; https://orcid.org/0000-0002-4484-1536
