. Introduction
Gall formation is a manifestation of the reprogramming of plant cell growth and development stimulated by insects and other organisms. Approximately 132, 930 insect species worldwide can induce gall formation (Zhang et al., 2018). One of the oldest known fossil galls was produced on a tree fern in the central region of North America in the late Carboniferous era, approximately 302 Ma (Harris & Pitzschke, 2020). Insects produce the most diverse and complex galls in nature (Tooker & Helms, 2014), such as leaf, flower, fruit, stem, and root galls (Guedes et al., 2016; Mani, 1964; Miller, 1975). Many plants have gall leaves, such as Robinia spp. (Molnár et al., 2009), Prunus serotina and Rhus glabra (Larson, 1998). Obolodiplosis robiniae, a pest gall midge, leads to delayed growth and development of Robinia spp. (Molnár et al., 2009). Two gallers, Phytoptus cerasicrumena and Melaphis rhois, affect the photosynthetic rate of leaves in P. serotina and R. glabra (Larson, 1998). Further, the expression levels of certain secondary metabolites (e.g., shikimate and phenylpropanoids) undergo significant changes during gall formation (Nabity et al., 2013).
The Hamamelidaceae family contains 28 genera (Xiang et al., 2019), nine of which have been reported to produce galls. Among these, seven genera (Fothergilla, Parrotia, Distylium, Distyliopsis, Hamamelis, Sycopsis, Trichocladus) have been explicitly reported to form galls on leaves (Dederich et al., 2022; Adroit et al., 2018; Zhou et al., 2025; Chen et al., 2011; Yang et al., 2014; Endress, 1993; Yeh & Ko, 2017; Conner et al., 2013; Lewis & Walton, 1958; Mizuki et al., 2024; Walker, 1944; Chetverikov et al., 2021; Gong et al., 1988). Distylium racemosum, the most widely distributed and hardiest species within its genus, was first described in 1835 and is distributed in western Japan, the Ryukyu Islands, Korea, and southern China naturally. In natural habitat, D. racemosum exhibits polymorphism, while mostly appearing as either a sprawling, upright tree (International Dendrology Society, 2024). To date, four species of Nipponaphis (Aoki et al., 2015; Aoki et al., 2019). Monzenia minuta (Yeh & Ko, 2017), Tripartita formosana (Yeh & Ko, 2017), and Neothoracaphis hangzhouensis (Shen et al., 1993) have been found to cause galls on the leaves of D. racemosum. In China, N. hangzhouensis migrates to D. racemosum in early November, lays eggs at the base of leaf bud scales in mid-January, and nymphs hatch in late March. By mid-May, the aphids emerge from galls and migrate to secondary host trees, including Quercus alba, Q. robur, and Liriodendron tulipifera, to spend the summer (Shen et al., 1993). Annually in spring, newly emerged leaves of these D. racemosum trees become covered with galls.
Differences in relative conductivity, malondialdehyde (MDA) content, protein content, and superoxide dismutase (SOD) enzyme activity for D. racemosum have been compared between galled and normal leaves (Ling, 2012). Although the alteration of plant gene expression under insect biotic stress is a widespread phenomenon (Giron et al., 2016), the effects of galler parasitism on the transcriptional levels of galled leaves of D. racemosum remain unknown. Omics technologies and systems biology have been widely applied in research related to insect gallers and their host plants (Oates et al., 2016). Previous studies on D. racemosum can no longer meet the data resource demands in this field, necessitating the implementation of transcriptomic studies. Although transcription factor families of model plants, such as Arabidopsis, have been thoroughly annotated (Gao & Dubos, 2024), and gene expression profiles during gall formation have been studied (Hirano et al., 2023), data for the vast majority of non-model plants remain scarce.
Transcriptomic technology has thus become indispensable for deciphering plant responses to biotic stress. Notable advancements include mechanistic insights into gall formation processes, as demonstrated by two researches (Takeda et al., 2024; Bailey et al., 2015). Comprehensive transcriptome profiling of Artemisia indica during Rhopalomyia-induced gall development revealed that transformation from source to sink organs occurs during gall development (Takeda et al., 2024). Systematic characterization of psyllid-triggered transcriptional dynamics in Metrosideros polymorpha revealed that the auxin response is involved in galling (Bailey et al., 2015). In addition, extracting biologically meaningful insights from extensive datasets has become a focal point in recent research, particularly for the annotation and functional prediction of unknown genes (Chen et al., 2024). For example, transcriptome annotation has been conducted to develop gene resources for the snail Karaftohelix adamsi (Park et al., 2024).
In the present study, we used DNA nanoball (DNB) sequencing and Trinity assembly to draft a reference transcriptome for D. racemosum. We also conducted a differentially expressed gene (DEG) analysis between galled and normal leaves, providing data for further understanding the phenomenon of gall formation.
. Materials and methods
. Plant materials
Distylium racemosum, a small evergreen tree belonging to the Hamamelidaceae family, experiences annual infestations in spring with gall formation on newly developed leaves. D. racemosum living at Wuhan University in central China flowers from March to May, followed by fruiting from June to August. Based on our observations, the dominant aphid species infesting these trees is Neothoracaphis hangzhouensis. We collected both galled (three biological replicates: A1, A2, and A3) and healthy leaves (three biological replicates: B1, B2, and B3) at Wuhan University. After cleaning with ddH2O, the leaves were immediately frozen in liquid nitrogen to prevent RNA degradation by endogenous and environmental RNases. RNA was then extracted from each sample and sequenced.
. RNA extraction
For each individual sample, the appropriate amount of tissue was ground into powder under liquid nitrogen and transferred to 1.5 mL of preheated CTAB lysis reagent (supplemented with 2% β-mercaptoethanol) at 65°C and incubated at 65°C for 15 min. After incubation, the tube was cooled to 25°C and then centrifuged at 4°C with 12,000 × g for 5 min.
The supernatant was transferred to a 2.0 mL EP tube, and 200 μL of chloroform/isoamyl alcohol (24:1) per milliliter of CTAB lysis buffer was added. The mixture was vortexed to mix and centrifuged at 4°C and 12,000 × g for 10 min.
Next, the clear upper aqueous layer was transferred to a 2.0 mL EP tube. An equal volume of phenol: chloroform: isoamyl alcohol (25:24:1) was added. The mixture was vortexed for mixing and centrifuged at 4°C and 12,000 × g for 10 min. The clear upper aqueous layer was then transferred to a 2.0 mL EP tube. An equal volume of chloroform: isoamyl alcohol (24:1) was added to the mixture. The mixture was vortexed for mixing and centrifuged at 4°C and 12,000 × g for 10 min. The final clear upper aqueous layer was transferred to a new 1.5 mL EP tube, and 2/3 of the aqueous layer volume of isopropanol was added. The mixture was gently inverted to mix well and placed at -20°C for 2 h. The RNA precipitate was collected by centrifugation at 4°C and 12,000 × g for 20 min. The supernatant was removed, and the precipitate was resuspended and washed with 1 ml of 75% ethanol. After washing, the precipitation was centrifuged again at 4°C and 17,500 × g for 3 min. The supernatant was discarded and the precipitate was dried in a biosafety cabinet for 4 min. Finally, 35 µL of RNase-free water was added to dissolve the RNA.
. mRNA library preparation
Notably, this study used a unique second-generation sequencing method, namely DNB sequencing technology (Drmanac et al., 2010) by BGI Genomics Co., Ltd. Compared with the commonly used Illumina bridge amplification, DNB sequencing employs rolling circle amplification, which prevents the exponential accumulation of error-containing strands during subsequent amplification (Li et al., 2019).
Library preparation was performed using the Optimal Dual-mode mRNA Library Prep Kit (BGI, Shenzhen, China). Briefly, 200 ng of total mRNA was denatured at a suitable temperature to open the secondary structure (set hot lid at 65°C and react in the following order to complete the combination of mRNA and mRNA Capture Beads: 65°C, 5 min; 25°C, 5 min; and 25°C, hold), and mRNA was enriched using oligo (dT)-attached magnetic beads. After reacting at 85°C for 8 min, RNA was fragmented using fragmentation reagents.
First-strand cDNA was generated by random hexamer-primed reverse transcription, followed by second-strand cDNA synthesis. The synthesized double-stranded cDNA was then subjected to an end-repair reaction. After cDNA end repair, a single ‘A’ nucleotide was added to the 3' end of the blunt fragments through an A tailing reaction. The reaction system for adaptor ligation was then configured to ligate adaptors with the cDNAs, and the library products were finally amplified using PCR and subjected to quality control.
Single-stranded library products were then generated by denaturation. The circularization reaction system was set up to obtain single-stranded cyclized DNA products. Uncyclized single-stranded linear DNA molecules were digested. The final single-strand circularized library was amplified using phi29 and rolling circle amplification to generate DNB, which carried more than 300 copies of the initial single-stranded circularized library molecule. DNBs were then loaded into a patterned nanoarray, and PE150 base reads were generated on the T7 platform (BGI-Shenzhen, China).
. Data filtering
The raw data were filtered with SOAPnuke (Chen et al., 2018) (v1.6.5) by (I) removing reads containing adapters (adapter contamination), (II) removing reads whose unknown base (‘N’ base) ratio was more than 1%, and (III) removing reads whose low-quality base ratio (base quality less than or equal to 15) was more than 40%, after which clean reads were obtained and stored in the FASTQ format.
. De novo assembly and quality assessment
Trinity (v2.13.2) (Grabherr et al., 2011) was used to assemble clean reads and BUSCO was used to assess assembly quality. Sequencing produced 39.50 Gb of high-quality data with Q20 (>98%) and Q30 (>93%) pass rates and >96% Clean Reads Ratio across all samples (Table S1). The assembly generated 104,537 unigenes, predominantly short sequences (10200 nt, > 20,000) decreasing with length but including a notable subset > 3000 nt (Figure S1; Table S2). CD-HIT clustering was used to remove redundancies, yielding an All-Unigene dataset for downstream analysis.
. Reference gene mapping
Clean data were mapped to the unique genes assembled using Bowtie2 (v2.4.5) (Langmead & Salzberg, 2012) and the expression levels of genes were calculated using RSEM (v1.3.1) (Li & Dewey, 2011).
. Gene annotation
Unigenes were annotated using major functional databases (KEGG, GO, NR), and transcription factors were predicted. For plant transcription factors, getorf was used to determine the ORFs of the unigenes, followed by hmmsearch to align the ORFs with transcription factor protein domains. We then identified the functions of the unigenes based on the characteristics of the transcription factor families described in PlantTFDB (https://planttfdb.gao-lab.org).
. Differential gene expression
Between-group differential gene analyses were performed using DEseq2 (Love et al., 2014) and DEGSeq (Wang et al., 2010). Poisson Dis was used for between-sample differential gene analysis. According to the GO and KEGG annotation results and official classifications, DEGs were functionally classified; phyper in R software was used for KEGG enrichment analysis, and the TermFinder package was used for GO Enrichment analysis. Criteria for selecting DEGs and parameters for enrichment analysis are listed in Table S3.
. Simple sequence repeat (SSR) forecast
Unigenes were detected using MISA (v1.0) (Thiel et al., 2003), and Primer3 (v2.6.1) (Untergasser et al., 2012) was used to design primers for SSR detection.
. RT-qPCR
RT-qPCR analysis was conducted for six highly expressed target genes, a selection strategy that minimizes stochastic amplification failures and enhances signal detection robustness in low-variability systems. To ensure rigorous experimental validation, we implemented a hierarchical replication approach: 1) Three independent biological replicates (derived from distinct experimental cohorts) were analyzed per target gene to account for inter-subject variability; 2) Each biological replicate underwent triplicate technical measurements (n = 3) using independently assembled reaction mixtures, thereby controlling for intra-assay variability. The GAPDH gene is a housekeeping gene that is highly expressed in almost all tissues, and its expression level is generally constant in the same type of cells or tissues. For a long time, the GAPDH gene has been widely used as an internal reference gene in qPCR (Zhang et al., 2011). The GAPDH gene was also selected as the internal reference gene in this study. Relative gene expression levels were calculated according to the ΔΔCt method. Subsequently, the correlation rate between the RT-qPCR results and transcriptome differential expression analysis was determined.We have detailed the technical details in Appendix S1.
. Results
. Transcriptome gene annotation
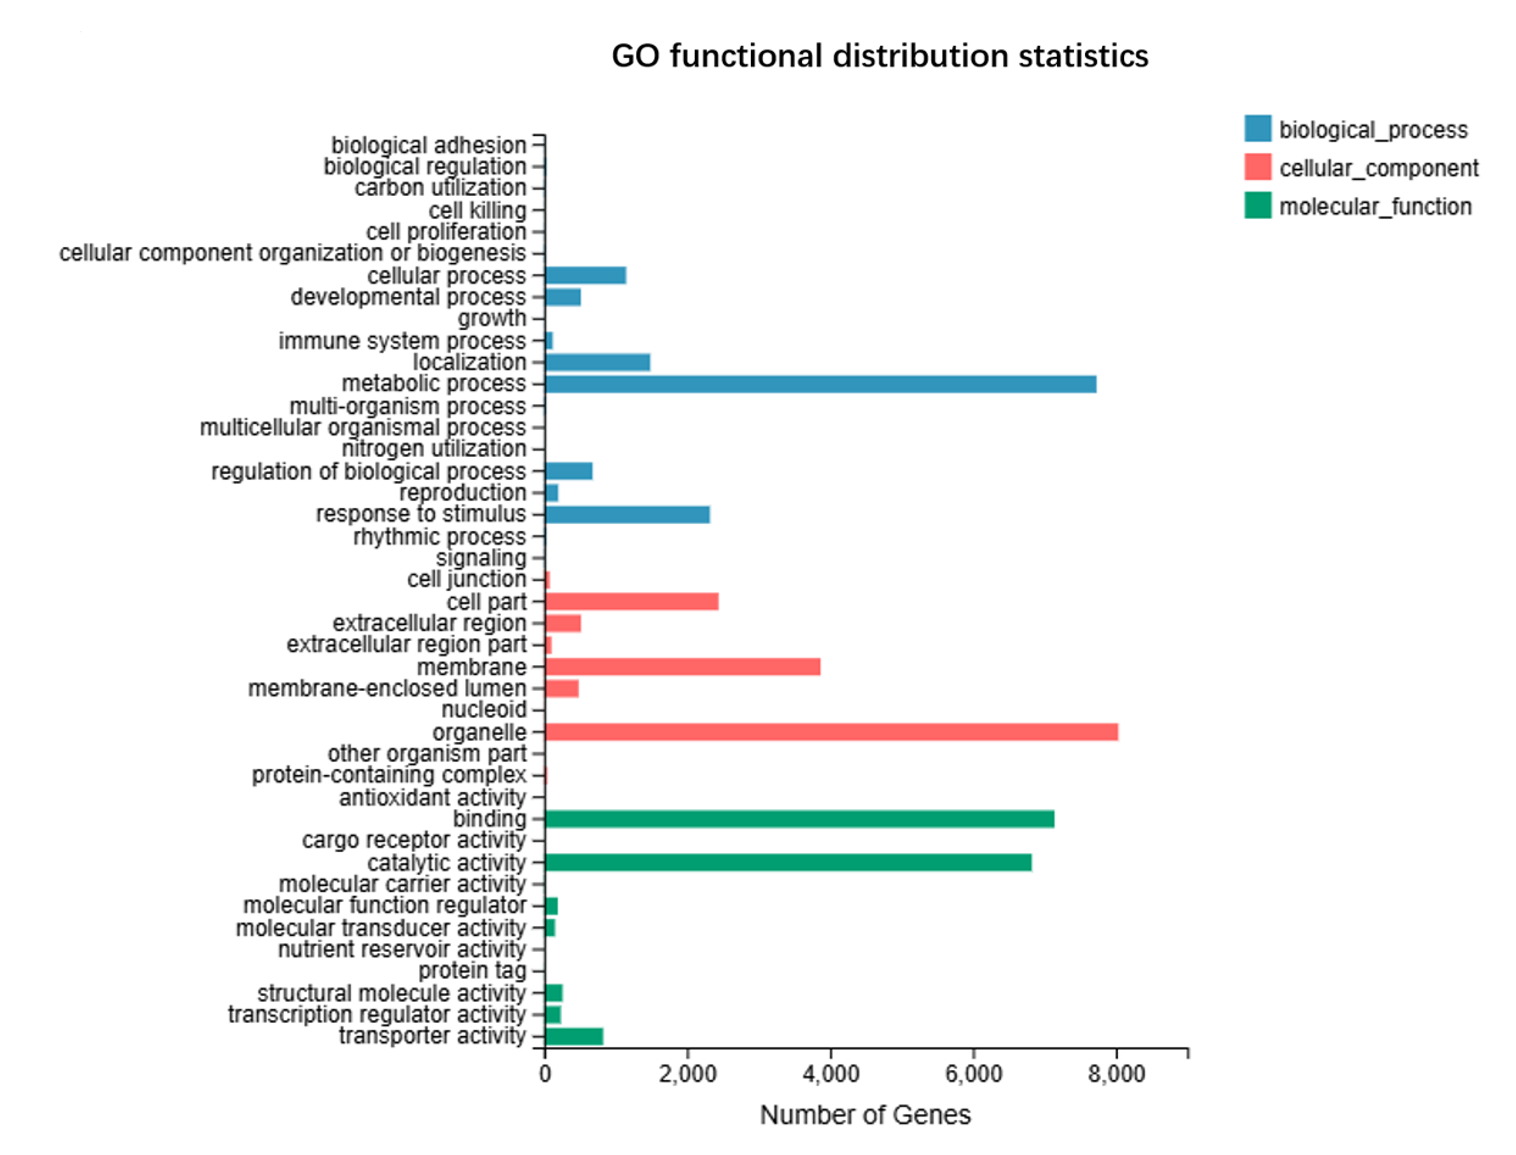
We annotated the assembled unigenes, resulting in a Venn diagram of the gene annotations (Figure 1). Notably, 3,678 genes were common to GO, KEGG, and NR, but absent from the TF annotations. A substantial number of genes, 5,325, were shared between NR and KEGG alone, whereas fewer genes overlapped with the other combinations. There were 3,990 common unigenes in the four types of gene annotations. We annotated the unigenes aligned to the KEGG database and analyzed the gene classification (Figure 2). The KEGG functional distribution statistics revealed that the most enriched KEGG pathway was Carbohydrate metabolism, with 1,059 annotated genes. In addition, 229 unigenes were involved in the “Metabolism of terpenoids and polyketides” pathway. The subject IDs corresponding to genes in the “Metabolism of terpenoids and polyketides” pathway within the KEGG data base are shown in Table S4, and the protein interaction network diagram for the metabolism of terpenoids and polyketides is shown in Figure S2 and Table S5. Our GO functional distribution statistics indicated that the most represented GO pathway was organelle, with 8,035 annotated genes (Figure 3). The subject IDs corresponding to the genes in the “organelle” pathway within the KEGG database are shown in Table S6. Functional annotation analysis revealed the key genes contributing to terpenoid metabolism and related biological processes. Unigene 10079-S3 was functionally annotated to the pathway involving key enzymes in terpenoid metabolism, including farnesyl-diphosphate farnesyltransferase (GO:0004310), squalene synthase (GO:0051996), and carotenoid biosynthesis (GO:0016117). Furthermore, Unigene10091-S4 was functionally annotated to pathways involving key enzymes in terpenoid and sterol metabolism, including sterol 3-beta-glucosyltransferase activity (GO:0016906) and sterol biosynthetic processes (GO:0016126), highlighting its dual role in membrane lipid modification and secondary metabolite synthesis.
Figure 1
Venn diagram of gene annotations. The Venn diagram of gene annotations illustrates the overlap and uniqueness of gene annotations across four annotation databases: GO (Gene Ontology), KEGG (Kyoto Encyclopedia of Genes and Genomes), TF (Transcription Factor), and NR (Non-Redundant protein database). Pairwise and higher-order overlaps are also represented.
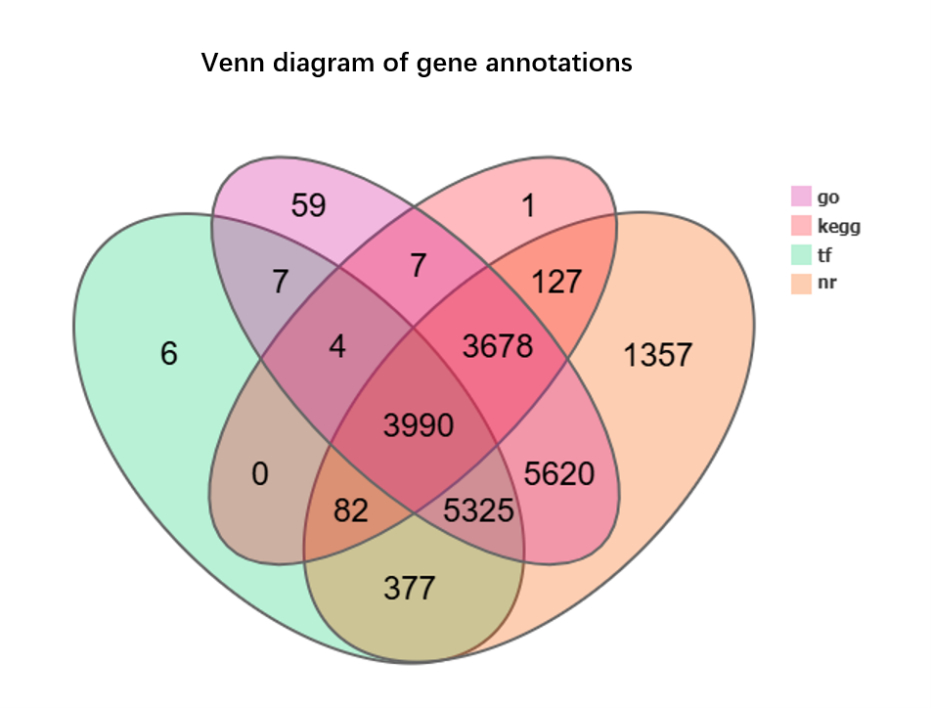
Figure 2
Functional distribution map and species distribution map. KEGG functional distribution statistics reveal that the most enriched KEGG pathway is Carbohydrate metabolism.
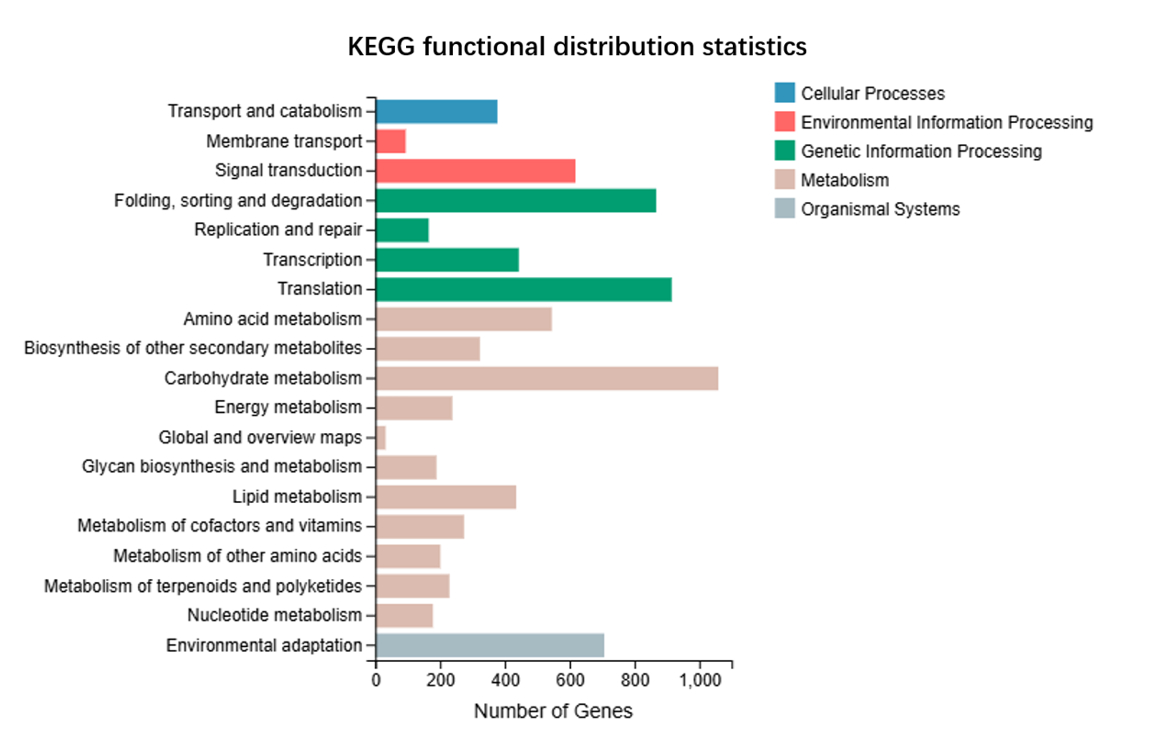
Figure 3
Functional distribution map and species distribution map. GO functional distribution statistics indicate that the most represented GO pathway is organelle.
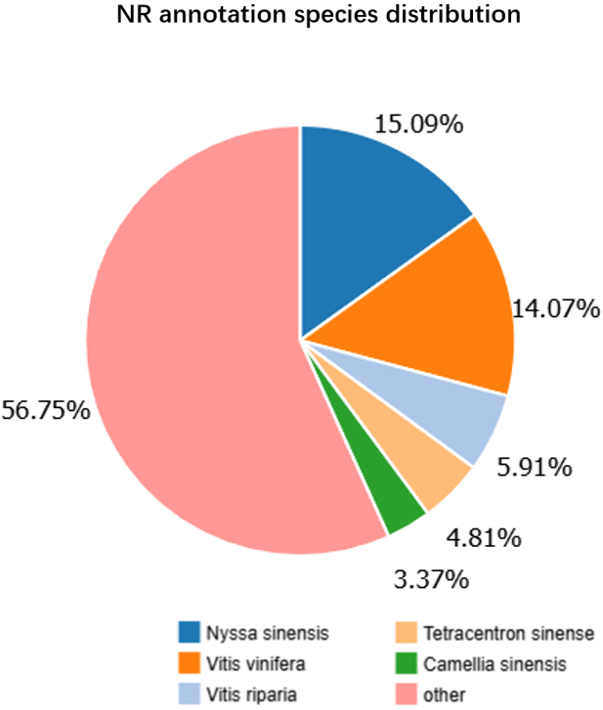
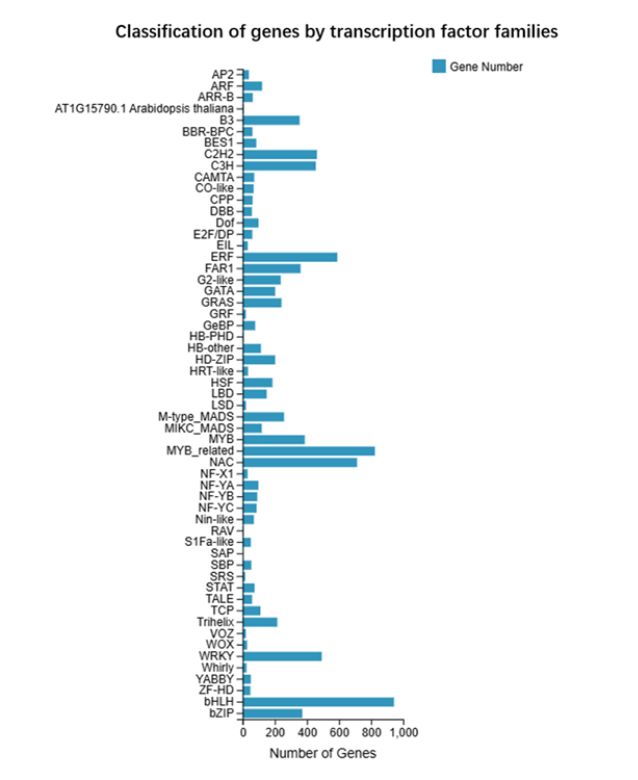
Based on NR annotation results, we calculated the proportion of annotations from different species and generated a species distribution chart. Our NR annotation species distribution indicated that Nyssa sinensis and Vitis vinifera had the highest annotation proportions (Figure 4). The transcription factor families to which the genes belonged were statistically classified as shown in Figure 5. The transcription factor family with the largest proportion of genes was the bHLH transcription factor family, with 943 annotated genes.
. Transcriptome quantitative analysis
Through transcriptome-based gene quantification analysis, we identified 64,752 unigenes common to both the experimental and control groups, with 19,840 unigenes specific to the experimental group and 9,896 unigenes unique to the control group (Figure S3A). An expression level density plot was generated based on fragments per kilobase of transcripts per million mapped reads for each sample. The gene expression levels roughly followed a normal distribution, indicating a typical gene expression pattern (Figure S3B). The results of this sequencing were satisfactory and met our expectations. Additionally, we calculated the Pearson correlation coefficients of gene expression levels between all pairs of samples and visualized the results as a heatmap. The heatmap showed similar gene expression profiles within the experimental and control groups, but significant differences in the overall gene expression patterns between groups (Figure S3C). The clustering and differential gene expression between the experimental and control groups were consistent with our expectations.
. DEG analysis
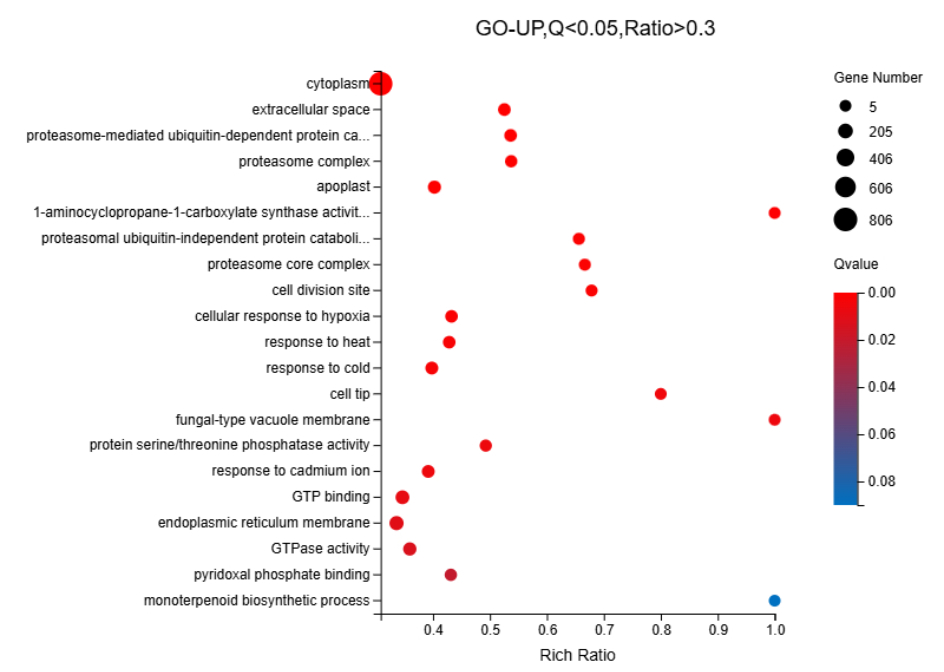
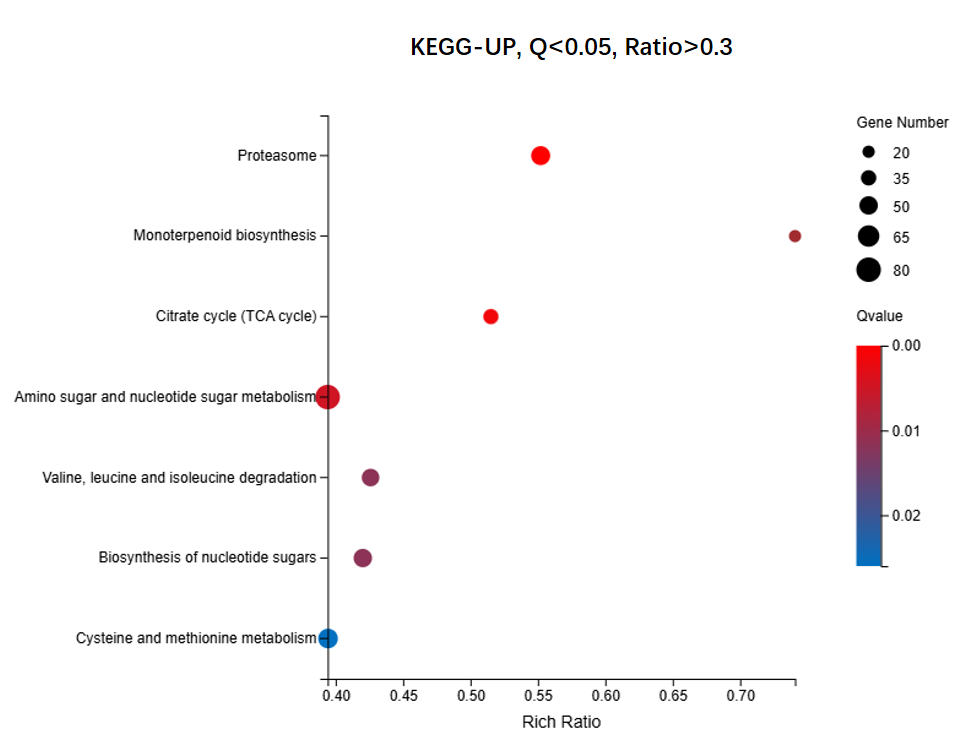
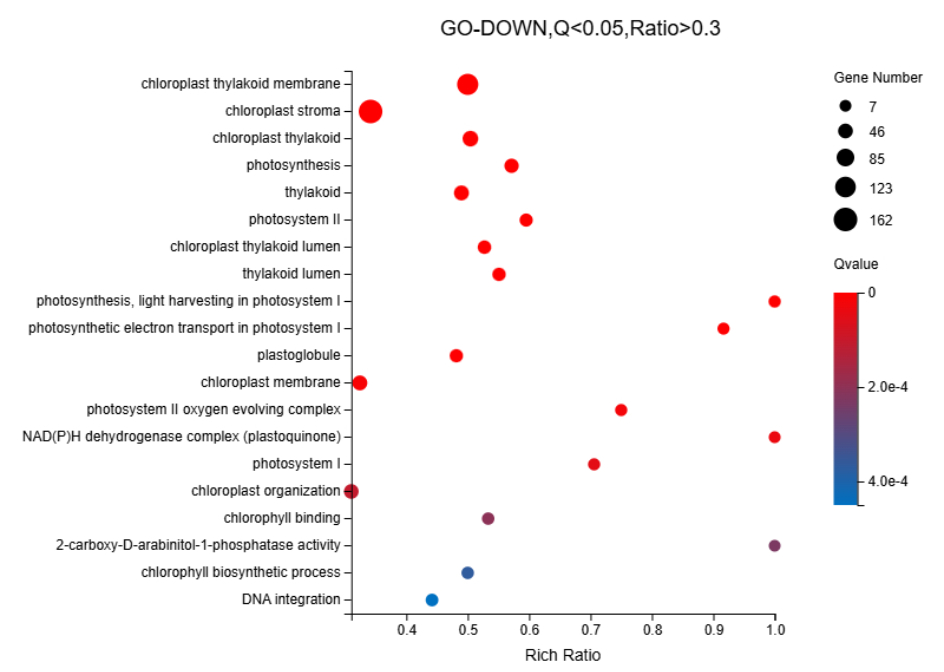
We identified 16,498 upregulated unigenes and selected the top 20 pathways with the smallest Q values for Gene Ontology (GO) enrichment analysis (Figure 6, Table S7). GO analysis of the upregulated genes revealed significant enrichment of cellular components, biological processes, and extracellular regions. The cytoplasm (GO:0005737) showed the highest number of term candidate genes (806 out of 4003), with a rich ratio of 0.31 and a significant p-value of 6.01 × 10⁻¹¹. Other highly enriched terms included the extracellular space (GO:0005615, p = 3.92 × 10⁻¹⁰) and proteasome-mediated ubiquitin-dependent protein catabolic processes (GO:0043161, p = 3.44 × 10⁻¹⁰). Enrichment analysis highlighted the proteasome complex and apoplast as key cellular components. Notably, although the “Monoterpenoid biosynthetic process” pathway was not among the top 20 pathways, it had a Q value < 0.1 and aligned with previous gene annotation results as well as subsequent KEGG enrichment findings. Consequently, it was included as the 21st enriched pathway in the GO-UP figure. For KEGG enrichment analysis of the upregulated genes, seven pathways with Q values < 0.05 were identified (Figure 7, Table S8). Pathway enrichment analysis using KEGG demonstrated a strong association with Proteasome-related processes (ko03050, p = 8.97 × 10⁻⁹) and Monoterpenoid biosynthesis (ko00902, p = 6.45 × 10⁻⁷). The Citrate cycle (ko00020) and amino sugar metabolism pathways were also significantly enriched, with rich ratios of 0.52 and 0.39, respectively. These findings suggested that the upregulated genes were primarily involved in protein degradation, carbohydrate metabolism, and amino acid biosynthesis. For the 9,412 downregulated unigenes, GO enrichment analysis revealed the top 20 pathways with the smallest Q values (Figure 8, Table S9). GO enrichment analysis of downregulated genes indicated significant enrichment in photosynthesis-related components, particularly the chloroplast thylakoid membrane (GO:0009535, p = 1.12 × 10-40, rich ratio = 0.50) and chloroplast stroma (GO:0009570, p = 5.60 × 10⁻²⁶). Additionally, biological processes like photosynthesis (GO:0015979, p = 5.10 × 10⁻¹⁶) and cellular components, such as the thylakoid (GO:0009579), were significantly downregulated. These findings suggested impaired chloroplast activity and reduced photosynthetic function. KEGG analysis revealed eight enriched pathways with Q values < 0.05 (Figure 9, Table S10). KEGG pathway analysis of downregulated genes indicated significant enrichment in pathways associated with Photosynthesis (ko00195, p = 5.81 × 10⁻¹¹) and Antenna proteins (ko00196, p = 2.18 × 10⁻¹⁰). Additional pathways, such as benzoxazinoid biosynthesis and glycosphingolipid biosynthesis, showed moderate enrichment with p-values of 1.85 × 10⁻⁶ and 2.59 × 10⁻⁴, respectively. These results suggested suppression of energy metabolism in the downregulated genes.
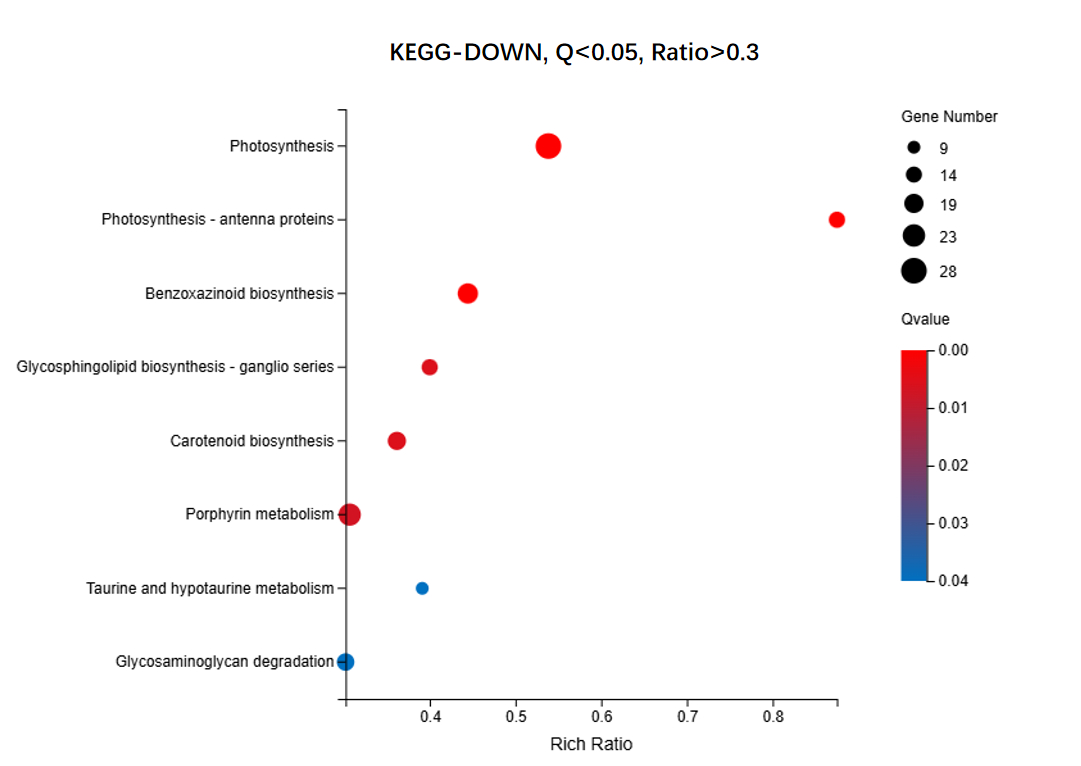
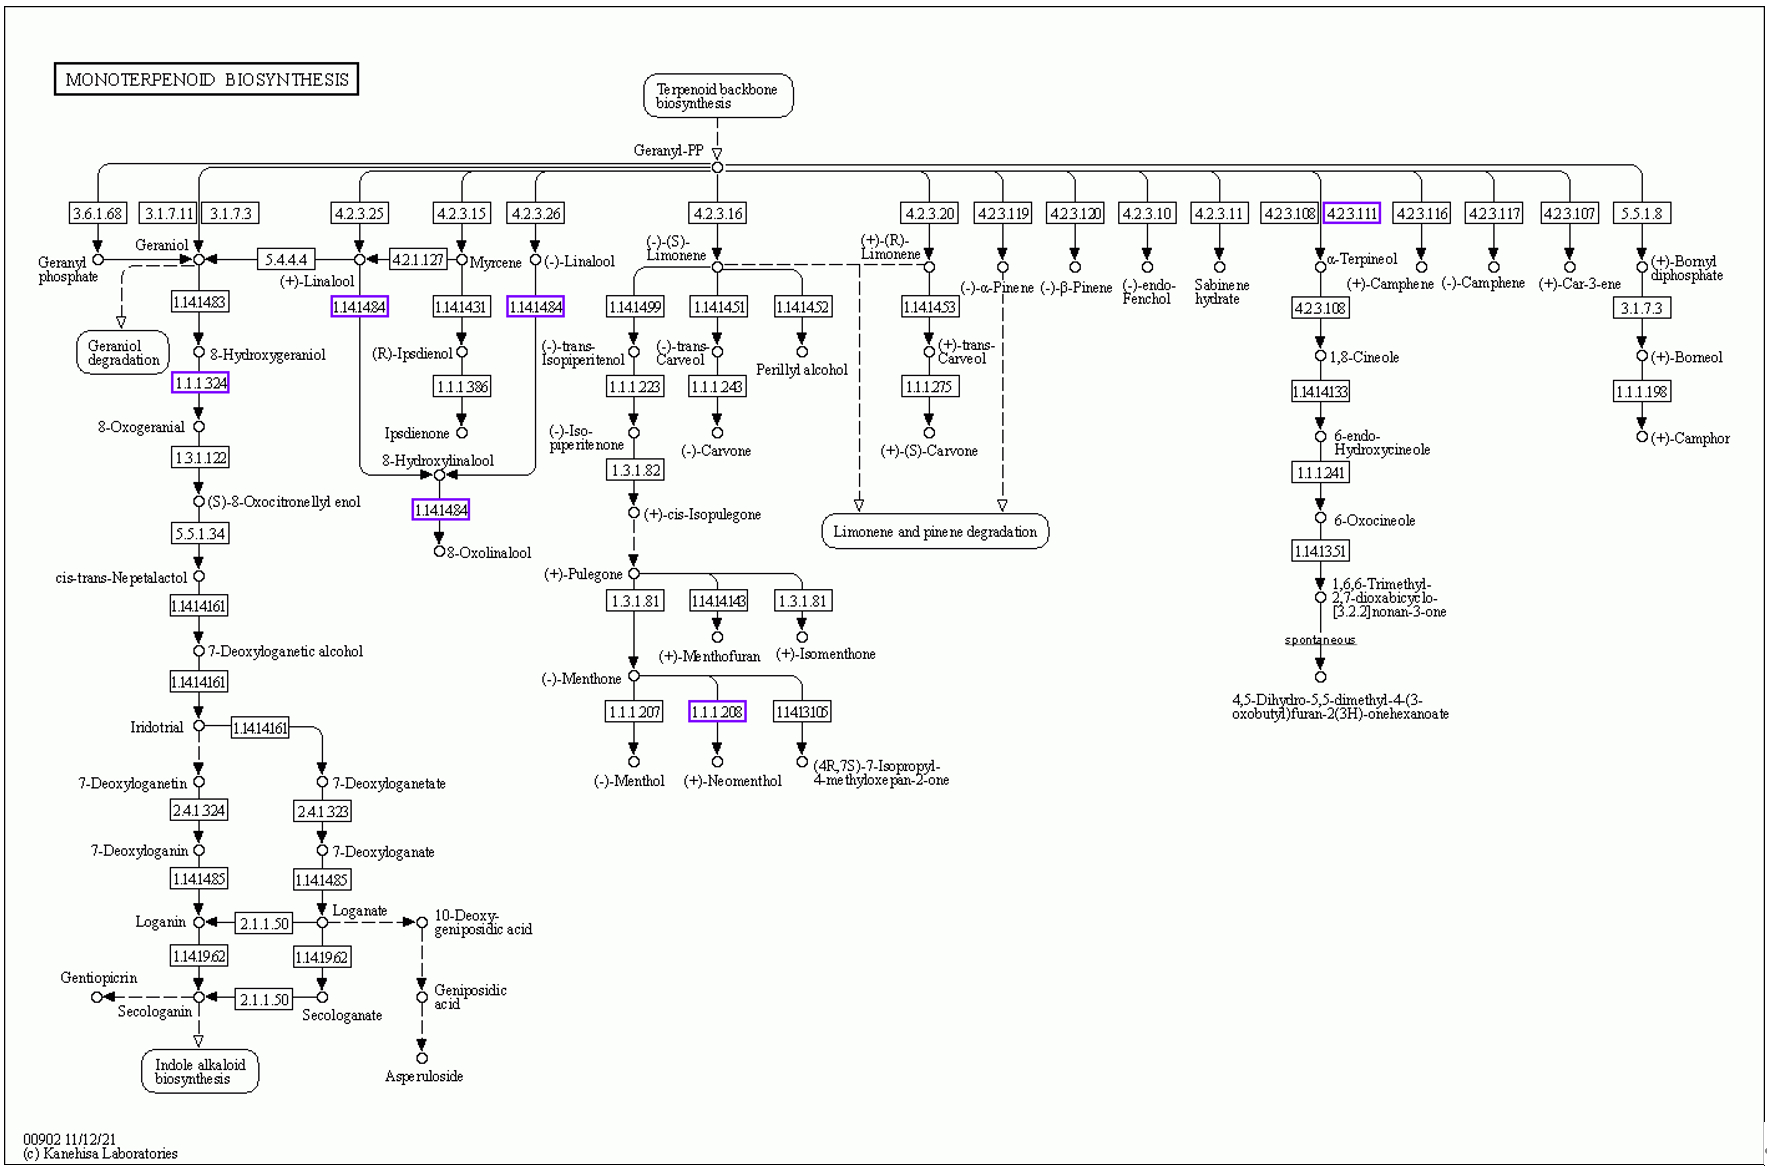
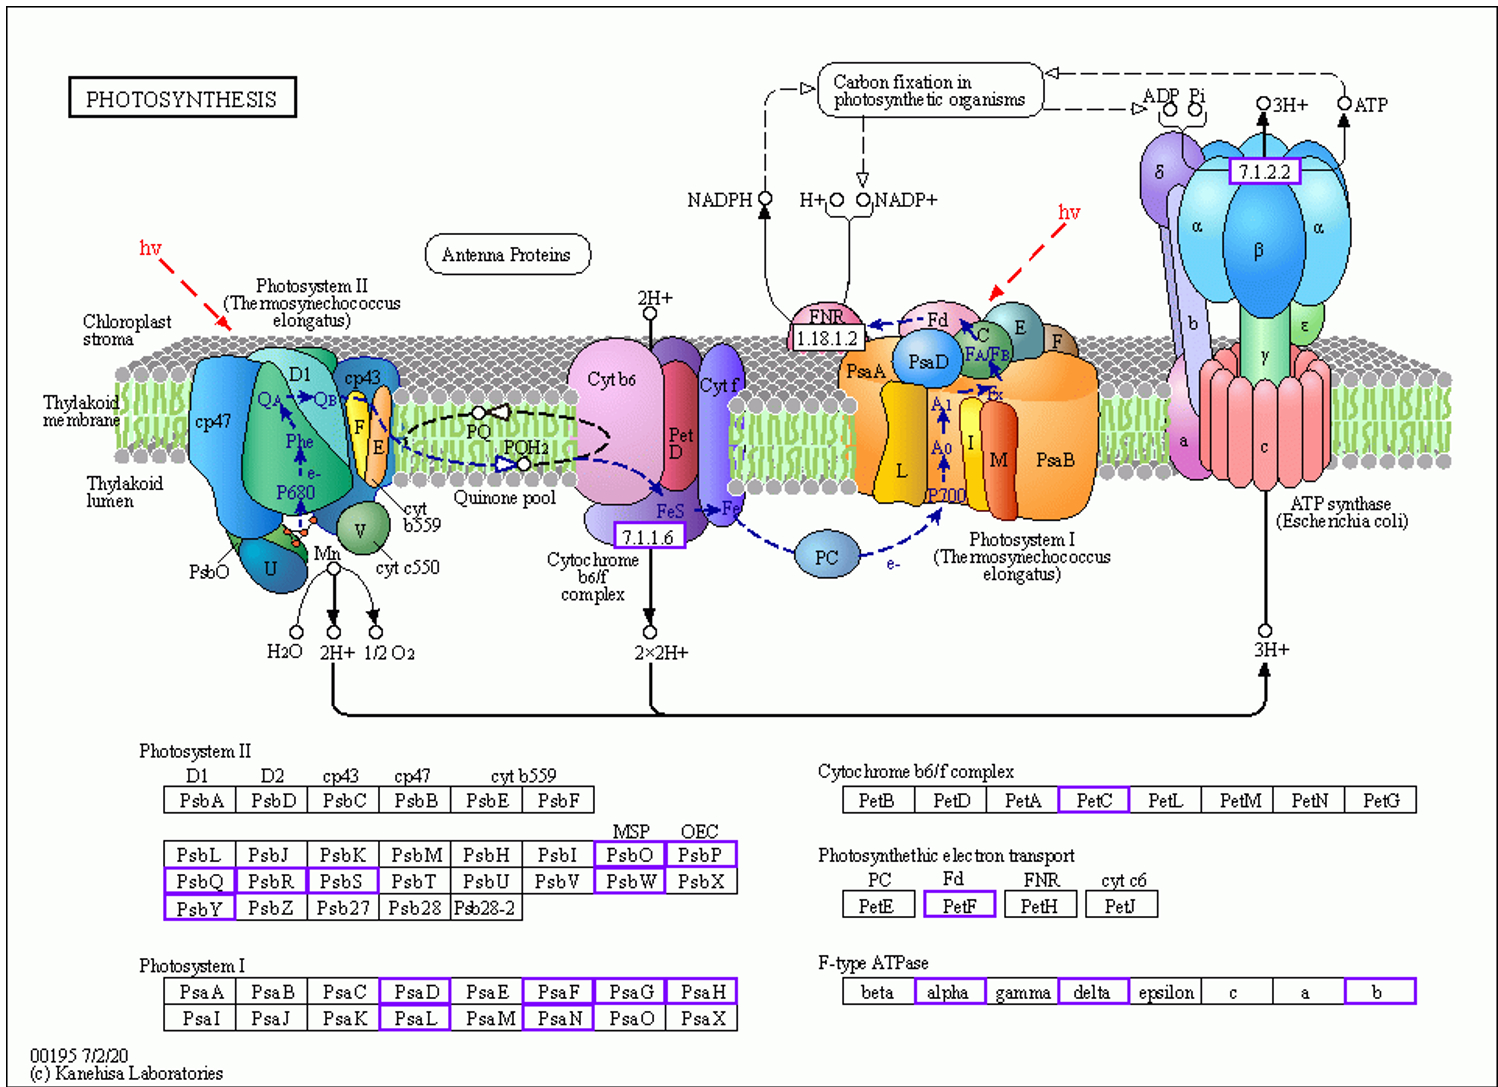
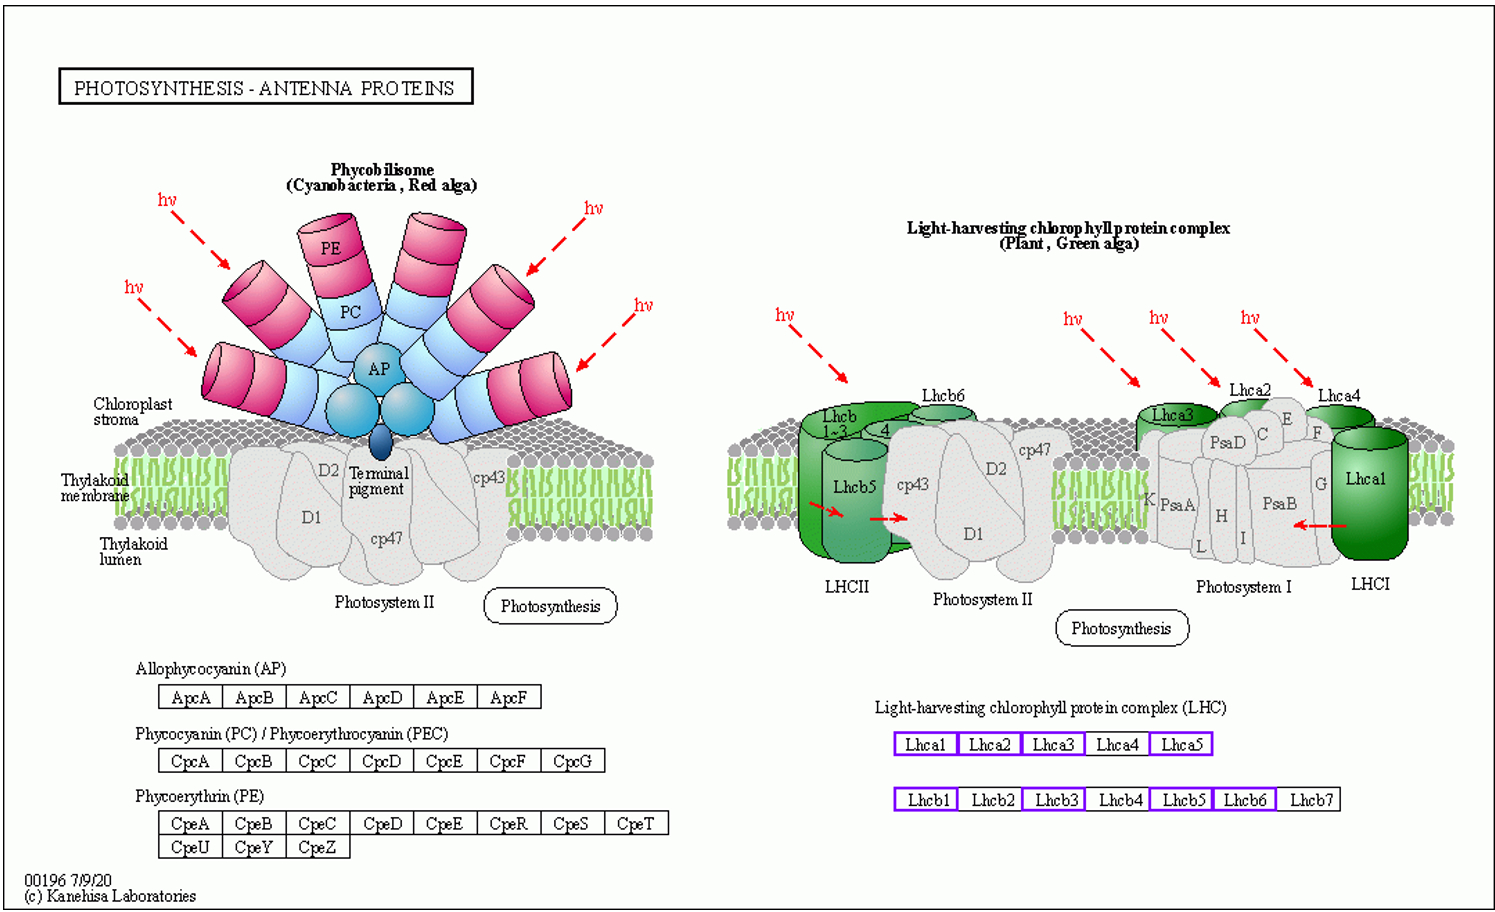
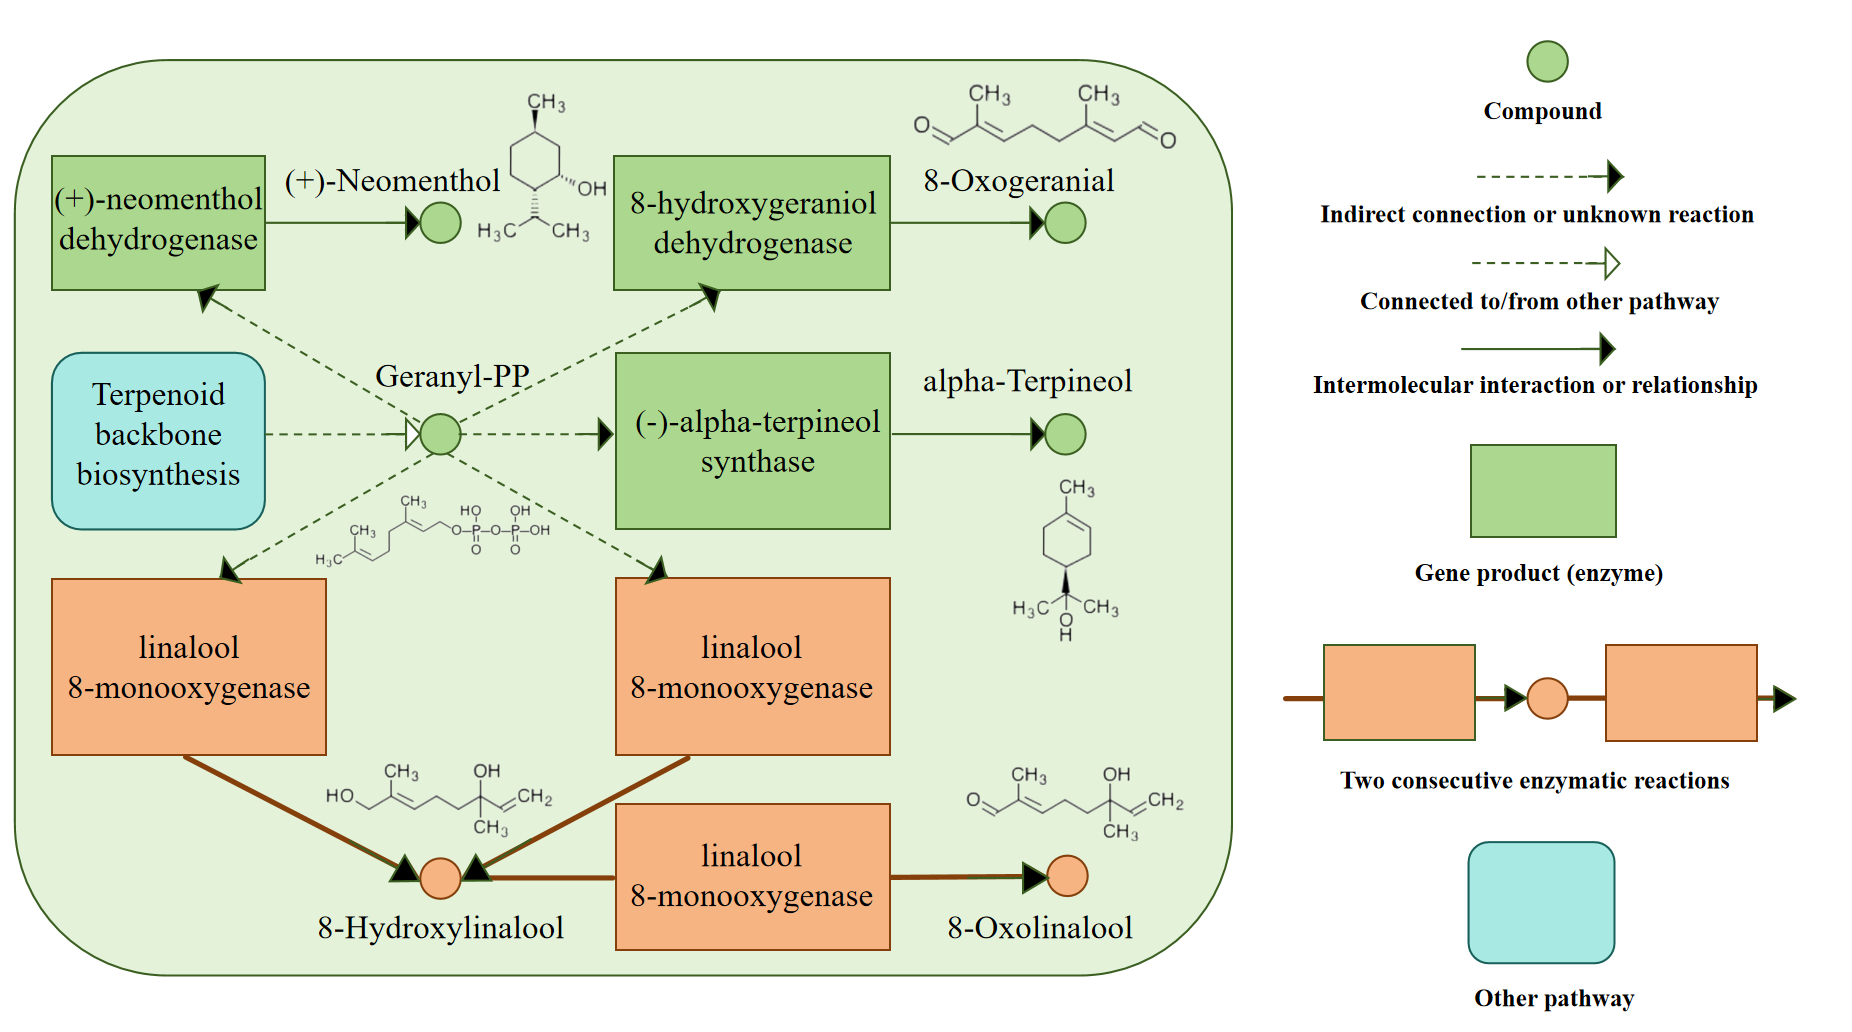
The enzymes upregulated during monoterpenoid biosynthesis are shown in Figure 10. These are highlighted in blue boxes. The related unigenes and additional information for [EC 1.1.1208], [EC 1.1.1324], [EC 1.14.14.84], and [EC 4.2.3.111] are presented in Table S11. In the GO-DOWN and KEGG-DOWN DEG analyses, numerous pathways related to the downregulation of photosynthesis were identified. The relevant pathways obtained from the GO-DOWN DEG analysis included GO:0009535, GO:0009570, GO:0009534, GO:0015979, GO:0009579, GO:0009523, GO:0009543, GO:0031977, GO:0009768, GO:0009773, GO:0010287, GO:0031969, GO:0009654, GO:0010598, GO:0009522, GO:0009658, and GO:0016168. Among the top 20 enriched pathways, only two were not directly related to the downregulation of photosynthesis. In KEGG-DOWN DEG analysis, the top two enriched pathways were ko00195 and ko00196. The ko00195 pathway is involved in photosynthesis (Figure 11). The unigenes associated with the two downregulated enzymes and 18 structural proteins are presented in Table S12. The ko00196 pathway corresponds to photosynthesis-antenna proteins (Figure 12), and its downregulation is attributed to the decreased expression of components of the light-harvesting chlorophyll protein complex, specifically Lhca1, Lhca2, Lhca3, Lhca5, Lhcb1, Lhcb3, Lhcb5, and Lhcb6. The downregulated expression of unigenes associated with each component of the light-harvesting chlorophyll protein complex, along with additional information, is presented in Table S13.
In this study, we annotated the DEGs transcripts. The upregulated DEGs were enriched in pathways related to monoterpenoids, including the monoterpenoid biosynthetic process (GO:0016099) and Monoterpenoid biosynthesis (ko00902). In contrast, the downregulated DEGs were primarily associated with photosynthesis-related pathways, encompassing terms, such as chloroplast thylakoid membrane (GO:0009535), chloroplast stroma (GO:0009570), chloroplast thylakoid (GO:0009534), photosynthesis (GO:0015979), thylakoid (GO:0009579), photosystem II (GO:0009523), chloroplast thylakoid lumen (GO:0009543), thylakoid lumen (GO:0031977), photosynthesis, light harvesting in photosystem I (GO:0009768), photosynthetic electron transport in photosystem I (GO:0009773), plastoglobule (GO:0010287), chloroplast membrane (GO:0031969), photosystem II oxygen evolving complex (GO:0009654), NAD(P)H dehydrogenase complex (plastoquinone) (GO:0010598), photosystem I (GO:0009522), chloroplast organization (GO:0009658), chlorophyll binding (GO:0016168), chlorophyll biosynthetic process (GO:0015995), as well as Photosynthesis (ko00195) and Photosynthesis - antenna proteins (ko00196).
. SSR detection
We performed SSR detection of the unigenes and designed primers for each SSR. The length characteristics of the SSRs are shown in the SSR length statistics (Table S14), and the results of primer design are provided in the SSR primer design (Table S15). Combined with the previous work (Yin et al., 2018), this study, provides data to support SSR research on plants of the family Hamamelidaceae for assessing genetic diversity in D. racemosum and potentially numerous other Hamamelidaceae taxa. These loci will aid in future conservation genetics efforts across the family.
. RT-qPCR
The results showed that the expression of these six genes, including Unigene15193-S3, Unigene16224-S4, Unigene51085-S3, Unigene2103-S3, Unigene20832-S2 and Unigene44219-S5, was consistent with the expression patterns of the RNA-seq data. The expression levels of these genes showed the same trend in the results of RNA-Seq and qPCR (Figure S4, Table S16). Further quantitative correlation analysis revealed that a strong positive correlation rate (R2 = 0.97) was obtained using linear regression analysis (Figure S5), suggesting that the transcriptome data were reliable. The core finding of this article is based on the RNA-Seq results. Verifying the reliability of RNA-Seq via qPCR offers additional assurance for subsequent analyses grounded in RNA-Seq data.
. Discussion
Based on KEGG annotation, a protein interaction network for the metabolism of terpenoids and polyketides diagram was constructed (Figure S2). The core genes of the protein interaction network were Unigene41013-S3 and Unigene35068-S1, both of which were functionally annotated to KEGG entry: K00787, named FDPS, which is defined as farnesyl diphosphate synthase [EC 2.5.1.1 2.5.1.10]. It also plays an important role in terpenoid synthesis in jujubes (Ziziphus jujuba) (Wen et al., 2023). The FDPS gene can regulate plant development and various biological processes and promote the synthesis of secondary metabolites, such as terpenoids and sterols (Wen et al., 2023; Poulter, 2006).
Our NR annotation of species distribution indicated that V. vinifera had the high annotation proportions. Interestingly, terpenoids have also attracted considerable attention in V. vinifera. Terpenoids are among the most important constituents of grape flavor and wine bouquets (Data available: http://urgv.evry.inra.fr/FLAGdb) (Martin et al., 2010). Terpenoid pheromones play significant roles in insect pheromone blends (Boncan et al., 2020; Rebholz et al., 2023; Yang et al., 2025). During gall formation in D. racemosum, the plant may regulate insect behavior through terpenoid-derived volatile compounds.
In plants, bHLH is the second-largest transcription factor family following MYB, with diverse biological functions, including the regulation of plant growth and development, responses to abiotic stress, and metabolic networks (Feller et al., 2011). In our study, the transcription factor family with the largest proportion of genes was the bHLH family with 943 annotated genes (Figure 5). The bHLH transcription factor family in the model plant Arabidopsis has been relatively well studied (Gao & Dubos, 2024). These studies established that the bHLH transcription factor family regulates stomatal development in Arabidopsis. From bryophytes to dicots, the stomatal developmental pathway in land plants relies on a conserved bHLH-mediated regulatory module (Chang et al., 2023). We inferred that during gall formation in D. racemosum, the bHLH transcription factor family may also influence metabolic homeostasis by modulating stomatal development at gall sites.
Elevated expression of secondary metabolites is a prominent feature of galls compared to that in normal leaves. For instance, the phenolic content was significantly higher in the galls than in the healthy leaves of Hamamelis japonica (Mizuki et al., 2024), while benzofuran-type and dibenzofuran-type phytoalexins were highly accumulated in the galls of Parrotia subaequalis (Zhou et al., 2025). By regulating the levels of plant secondary metabolites or antagonizing the gene expression of other products involved in gall formation, it may be possible to effectively inhibit gall development and control insect pests (Desnitskiy et al., 2023; Nabity et al., 2013; Pang et al., 2021; Yamaguchi et al., 2012). In the GO-UP DEG analysis, the “monoterpenoid biosynthetic process” pathway was identified, whereas in the KEGG-UP DEG analysis, the “monoterpenoid biosynthesis” pathway was enriched. The Rich Ratios for these monoterpenoid-related pathways were both close to 1 (100%). Plants are the direct source of most terpene compounds. Monoterpenoids have significant ecological value, aiding in plant defense against animals (Fan et al., 2023). In the present study, the differential expression of terpenoid compounds at the transcriptional level may have resulted from the stress response of leaves to biological stimulation by gallers. In Semiliquidambar cathayensis (Hamamelidaceae), a phylogenetically related species to D. racemosum, transcriptomic analysis revealed constitutive expression of monoterpenoid biosynthesis genes across leaf, stem, and root tissues (Tian et al., 2022). While this study focused on basal metabolic regulation rather than stress-induced responses, the widespread expression of monoterpenoid-related genes suggests that Hamamelidaceae plants may inherently possess a robust genetic framework for monoterpenoid production. Of particular interest is [EC 4.2.3.111], (-)-α-terpineol synthase, which plays a critical role in terpenoid biosynthesis (Lücker et al., 2004; Martin & Bohlmann, 2004). In our study, we identified the DEGs associated with [EC 4.2.3.111], namely Unigene33316-S5, Unigene33318-S5, and Unigene33320-S5.
Based on the differential expression annotation, we identified the upregulation of core metabolic pathways related to monoterpenoid biosynthesis in galled leaves (Figure 13). Notably, we observed the upregulation of linalool 8-monooxygenase. Linalool 8-monooxygenase catalyzes two critical consecutive enzymatic reactions during monoterpenoid biosynthesis. These reactions convert 8-hydroxylinalool into 8-oxolinalool, thereby exerting cascading effects on the entire metabolic network. However, no studies have specifically investigated linalool 8-monooxygenase in plant biotic stress responses. Additionally, three other enzymes involved in monoterpenoid biosynthesis, specifically (+)–neomenthol dehydrogenase, 8-hydroxygeraniol dehydrogenase, and (–)–α-terpineol synthase, exhibited upregulated expression levels. These three enzymes utilize substrates derived from downstream metabolites of geranyl-PP. Geranyl-PP is a pivotal product in terpenoid backbone biosynthesis (Kanehisa Laboratories, 2023).
Through DEG analysis, we observed downregulation of gene expression in D. racemosum associated with numerous pathways involved in photosynthesis. Downregulation of photosynthetic capacity in galled leaves is a relatively common phenomenon in Litsea acuminata, Glochidion obovatum, Eurya japonica, and Artemisia montana (Huang et al., 2015). The downregulation of photosynthesis-related pathways is not associated only with nutrient availability; under biotic stress, downregulation of photosynthesis-related genes is part of the plant defense response (Bilgin et al., 2010). Significantly downregulated photosynthesis-related pathways, along with the expression of terpenoid-related compounds, may constitute an integrated aspect of the complex defense strategies in plants. Further, the activation of floral organ genes by galls suggests that gall formation may co-opt genetic programs from plant reproductive development to promote cell proliferation or redirect metabolic pathways, thereby establishing passive sink organs that facilitate nutrient storage and provide shelter for parasites (Takeda et al., 2024). Based on our findings, we speculate that the transcriptional downregulation of photosynthesis-related pathways in galls results from multiple factors, including the transformation of galls into sink organs and the reallocation of carbon resources to secondary metabolites.
Thus, our study indicated that under insect-induced stress, D. racemosum allocated carbon resources to production of secondary metabolites rather than maintaining photosynthesis. The carbon metabolism in D. racemosum leaves undergoes significant alterations during gall formation. Carbon resources are preferentially allocated for synthesizing enzymes involved in terpenoid metabolism, such as (+)–neomenthol dehydrogenase, 8-hydroxygeraniol dehydrogenase, (–)–alpha-terpineol synthase, and linalool 8-monooxygenase, leading to marked upregulation of the entire terpenoid biosynthesis pathway. Conversely, fewer resources are directed toward photosynthesis-related structural proteins or subunits, including Lhca (Lhca 1, 2, 3, 5), Lhcb (Lhcb 1, 3, 5, 6), and the structural proteins of photosystems I and II, resulting in significant downregulation of photosynthetic pathways.
. Conclusions
This study provides insights into the transcriptional responses of D. racemosum leaves to gall formation. We identified 104,537 unigenes and functionally annotated them using multiple databases. Transcriptome sequencing and DEG analyses revealed significant downregulation of photosynthesis-related genes in galled leaves, indicating a reduction in photosynthetic activity. In contrast, genes associated with terpenoid biosynthesis were upregulated, particularly within pathways related to monoterpenoid biosynthesis. These results highlight the integration of energy production and defense strategies in D. racemosum during gall formation. Metabolomic studies reveal that Distylium buxifolium (Hamamelidaceae) produces high levels of jasmonic acid, which provides resistance against gall parasitism, whereas D. racemosum (Hamamelidaceae) does not exhibit such a significant level of elevated jasmonic acid production (Zhang et al., 2024). Why has D. racemosum evolved to prioritize terpenoid biosynthesis over the more potent jasmonic acid pathway as a response to gall parasitism? A deeper exploration of terpenoid-mediated modulation of plant-galler interspecific relationships will be a critical research focus moving forward.
. Supplementary material
The following supplementary material is available for this article:
Appendix S1. The steps used for cDNA synthesis and q-PCR.
Figure S1. Length distribution of unigenes.
Figure S2. Protein interaction network diagram for the metabolism of terpenoids and polyketides. The core genes of the protein interaction network are Unigene41013-S3 and Unigene35068-S1, both of which were functionally annotated to KEGG Orthology Entry: K00787, named FDPS, defined as farnesyl diphosphate synthase [EC 2.5.1.1 2.5.1.10]
Figure S3. (A) Venn diagram showing the differentially expressed genes between the experimental and control groups; (B) density plot of gene expression levels based on Fragments Per Kilobase of transcript per Million mapped reads (FPKM) for each sample. The X-axis represents log2 (FPKM+1), and the Y-axis represents gene density, which is the proportion of genes at each expression level relative to the total number of expressed genes; (C) heatmap of gene expression correlations between samples.
Figure S4. Amplification fold-change of six genes.
Figure S5. Correlation rate between relative expression in the transcriptome and RT-qPCR.
Table S1. Quality statistics of filtered reads.
Table S2. Quality metrics of the clustered unigenes.
Table S3. Criteria for Differentially Expressed Genes DEGs Selection and Enrichment Analysis Parameters.
Table S4. Subject IDs corresponding to genes in the Metabolism of terpenoids and polyketides pathway within the KEGG data base.
Table S5. Protein interaction network diagram for the metabolism of terpenoids and polyketides.
Table S6. Subject IDs corresponding to genes in organelle pathway within the GO data base.
Table S7. Differentially expressed gene analysis of GO-UP.
Table S8. Differentially expressed gene analysis of KEGG-UP.
Table S9. Differentially expressed gene analysis of GO-DOWN.
Table S10. Differentially expressed gene analysis of KEGG-DOWN.
Table S11. Enzymes upregulated in monoterpenoid biosynthesis KEGG-UP.
Table S12. Downregulated expression related to photosynthesis pathways KEGG-DOWN.
Table S13. Downregulated expression related to photosynthesis – antenna proteins pathways KEGG-DOWN.
Table S14. SSR length statistics.
Table S15. SSR primer design table.
Table S16. Comparison of RT-qPCR and RNA-Seq.
