. Introduction
Fritillaria imperialis L. (crown imperial and imperial fritillary) is a crucial bulbous plant belonging to Liliaceae. It has a wide natural spread over large geographical areas, including Anatolia, Pakistan, the Kashmir region, Iran, northern Iraq, and Afghanistan (Tekşen & Aytaç, 2014). The genus Fritillaria has a global total of 167 species, 43 of which grow in Anatolia and 19 of which are endemic (Zeylanov et al., 2012). Fritillaria imperialis, popularly known as “inverted tulip, crying bride,” is generally grown in the cities of Adıyaman, Bingöl, Bitlis, Elazığ, Gaziantep, Hakkari, Kahramanmaraş, Kayseri, Malatya, Muş, Siirt, Şırnak, Tunceli, and Van in Anatolia.
This plant grows on bushes and rocky slopes from 1,000 m to 2,500 m. In Anatolia, it is used as a decorative plant, especially in the Van region, for mystical purposes (Alp et al., 2009). Fritillaria imperialis is widely used in traditional medicine (for rheumatism, bronchitis, asthma, cough, diuretics) and pharmacies because of its steroidal alkaloids, such as impericine (Al-Snafi, 2019). Previous research has demonstrated that it has great potential as the main active ingredient or additive ingredient for modern pharmaceuticals owing to its primary and secondary metalloids (Al-Snafi, 2019).
Fritillaria imperialis has a stem length of up to 1 m. Two-thirds of the stem has plenty of leaves, while 1/3 of the stem is leafless. There is a leaf bunch at its apex, consisting of thin lanceolate leaves above the flowers. The mouth is directed downward, bell-shaped at the top of the stem, and comprises five–nine units. It blooms from April to May. It is a prevalent and preferred bulbous plant because of the beauty of its flowers, which range in color from yellow to orange. However, the most characteristic feature of the plant is its unpleasant odor (Demir, 2019). The bases of the flower petals are white, with pearl-like glands that secrete nectar. The fruit is capsule type, 2 cm in diameter, with three parts, and winged. The seeds are flat and tightly stacked in the fruit compartments. The bulbs of this species have an average diameter of 8 cm. It consists of two-layered, fleshy, and scale-shaped leaves, with an outline of the stem in the middle. Protective bulbus skin is thin and sensitive to damage and water loss (Alp, 2006).
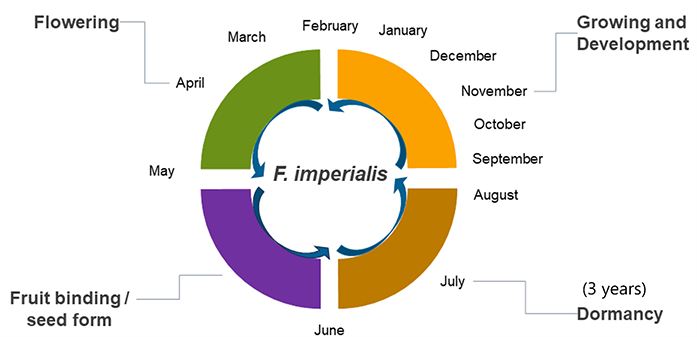
As a perennial bulbous plant, the vegetation period of the plant is approximately 4–5 years. The plant begins the “dormancy period” in late June and early July and remains in this period for a minimum of 3 years. At the end of these three years, marked by fall (September to December), the roots are formed first (Khodorova & Boitel-Conti, 2013). This period can be referred to as the “growing and development” period. The body slowly develops underground and remains in this state during the winter (Alp, 2006; Zafarian et al., 2019). During this period, the plant is affected by precipitation and is preparing for the flowering period. Precipitation during this period affects the transition time of the plants to flowering. If the plant receives a low amount of rainfall during this period, the beginning of the flowering period may be delayed (i.e., 1 year). The “flowering period” begins in February. The flowering period is the process when the plant blossoms and creates seeds. It is dependent on altitude, region, and climate conditions, which vary from March to May (Alp, 2006; Zafarian et al., 2019). During this period, precipitation, especially temperature, affects plant flowers. The maximum temperature that the plant experienced during this period was the highest temperature to bloom. The plants move to the seeding stage after blossoming, and the leaves begin to produce storage nutrients required for seeds through photosynthesis. This period is called “fruit binding/seed form,” and it continues from mid-May to the end of June (Zafarian et al., 2019).
Fritillaria imperialis is ecologically and economically valuable. As with many bulbous plants, F. imperialis populations are resistant to various stress conditions and can easily adapt to harsh habitats (high mountain peaks, rocky areas, etc.) (Atay, 1996). However, there are no data on how populations of this species react to changing climatic conditions. From this point on, it was thought that this species could be an indicator of climate change in bulbous plants owing to its wide geographical distribution in Anatolia. Therefore, this study investigated the effects of climate change on the geographical distribution of F. imperialis.
This study aimed to determine how F. imperialis would be affected by climate change and forecast its future spatial distribution through climate projections. It is also within the scope of this research to compare the current spatial plant distribution with the results of this study, and comment on the causes of possible spatial suitability changes. In order to assess future climatic suitability, this study utilized Ecocrop-based plant climate suitability modeling (Eitzinger et al., 2014).
Ecocrop is a database developed by the Food and Agriculture Organization of the United Nations (FAO) in 1992 that is primarily used to determine the suitability of a crop for a specified environment. This tool can be used for crops in any region by adjusting the required climatic parameters as it already contains a library of the environmental requirements for numerous crops and species. Although this database has been inactive (offline) for several months, the entire dataset of these ecological requirements libraries was archived by the authors 2 years ago. Readers can access these libraries using the R-tool (ecocrop: Ecocrop Model, 2022).
An assessment of a crop’s climatic adaptability could aid in the development of climate change adaptation strategies (Kim et al., 2018). The plant climate suitability modeling (PCSM) utilizes FAO’s Ecocrop database of the environmental requirements of a long list of plant species, which can aid in evaluating possible crops to grow in a specific environment. The mapping and spatial assessment of the agro-ecological suitability of specific crops can be performed using this model. Ecocrop modules in software such as DIVA-GIS and TerrSet (PCSM model integrated) are used to estimate the adjustment of a specific crop considering the temperature and rainfall thresholds over a geographic region. The model processes the suitability index for temperature and precipitation differently and finally obtains the final suitability score by combining temperature and precipitation suitability scores (Pawar-Patil & Mali, 2015).
Turkey is in an important position in terms of geographic potential because of its location at the intersection of three different gene centers (Iran-Turano, Siberia, and Mediterranean). Therefore, the results of this study will be an essential step in providing an idea of how other geophyte species may be affected by climate change. Furthermore, this study contributes to future studies using plant climate suitability models for the sustainable use of gene resources.
. Material and Methods
. General Description of the Methodology
This study aimed to assess the climate suitability changes in the current plant distribution of F. imperialis under future temperature and precipitation changes. The methodology is summarized in three steps:
Spatial and environmental database development;
Determination of plant temperature and precipitation requirements;
Ecocrop plant climate suitability modeling (PCSM).
All of these steps are explained in further subsections in detail. In this study, Terrset software (Eastman, 2016) was used for PCSM; ArcGIS Pro v2.8 of Environmental Systems Research Institute (ESRI) (Environmental Systems Research Institute, 2022) was used to map the results.
. Spatial and Environmental Database Development
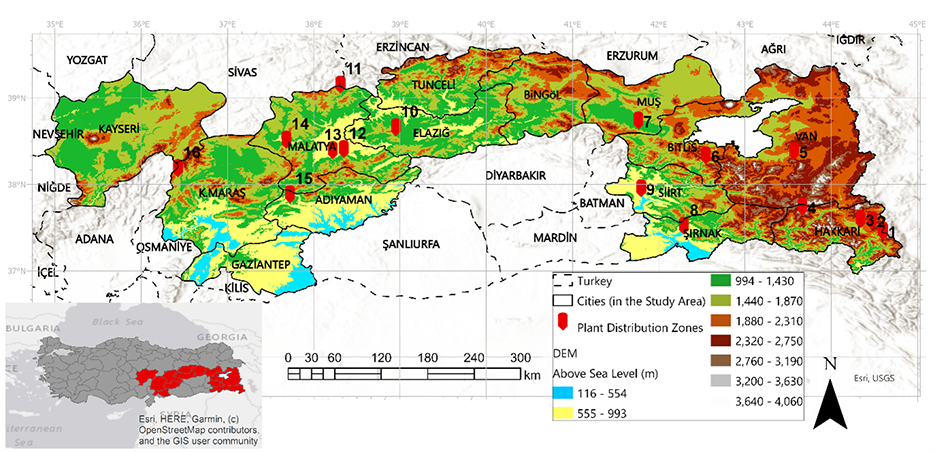
The study area was selected based on the distribution zones of plants in Turkey. The plant distribution zones indicated by Davis (1964–1985) were digitized for this study (plant distribution zones in Figure 1). In this study, digital elevation model (DEM) data were obtained to understand the altitudinal range of the plant. The ASTER DEM images from 2015 were retrieved from https://lpdaac.usgs.gov, produced by the United States National Aeronautics and Space Administration (NASA) and the Ministry of Economy, Trade, and Industry (METI) of Japan (METI) in raster format with 30 m spatial resolution (Earthdata Search, 2022, search term: “ASTER Global Digital Elevation Model”). The plant distribution zones are also shown in the DEM images in Figure 1.
Two types of climate data were used in the study:
Weather station data – Turkish State Meteorological Service (TSMS) (https://mgm.gov.tr/eng/about.aspx): It was used to determine the temperature and precipitation demands of F. imperialis species.
Grid climate data – WorldClim (https://www.worldclim.org/): To determine how F. imperialis will be affected by future temperature and precipitation changes, this grid dataset has been integrated into PCSM as a current and future climate dataset.
Weather station data – TSMS: In the determination of temperature and precipitation requirements of the plant, the data of the (i) monthly average minimum temperature (°C), Tmin; (ii) monthly average maximum temperature (°C), Tmax; and (iii) monthly total precipitation (mm) Ptot for 12 months were obtained from the meteorological stations of the TSMS for the natural distribution area of the plant between 1950 and 2019 (https://mgm.gov.tr/eng/about.aspx).
Grid climate data – WorldClim: Temperature and precipitation data were obtained from the WorldClim database climatic data collection (Hijmans et al., 2005). The downloaded data had a 1-km spatial resolution, which can be used for regional studies. WorldClim has average monthly climate data for minimum, mean, and maximum temperatures and precipitation for current and future conditions. RCP 8.5 was selected in this study as the representative concentration pathway (RCP), the concentration pathways used in IPCC AR5 (Met Office, 2018). RCP 8.5 will aid in determining what kind of resistance F. imperialis will have under extreme future climate conditions with the increased greenhouse effect.
The temperature and precipitation parameters for current conditions (interpolations of observed data, representative of 1960–1990) and future conditions (HADGEM2-ES RCP 8.5, 2070 as an average for 2061–2080) used in this study included: (i) monthly average minimum temperature (°C), Tmin; (ii) monthly average maximum temperature (°C), Tmax; and (iii) monthly total precipitation (mm), Ptot for 12 months of the year.
Figure 1
The locator map of the study area with hypsometric properties. The plant distribution zones indicated by Davis (1964–1985) were digitized for this study.
. Determination of the Plant’s Temperature and Precipitation Requirements
In this study, the plant temperature and precipitation requirements were determined based on the vegetation period of the plant. In Figure 2, the vegetation period of this species is given in detail.
In the study, the station data of temperature and precipitation obtained from TSMS over 4 years (2014–2018) were used to determine this species’ temperature and precipitation requirements. In the vegetation period, the months of the aboveground period of this plant were taken as the basis. TSMS data analysis was used for the Ecocrop database’s plant ecological requirements for temperature [Tmin (absolute minimum temperature average), Topmin (optimal minimum temperature average), Topmax (optimal maximum temperature average), and Tmax (absolute maximum temperature average)]; and precipitation [Pmin (absolute minimum precipitation average), Popmin (optimum minimum precipitation average), Popmax (optimum maximum precipitation average), and Pmax (absolute precipitation average)] (see Results).
. Ecocrop’s Plant Climate Suitability Modeling (PCSM)
In this study, the required input data for Ecocrop PCSM includes:
Plant ecological requirements including Tmin (absolute minimum temperature average), Topmin (optimal minimum temperature average), Topmax (optimal maximum temperature average), and Tmax (absolute maximum temperature average); Pmin (absolute minimum precipitation average), Popmin (optimum minimum precipitation average), Popmax (optimum maximum precipitation average), Pmax (absolute precipitation average), and Tkill (killing temperature; mentioned above) (Aydın, 2015; Aydın & Sarptaş, 2018).
WorldClim climate datasets include the monthly average minimum temperature (°C) Tmin, monthly average maximum temperature (°C) Tmax, and monthly total precipitation (mm) Ptot for 12 months of the year (for both current climate conditions and future climate projections) (Aydın & Sarptaş, 2018).
In this study, the temperature and precipitation requirements of F. imperialis (Tmin, Topmin, Topmax, Tmax, Pmin, Popmin, Popmax, and Pmax) were determined using TSMS data (see Results) and were integrated into the plant climate suitability model. Consequently, spatial climatic suitability was determined for current conditions (interpolations of observed data, representative of 1960–1990) and future conditions (2070 as the average for 2061–2080). The model diagram is shown in Figure 3.
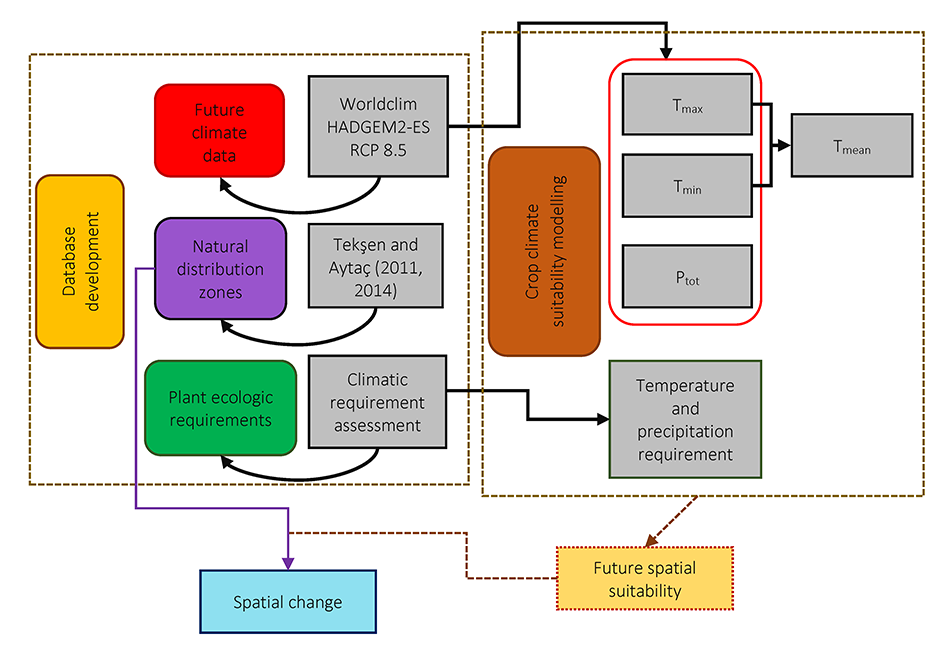
The model integrations are Tmax, Tmean, and Ptot data obtained from the WorldClim database that represents current (interpolations of observed data, representative of 1960–1990) and HADGEM2-ES RCP 8.5’s future conditions (2070 as the average for 2061–2080). The model also includes plant temperature and precipitation requirements in Table 1 (plant ecologic requirements) (Aydın, 2015; Aydın & Sarptaş, 2018).
The model was examined for current distribution zones in the study area. Current and future climate suitability were compared with the current distribution zones of F. imperialis. Additionally, the temporal change in spatial climate suitability in the current plant distribution zones was evaluated based on changes in altitude. Hence, ASTER DEM data were utilized (Figure 1) for the study area.
. Results
. Results of the Temperature and Precipitation Requirements Assessment
The calculated temperature and precipitation requirements of F. imperialis are listed in Table 1.
Table 1
Determined temperature and precipitation requirements of Fritillaria imperialis based on the years between 2014 and 2018.
For example, the months of March and June were used to find temperature parameters as seen in Table 1. Here, Tmin is calculated based on the 4-year average of the minimum temperature in March, which is the first month of the “flowering” period above the ground. Topmin was determined from the average maximum temperature in March (2014–2018) and Topmax from the average maximum temperature in May (2014–2018). Tmax was calculated as the 4-year average of the maximum temperatures in June before the “dormancy” period. These calculations were also performed for precipitation. Pmin was determined based on the total precipitation in September (2014–2018), which is at the beginning of the “growing and development” period. This is because this period occurs before flowering, and precipitation is a directly effective parameter. Popmin was calculated by averaging the total precipitation during January–February–March within the “growing and development” and “flowering” periods. Popmax is the total precipitation during the entire growing season (excluding the flowering period) and is considered to be the optimum maximum precipitation that the plant can withstand during the “flowering” period. Pmax is the sum of the total precipitation over the entire vegetation period.
In these calculations, the purpose of the data from the last four years was to determine the plant’s recent temperature and precipitation requirements.
Since Tmean and soil temperature (Tsoil) are higher than Tkill (−34 °C for the plant) (Zafarian et al., 2019) for the “dormancy” and “growing and development” stages (plant under the soil), the “flowering” stage was assessed to determine the temperature inputs. Plants are primarily affected by atmospheric temperature during the 3rd stage of flowering. The lowest temperature during this period was Tmin, and the highest temperature was Tmax. During the “flowering” period, if the Tmean is below the Tmin, the plant cannot ripen and does not proceed to have a healthy flowering period. If the Tmean is greater than Tmax, the flowers cannot survive. Therefore, it can be concluded that this species is cold-tolerant.
. Results of the PCSM Analysis
The PCSM outputs are given in Figure 4 as the current climatic suitability and in Figure 5 as the future climatic suitability for 2070. Here, suitability is equally classified as
0–0.25: low suitability
0.25–0.50: moderate suitability
0.50–0.75: good suitability and
0.75–1: high suitability.
The current climatic suitability of the plant is entirely compatible with the locations of the current distribution zones (Figure 4). Climatic compatibility was zero in the thirteenth and fourteenth zones in Malatya and the fifteenth zone in Adıyaman. The altitudes of these zones were 1,061, 1,487, and 1,028 m, respectively. In the tenth zone, at an altitude of 1,417 m in Elazığ, the suitability was 12%. In the eighth zone of Şırnak and ninth zone of Siirt, the suitability was 45% and 50%, respectively. These zones have the lowest altitudes (869 m and 610 m, respectively) among the zones. The climatic suitability of the other zones exceeded 70%. In particular, the climatic suitability of zones higher than 2,000 m was between 90% and 100%.
Figure 4
Climatic suitability of Fritillaria imperialis for current conditions (interpolations of observed data, representative of 1960–1990).
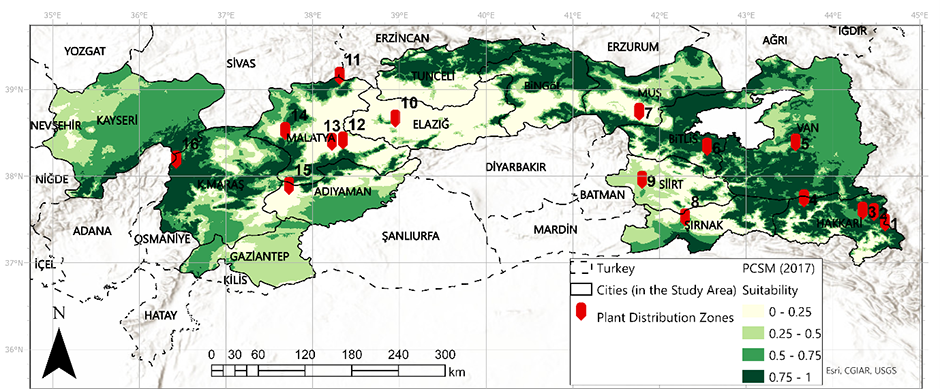
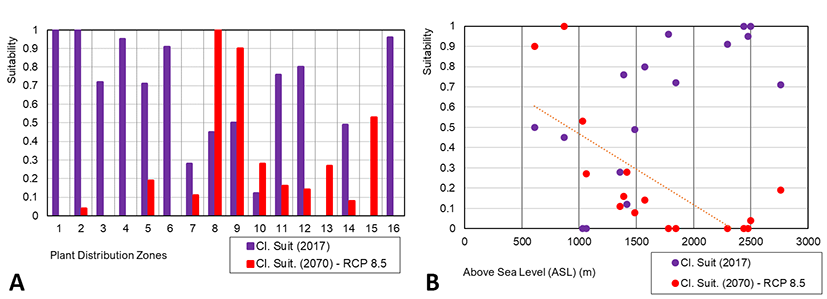
According to future conditions, the spatial climatic suitability of F. imperialis has decreased in many zones (Figure 5). The suitability of the natural distribution zones shifted dramatically from high to low altitudes. The suitability of zones higher than 2,000 m decreased from 100% to almost 0%. The first, second, third, and fourth zones, respectively, in Hakkari are among the highest zones where climatic suitability may decrease to zero by 2070. In the fifth zone of Van Province, which is at the highest altitude among the zones, we expected the suitability to decrease to 19% in 2070, while it was 71% under the current conditions. In the ninth zone in Siirt, where the altitude is the least, the suitability increases from 50% to 90%. The climatic suitability for current and future conditions and the suitability change based on elevation are shown in Figure 6.
Figure 5
Climatic suitability of Fritillaria imperialis for future conditions (HADGEM2-ES RCP 8.5 outputs – 2070 as an average for 2061–2080).
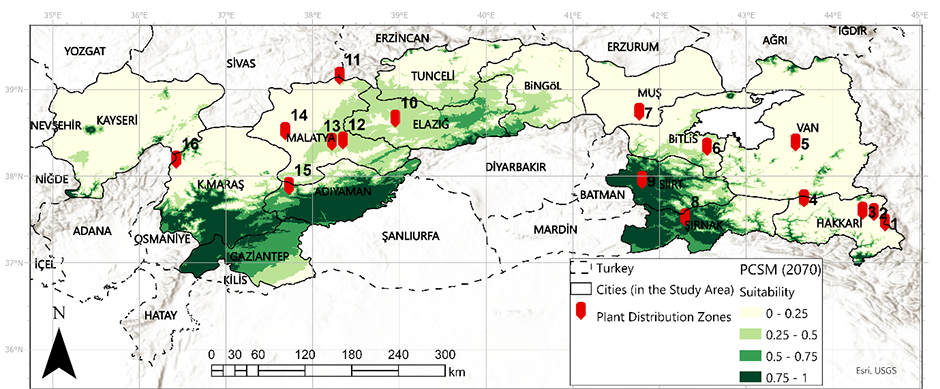
Figure 6A shows how the climatic suitability of the plant’s natural distribution zones changes according to future conditions. It was determined that the suitability of Zones 8, 9, 10, 13, and 15 is projected to increase by 2070. These zones are in Şırnak, Siirt, Elazığ, and Adıyaman. According to Figure 6B, suitability will decrease below 20% in 2070, especially in the current distribution zones between 2,000 m and 3,000 m altitudes. In the zones between altitudes of 500 m and 1,000 m, the suitability approached 100%. Although there are zones where climatic suitability will increase by 2070, the general trend line shows that suitability will decrease (Figure 6B).
. Discussion
Plants, which are the leading producers in ecosystems, are among the groups most affected by the harmful effects of climate change (Lane & Jarvis, 2007). In particular, the risk of a 10% reduction in plant species as a result of variable and difficult-to-predict climate patterns, extreme weather events (Erlat et al., 2021), high temperature, and drought (Aydin et al., 2020), etc., increasing the vulnerability of plants and is a severe threat to living things (Aydın & Sarptaş, 2018; Haşlak, 2007; Lane & Jarvis, 2007).
The reaction of species to climate change, and consequently deteriorating climate parameters, such as precipitation and temperature at different levels, will lead to deterioration of the structure, productivity, and geographical disintegration of ecosystems (Aydın & Sarptaş, 2018; Öztürk, 2002). However, these conditions allow some plants to adapt; that is, some may succumb to competition or migrate due to climate change (Aydın & Sarptaş, 2018; Demir, 2009; Denhez, 2007; Erlat, 2014; Turkeş, 2016; Turkeş et al., 2000). Therefore, analysis of the impacts of climate change on plants helps to develop strategic system models and tactical models for future action plans (Eppich et al., 2009).
In this study, F. imperialis was examined using PCSM to evaluate its future climate suitability. Based on the results of this study, it was expected that there might be significant losses at higher altitudes. Climatic suitability is projected to increase at lower altitudes, and the current distribution zones at lower altitudes may be the most suitable zones for the year 2070. The results indicated that climate suitability significantly changed with the altitude gradient of the plant.
The study results may also be explained by the effect of climate change on temperature and precipitation, particularly on snowfall. Dense snow cover significantly affects soil permeability, moisture, and heat (Asar et al., 2008). It is directly associated with the active growth and developmental periods of bulbous plants. In addition, snow cover is of great importance for plants that grow at high elevations, and the timing of spring snowmelt affects the length of the growing season (Dahlman, 2018). For F. imperialis, spring snow cover is essential for the flowering period, because snow provides moisture to the soil and plants. There are fewer temperature fluctuations in winter due to the smaller amount of sun rays, insulation by snow-covered surfaces, and the tendency to stabilize the soil temperature (Asar et al., 2008). Therefore, the heat required by Fritillaria bulbs to grow was similar to that required by the soil in the growth area. Dense snow cover and lower temperature fluctuations protect Fritillaria bulbs from freezing (Alp, 2006).
Additionally, snow melts more slowly at higher altitudes because the density of snow cover increases the water retention capacity of the soil. This is how snow cover stores the water required later by the plant and helps the plant to intake it naturally (Dahlman, 2018). However, records from the last five decades show that, on average, spring snow disappeared earlier in the year than it did in the past, with the most rapid decline in snow-covered area occurring in June (Dahlman, 2018). Across the Northern Hemisphere, the total area covered by snow during March and April has shrunk over time (Dahlman, 2018). In addition, the “growth and development” stages of F. imperialis are controlled by seasonal thermoperiodism (heat, cold, and heat). Lower temperatures (0–8 °C) maintained bulb growth and leaf activity for longer. When bulb size is regarded as one of the most significant flower quality parameters, Fritillaria fancies low-temperature conditions during aboveground growth (Khodorova & Boitel-Conti, 2013). As a result, it encourages larger underground organs and flower production the following spring. Therefore, it can be stated that Fritillaria imperialis starts its growth in certain ecological conditions, such as slightly lower air and soil temperatures and high isolations (Khodorova & Boitel-Conti, 2013). The base temperature of mountainous plants is relatively low when the snow starts to melt. According to a previous study (Alp, 2006), snow melting is a determinant factor of primary flowering time of mountainous plants (Zafarian et al., 2019). Plants that blossom in winter and early spring and the ecological chain where they are located are negatively affected by a decrease in winter precipitation and an increase in winter temperature (Demir, 2009). Thakur and Chawla (2019) indicated that global warming severely affects species distributions and is believed to be a significant driver of species extinction due to species range shifts (Braunisch et al., 2016; Franklin et al., 2016; Hof, 2010). If a species is also rare and endemic, the extinction risk is higher (Işik, 2011; Mouillot et al., 2013; Thakur & Chawla, 2019).
As a high-altitude plant, F. imperialis is endemic to this region. Thus, future temperature and precipitation changes due to climate change will affect the current natural plant distribution. Previous studies have shown that climate change affects plant habitats at high altitudes. It may also cause plant migration because lower altitudes could represent the future temperature range for plants at higher altitudes (Alexander et al., 2011). In addition to immigration, Bemmels and Anderson (2019) indicated that for high-altitude plants (i.e., forb Boechera stricta in the Rocky Mountains), the plant’s adaptation rate can be increased by the timing of flowering. However, this rate can also decrease the duration of flowering. It shows that, in any case, high-altitude plants will be affected by future climate change. In Central Scotland, Trivedi et al. (2007) indicated that snow cover at higher altitudes appears to be more sensitive to climate change, with potentially significant impacts on habitats of high conservation interest. Alp (2006) stated that bulb growth relies primarily on soil temperature. Sudden temperature fluctuations in the soil directly affect plant growth and development. These microclimate conditions limit the spread of bulbous plants in higher regions as they feed on winter precipitation thus causing them to migrate to lower altitudes where soil moisture is higher and evaporation is lower (Khodorova & Boitel-Conti, 2013). The projection for the year 2070 supports the thesis that lower-altitude regions such as the Siirt, Şırnak, Elazığ, and Adıyaman would be more suitable habitats for and pose better ecological conditions for the spread of F. imperialis. Therefore, it may be concluded that the plant protects itself from the negative effects of climate change by migrating.
This study showed that the current natural distribution zones of F. imperialis change along an elevational gradient. In particular, lower altitudes would be more suitable for plants in the future. However, plant migration and adaptation may be complicated because plants may fail to migrate to future suitable zones resulting in local extinction. The plant may also lose its ability to combat other species living in the same habitat. Changes in the habitat or habitat conditions of a species can negatively affect its adaptation process. This leads to the disruption of species-dependent ecosystem services and service flow.
. Summary and Conclusions
Fritillaria imperialis is endemic to this region. Consequently, the current natural plant distribution will be affected by future temperature, precipitation, and snowfall changes due to climate change. According to this study, severe losses can occur at higher altitudes. Lower altitudes are expected to have increased climatic compatibility, and existing distribution zones at lower altitudes may be the most appropriate zones for 2070. The study findings revealed that the climate adaptability of a plant varies greatly depending on its altitude gradient.
On the other hand, plant migration and adaptation may be problematic because plants may fail to migrate to appropriate future zones and become extinct locally. It is also likely that the plant will lose its ability to challenge other species that share the same habitat. Changes in a species’ environment or habitat conditions can harm the adaptation process of the species. This results in the disruption of ecosystem services and fluxes that are species-dependent.
