. Introduction
The use of crop competition to control weeds has become an important tool for integrated weed management and has been successfully applied in many regions (Mohammadi et al., 2012). One such strategy is to increase the planting rate of the crops. A higher planting density can accelerate the closure of the canopy, promote the interception of light radiation, and ultimately inhibit the growth of weeds (Andrade et al., 2002). Increased crop planting rates have been shown to suppress Lolium rigidum Gaudin in wheat fields (Lemerle et al., 2004), Panicum miliaceum L. in sweet corn fields (Williams & Boydston, 2013), and many weed species in oilseed rape fields such as Descurainia sophia, Amaranthus hybridus L., Crotalaria juncea L., and Mucuna deeringiana (Bort) Merr. (Collins et al., 2008). In addition, studies have shown that the yield of wheat (Arduini et al., 2006) and soybeans [Glycine max (L.) Merr.] is proportional to a moderate increase in the sowing rate (Butts et al., 2016). However, the effective control of weeds by an increase in the crop planting rate depends to a certain extent on the shade tolerance of the target weeds (Landau et al., 2017). Hence, knowledge of shade effects on the growth and competition of targeted weeds will provide insight into the potential effectiveness of this strategy.
Aegilops tauschii, an annual grass species of the family Poaceae, is commonly known as “rough-spike hard grass.” As a wild relative of wheat, A. tauschii is one of the world’s top 10 nefarious weed species and is mainly distributed along the Mediterranean coast of southern Europe and northern Africa (Lubbers et al., 1991; Dvorak et al., 1998). With a wide range of adaptations, the species is invasive in wheat fields and distributed from arid Artemisia deserts to humid temperate forests (Fang, 2012). Aegilops tauschii plants not only have tillering characteristics, strong reproduction ability, wide suitable range, and easy transmission; but also display growth habits, emergence times, and seedling characteristics very similar to wheat. This weed fiercely competes with wheat for resources such as light, fertilizer, and water, resulting in a reduction in wheat production. It is also an alternative host for pathogens that cause wheat stripe rust (Fang, 2012). In 2015, the Institute of Plant Protection of the Chinese Academy of Agricultural Sciences survey showed that in some wheat fields where A. tauschii plants were found to grow, such as the fields in Hebei and Shanxi provinces, the wheat production was reduced by more than 50% (N. Wang et al., 2021). Because A. tauschii is a close relative of wheat, no wheat herbicides have shown a significant controlling effect on A. tauschii until now. Therefore, winter wheat-producing areas in China still rely on manual removal of this weed (Fang, 2012). The recommendation and use of increased wheat seeding rates for A. tauschii management is hindered by the lack of information on A. tauschii’s capacity for acclimation to shading. The objectives of this study were (i) to assess A. tauschii for shade tolerance by measuring the responses of its morphological and physiological characteristics under decreasing irradiance levels, and (ii) to determine whether the competitive relationship between A. tauschii and wheat will be affected by shading.
. Material and Methods
. Material
In May 2020, the seeds of A. tauschii and Triticum aestivum (cultivar ‘Xinmai 32’) were collected from the experimental field (35°18′ N, 113°52′ E) of the Xinxiang Academy of Agricultural Sciences, Henan Province. The collected seeds were dried and stored indoors until further use. The experiment was conducted in the experimental fields of the Forestry College at the Kaiyuan Campus of Henan University of Science and Technology. This area is located in the Luolong District of Luoyang City, Henan Province, central China, at 34°59′ N and 112°16′ E. The site is characterized by a warm to temperate continental monsoon climate, with an average annual temperature of 27.2 ° and a minimum winter temperature of −21.3 °. The average annual precipitation of the entire region is 500–900 mm. Brown soil collected from surrounding farmlands in the Loulong District was used for the potting experiments. The basic physical and chemical properties of the soil were: pH, 7.4; total nitrogen content, 0.85 g kg−1; total phosphorus content, 0.51 g kg−1; total potassium content, 228 mg kg−1; available phosphorus, 11.4 mg kg−1 and potassium, 167.5 mg kg−1.
. Experimental Design
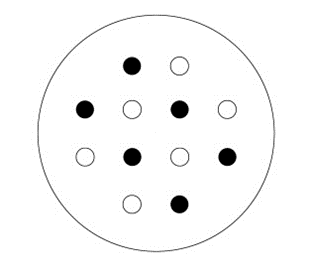
In September 2020, A. tauschii and wheat seeds were selected and sown into planting boxes (the planting box was a rectangular plastic box with length, width, and height of 45, 32, and 15 cm, respectively) containing perlite, vermiculite, and peat culture medium (volume ratio is 1:1:1), and were placed in a greenhouse (25 ° daytime and 20 ° nighttime temperature, for 12 hr each). When the seedlings grew to the stage “two leaves and one heart” (tillering begins stages) (Hyles et al., 2020), A. tauschii and wheat seedlings of similar height and growth were selected and transferred to pots according to the experimental design mentioned below. The same amount of soil was used in each pot. Before potting, the soil moisture content and maximum water-holding capacity were measured, and the weight of each pot was recorded after planting. Monoculture and mixed plantings of A. tauschii and wheat were performed according to the replacement method (de Wit, 1960). Considering the commonly used wheat planting density (150–200 per square meter) and pot specification (top diameter = 21 cm; height = 19 cm), as well as the edge effect, the plant density in this study was set to 12 plants per pot in both monoculture and mixed groups. Pots for monoculture groups were populated with A. tauschii or wheat and mixed groups were populated with a mix of A. tauschii and wheat (1:1) (Figure 1). The experimental pots were arranged in a completely randomized design.
Figure 1
The diagram of experimental design (the diagram of mixed-species model). Planting locations of Aegilops tauschii are indicated as black circles and planting locations of wheat are indicated as white circles.
Shading treatments: Black shading nets were used to set up shading sheds to artificially simulate different light intensities. In total, three conditions were set: CK (normal light; shading rate = 0), T1 (one layer of the black shading net; shading rate = 25%), and T2 (two layers of the black shading net, shading rate of 50%). There were four pots in each group and each group had five replicates. One week after the seedlings were transplanted, they were placed under a shade shed and then subjected to normal management. Watering was carried out according to the weight of each pot and the maximum water holding capacity of the field to ensure that the water content of the pot soil was 75%–80% of the maximum water holding capacity of the soil.
. Morphological and Biomass-Related Indices
The experiment ended after 120 days, and a total of 10 plants were randomly selected from each treatment under monoculture and mixed conditions. First, the height of each plant was measured, and then the entire plant was uprooted from the pots. After rinsing with water, the entire plant was harvested. Then, the leaves were scanned, and Photoshop software was used to determine the leaf area (Xiao et al., 2005). Finally, leaves, stems, and roots were separated and preserved in paper bags. The samples were then dried in an oven to constant weight at 80 °, and the weight was measured using a millionth weighing scale. Root mass / crown mass (R/C) = root biomass/aboveground biomass and specific leaf area (SLA) = total leaf area/total leaf weight (J.-F. Wang & Feng, 2004) were estimated.
. Physiological Indices
After 0, 30, 60, 90, and 120 days (d) of shading treatment, four replicates were randomly selected for each treatment in the monocultures (A. tauschii and wheat). Four plants were sampled for each replicate, amounting to a total of 80 plants used for physiological indicator measurements. For each treatment, the third or fourth mature leaf of each plant, from top to bottom, was selected, and approximately 2.00 g was taken. The 95% ethanol method was used to determine the chlorophyll content (H. S. Li, 2000; Zou, 2003). Superoxide dismutase (SOD) activity was measured using the nitroblue tetrazolium photoreduction method, and the thiobarbituric acid method was used to measure thiobarbituric acid reacting substances (TBARS) content (H. S. Li, 2000; Zou, 2003). SOD activity and TBARS content were determined as described by N. Wang et al. (2021).
The plasticity index (PI) was measured using the following formula (Valladares et al., 2000):
. Data Analysis
In addition, the relative yield (RY), total relative yield (RYT), and competition balance (CB) indices were used to measure the competitiveness of A. tauschii and wheat against each other. These were calculated as follows (de Wit, 1960; Fowler, 1981; Wilson, 1988):
where a and b represent A. tauschii and wheat, respectively; Ya represents the yield per plant of the monoculture group of a; RYa and RYb represent the relative yields of a and b, respectively, when a and b were grown in the mixed planting; and Yab represents the yield of a in the mixed planting. The dry matter mass of a single plant was used to calculate yield per plant.
If RYa = 1.0, the intra- and inter-species competition intensities of a and b are the same, which means that the competitiveness of the two species is the same. If RYa > 1.0, it indicates that the intra-species competitiveness is greater than the inter-species competitiveness, which means the competitiveness of a versus b is greater than the competition intensity of a against itself. If RYa < 1.0, the intra-species competitiveness is less than the inter-species competitiveness, which means that the competitiveness of a versus b is less than the competition intensity of a against itself.
If RYT = 1.0, this indicates that a and b need the same nutritional resources, and one species can exclude the other species through competition. If RYT > 1.0, then a and b do not compete. Consequently, RYT < 1.0, indicates that a and b compete.
If CBa = 0, a and b are equally competitive; if CBa < 0, a is less competitive than b; and if CBa > 0, a is more competitive than b. The larger the CBa value, the stronger the competitiveness.
SPSS software (version 18.0) was used to perform statistical analysis. One-way analysis of variance (ANOVA) was used to compare differences in the same index after the shading treatments. Significance was tested using the least significant difference (LSD) test at p = 0.05. Statistical values are expressed as the mean (±SE). Microsoft Excel was used to summarize the data and plot figures.
. Results
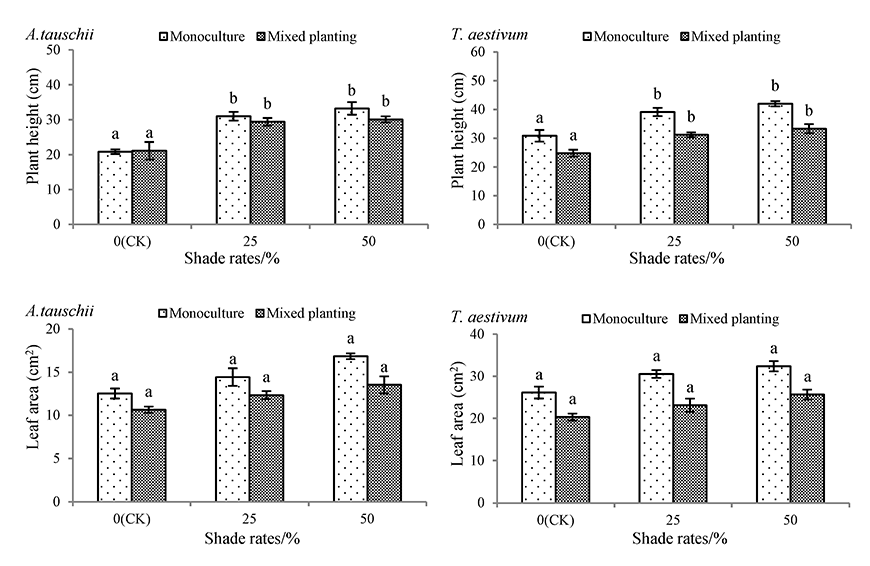
With increasing shading rate, plant height and leaf area per plant in both species increased gradually under monoculture and mixed planting conditions (Figure 2). For both conditions, the plant heights of A. tauschii and wheat were significantly different from those of the CK treatment under the 50% shade rate treatment, but the leaf area per plant of A. tauschii and wheat was not. The plant heights of A. tauschii and wheat in monocultures under the 50% shading rate treatment increased by 59.24% and 36.13%, respectively. Those results were significantly different from those under the CK treatment. Under the same shading treatments, the leaf areas of A. tauschii and wheat in the mixed planting pots were greater than those in the monoculture pots. The leaf area per plant of A. tauschii and wheat in monocultures under the 50% shading rate treatment increased by 34.69% and 24.05%, respectively, which was not significantly different from that of the CK treatment.
Figure 2
Effects of shading on plant height and leaf area of Aegilops tauschii and Triticum aestivum. The values are shown as mean ±SE. Different letters above the bars denote significant differences (p ≤ 0.05) in plant height or leaf area with Duncan’s test under monoculture or mixed planting.
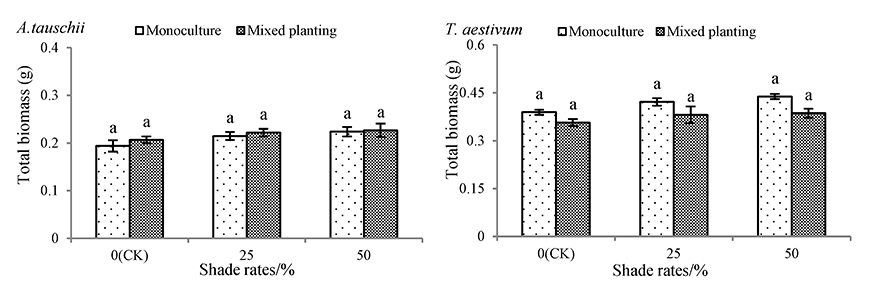
The total biomass of both monocultured and mixed planted A. tauschii and wheat augmented with increasing shade rates (Figure 3). However, A. tauschii and wheat total biomass under both monoculture and mixed conditions in the 50% shade rate treatment was not significantly different from their total biomass in the CK treatment. Under monoculture conditions, the total biomass of A. tauschii and wheat in the 50% shading rate treatment increased by 15.40% and 12.60%, respectively.
Figure 3
Effects of shading on total biomass of Aegilops tauschii and Triticum aestivum. The values are shown as mean ±SE. Different letters above the bars denote significant differences (p ≤ 0.05) in total biomass with Duncan’s test under monoculture or mixed planting.
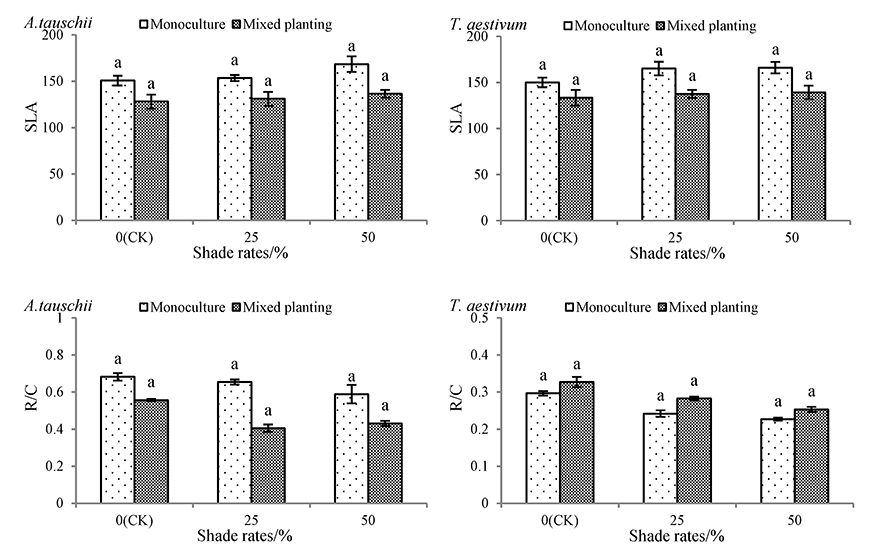
With an increase in the shading rate, the special leaf area (SLA) increased gradually in both species under the monoculture and mixed planting conditions, whereas the root mass / crown mass (R/C) declined (Figure 4). However, the SLA and R/C of monocultured and mixed planted A. tauschii and wheat in the 50% shade rate treatment were not significantly different from those in the CK treatment. Under monoculture conditions, the SLA of A. tauschii and wheat in the 50% shading rate treatment increased respectively by 11.80% and 10.69%, and the R/C decreased by 13.68% and 23.52%, respectively.
Figure 4
Effects of shading on special leaf area and root mass / crown mass of Aegilops tauschii and Triticum aestivum. The values are shown as mean ±SE. Different letters above the bars denote significant differences (p ≤ 0.05) with Duncan’s test under monoculture or mixed planting.
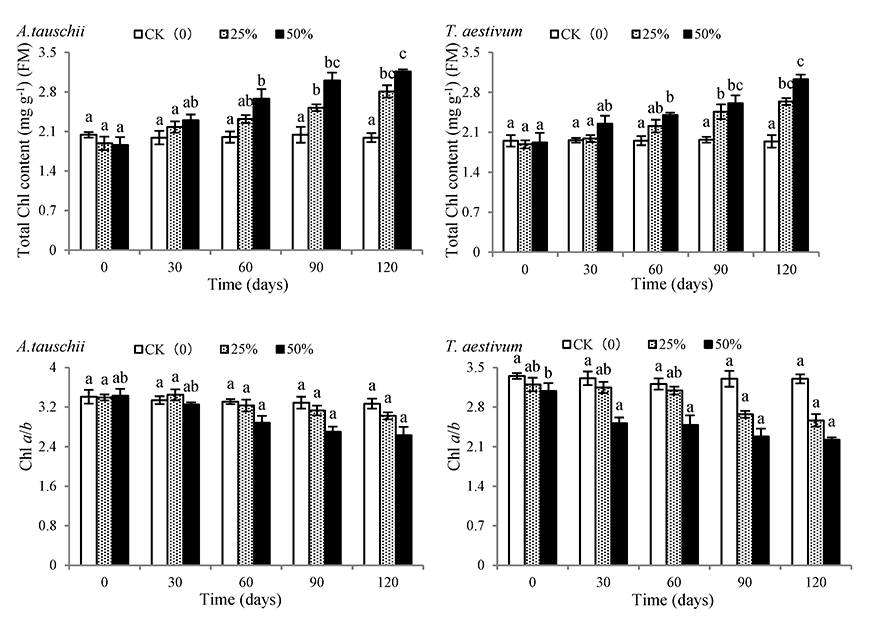
As shown in Figure 5, with the prolongation of shading treatment time, the total chlorophyll content of A. tauschii and wheat gradually increased, while the chlorophyll a/b ratio decreased. On the 120th day, the total chlorophyll content of A. tauschii and wheat in the 50% shading rate treatment had increased by 69.89% and 57.81%, respectively, and was significantly different from that of the CK treatment. However, chlorophyll a/b ratio of A. tauschiiand wheat in the 50% shading rate treatment had decreased by 23.24% and 27.93%, respectively, and were significantly different from those in CK treatment.
Figure 5
Effects of shading on chlorophyll (Chl) content and Chl a/b of Aegilops tauschii and Triticum aestivum. The values are shown as mean ±SE. Different letters above the bars denote significant differences (p ≤ 0.05) with Duncan’s test within the same shading rate.
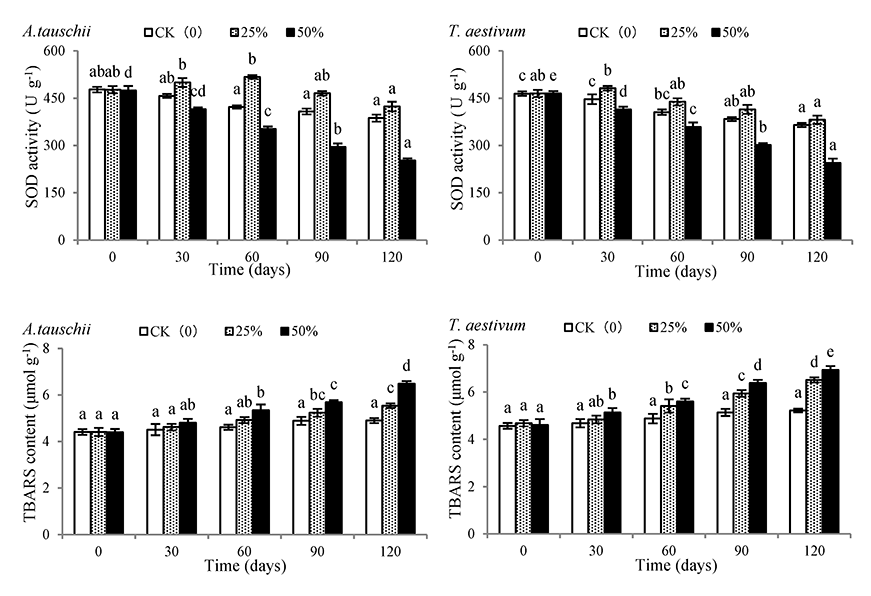
With the extension of the shading time, the SOD activity of A. tauschii and wheat plants subjected to 25% shading rate increased first and then decreased, while both species showed a continuous decrease under 50% shading rate. With the prolongation of shading time, the TBARS content of A. tauschii and wheat showed an increasing trend both in 25% and 50% shading rate treatments (Figure 6). On the 120th day, the SOD activity of A. tauschiiand wheat in the 50% shading rate treatment had decreased by 46.90% and 47.44%, respectively, and was significantly different from those of 0th treatment. Similarly, the TBARS content of A. tauschii and wheat in the 50% shading rate treatment had decreased by 47.36% and 50.54%, respectively, and was significantly different from those under CK treatment.
Figure 6
Effects of shading on superoxide dismutase (SOD) activity and thiobarbituric acid reactive substances (TBARS) content of Aegilops tauschii and Triticum aestivum. The values are shown as mean ±SE. Different letters above the bars denote significant differences (p ≤ 0.05) with Duncan’s test within the same shading rate.
The performance plasticity analysis was carried out by combining the relevant indicators from A. tauschii and wheat monoculture that were subjected to 50% shading rate. As shown in Table 1, the average plasticity index of the eight morphological and biomass indices of A. tauschii, including plant height, leaf area, and leaf biomass, was 0.18, which is greater than the average for wheat plants (0.17). The average plasticity index of the four physiological indices, including SOD activity and TBARS content, was 0.46, which was significantly greater than the average for wheat plants (0.37).
Table 1
Plasticity index (PI) for each of the morphological characteristics and physiology of Aegilops tauschii and Triticum aestivum with 50% shading rate.
Under the different shading rate treatments, the RYT values of both A. tauschii and wheat plants were less than 1 (Table 2). In addition, the CB value of A. tauschii plants was less than 1, and gradually decreased with the intensification of the shading rate.
Table 2
Effects of shading on the competitive balance (CB), total relative yield (RYT) of Aegilops tauschiiand the relative yield (RY) of A. tauschiiand Triticum aestivum.
. Discussion
Plant height and leaf size are two key factors determining the success of competition for light resources among individual plants (Gorchov & Trisel, 2003) and studies have shown that shading can increase both these factors (Valladares et al., 2000; Y. Wang et al., 2019). In this study, the plant height and leaf area of A. tauschii and wheat plants increased gradually with the intensification of shading rate under both monoculture and mixed planting conditions. This suggests that the two species adapt to low light conditions by increasing the plant height and leaf size, and thus compete for more light resources. It can be seen from the increase in plant height and leaf size that A. tauschii is more capable of responding to low-light conditions than wheat.
At the species scale, specific leaf area (SLA) is an excellent indicator of competition for light resources between weeds and crops (Brainard et al., 2005; Storkey, 2005). Regnier and Harrison (1993) found that decreasing transmittance leads to a significant increase in SLA in Xanthium strumarium L. and Abutilon theophrasti Medik. The research results of Yang et al. (2014) showed that Chenopodium album and Flaveria bidentis both adapted to low-light environments by increasing SLA, and some studies have shown that low-light conditions can cause a decrease in the R/C ratio of invasive plants (Hou et al., 2015; Yasin et al., 2019). In this study, the R/C of A. tauschii and wheat decreased with intensifying shading deposition, whereas SLA increased gradually. These results suggest that those two plant species adapt to the low light environment through the investment of aboveground biomass and the increase in SLA. It can be seen from the changes in R/C and SLA that the response ability of A. tauschii plants to low light environments is greater than that of wheat.
The increase in chlorophyll content is a typical stress response of plants, which can promote the maximization of light absorption under low-light conditions, thereby prompting plants to use light resources more effectively (Y. Dai et al., 2009; Liu et al., 2007). Chlorophyll a/b is an important indicator of plant adaptation to various light intensities (F. Dai et al., 2007; H. Li et al., 2010). The reduction in chlorophyll a/b in plants under light-shielding conditions is primarily due to the increase in chlorophyll b, which is conducive to the effective use of scattered light in the environment (Nikiforou & Manetas, 2011). In this study, with the extension of the shading time, the chlorophyll content of A. tauschii and wheat plants increased gradually under 25% and 50% shading rate treatments, while chlorophyll a/b declined continuously. Studies on winter wheat by C. Xu et al. (2013) and Zheng et al. (2011) obtained the same conclusions. Therefore, it is likely that both A. tauschii and wheat plants can adapt to low-light environments through the increase in chlorophyll content, and especially through the increase in chlorophyll b.
SOD is an important protective enzyme in plants and its activity is generally regarded as an important indicator of plant resistance (N. Wang et al., 2021). In addition, as an important product of abiotic stress caused by membrane lipid peroxidation, the content of TBARS may be used to evaluate the peroxidation level of membrane lipids, and can, to some extent, indicate the accumulation of antioxidant enzymes (Deng et al., 2012; Sharma & Dubey, 2007). Previous studies have shown that under unfavorable light conditions, plants can increase the activity of SOD and other antioxidant enzymes, reduce the accumulation of TBARS, and avoid membrane lipid peroxidation and cell damage by removing excessive reactive oxygen species (Kobayashi et al., 2013; Kong et al., 2016). In this study, the SOD activity of A. tauschii and wheat increased first and then decreased under the 25% shading rate treatment, but they were both significantly higher than the SOD under the normal light conditions after the same treatment time. In contrast, under the 50% shading rate treatment, the SOD activity of A. tauschii and wheat declined gradually, and the value was significantly lower than under the normal light conditions after the same time. This showed that low-intensity shading improves the stress resistance of A. tauschii and wheat, and that such shading rate helps remove active oxygen and ensures the continuous progress of normal photosynthesis. In addition, compared with 50% shading rate treatment, the increase in TBARS content of A. tauschii and wheat subjected to 25% shading rate was relatively less marked, which also confirms the above results of the changes in SOD activity. Such conclusion has also been confirmed by the studies of winter wheat by C. Xu et al. (2013) and C.-L. Xu et al. (2016).
Phenotypic plasticity is an important factor that determines the competitiveness and fitness of plants (Sultan, 1995). Plastic response may be an important approach for alien species to successfully invade a wide range of environments in order to gain advantages over native plants (Fogarty & Facelli, 1999; Stratton & Goldstein, 2001). Compared with the plasticity of morphological traits, the plasticity of physiological traits is faster and more readily reversible (Bradshaw, 1965; Grime & Mackey, 2002). Thus, it can provide more effective responses in rapidly changing environments (Yamashita et al., 2002). By measuring the morphological and physiological plasticity, the contribution of phenotypic plasticity to plant invasion can be evaluated more comprehensively. Previous studies have shown that in comparison with native species, the physiological response ability of invasive plants is higher than their morphological one (Yamashita et al., 2002). The high plasticity of physiological indices in response to different light environments has been proven to be an important feature of species with shade tolerance (Hou et al., 2015; Yamashita et al., 2002). In this study, the average values of the plasticity indices, morphological indicators, and physiological indicators of A. tauschii were all greater than the average values for wheat. Such a difference in plasticity may also explain why A. tauschii has a certain ability to adapt to low light. This also confirms the conclusion of Hou et al. (2015) that invasive species may show greater shade-induced plasticity, especially in terms of their physiological characteristics.
Competitiveness is an important factor that determines the invasive ability of alien plants and affects the composition and structure of a community (Goldberg & Barton, 1992; Siemann & Rogers, 2003). Biomass is an important indicator of interspecies competition. Therefore, under mixed condition, most competition indicators that reflect the competitiveness of a certain plant are based on the changes in biomass (Gibson et al., 1999). In this study, the RYT of A. tauschii and wheat was less than 1, indicating that there was a competitive relationship between A. tauschii and wheat under shading conditions. In addition, it can be seen from the CB value of A. tauschii that the competitive ability of A. tauschii in the shading treatment was still greater than that of wheat; however, low light conditions significantly reduced its competitive inhibition of wheat. This result is also consistent with the conclusions of Shen et al. (2021) on the invasive plant Ageratina adenophoraand Chen et al. (2013) on the invasive plant Sonneratia apetala (Buch.-Ham.).
Shen et al. (2021) showed that according to the changes in the growth and competitiveness of the invasive plant A. adenophora during shading treatment, the crop Helianthus tuberosus L. could be used as an alternative control in the invaded shadowy orchard and forest edges. Landau et al. (2017) showed that as rapeseed seeding rate increases, its canopy light transmittance decreases linearly, and the weakening of light suppresses the growth of the weed species Descurainia sophia to some extent. Therefore, increasing the seeding density of rapeseed may be considered an effective strategy to inhibit D. sophia. In this study, we found that A. tauschii showed some adaptability to low-light conditions; consequently, increasing the seeding of wheat could not completely suppress the growth of A. tauschii.
. Conclusion
In summary, the invasive plant A. tauschii has a certain tolerance to low-light environments by adjusting its morphological structure, biomass allocation pattern, and physiological and biochemical indices. However, the ability of A. tauschii to compete with wheat gradually decreased with intensifying shading rate. Therefore, we believe that increasing the seeding of wheat can reduce the competitive hazards of A. tauschii plants; nevertheless, this may not be an appropriate strategy for the ecological control of this species.
