Introduction
Ginger (Zingiber officinale Roscoe), belonging to the Zingiberaceae family, is a herbaceous plant, well adapted to moist and humus-rich soil. Bioactive compounds found in ginger – gingerol, paradol, shogaol, zingerone, zerumbone, terpenoids, and ginger flavonoids – have note-worthy medical effects, such as antioxidant, antiemetic, anti-inflammatory, antimicrobial, hepato-protective, and antitumor activity (Rahmani et al.,2014).
In the centrally-located Vietnamese province of Hue, a population of ginger, long famous for its characteristic aroma and pungency, is cultivated. However, in Hue, ginger is grown mainly on the household scale, which is sufficient for local consumption but unable to meet the needs of the pharmaceutical industry. The traditional method for ginger cultivation has drawbacks. Pathogenic microorganisms, such as Ralstonia solanacearum, Pythium aphanidermatum, and Meloidogyne spp. (de Lange et al.,1987; Hosoki & Sagawa,1977), are spread during cultivation and triggered in growing preserved rhizomes. Degeneration of ginger rhizomes after long-term cultivation could also occur (Zhao,2002). Fortunately, in vitro ginger microrhizome production could overcome these issues.
Despite the merits, there are few reports on production of in vitro ginger microrhizomes. The use of silver nitrate by Singh et al. (2013) increased microrhizome number and weight in ginger (cultivated in a Growtek vessel) to 38.25 and 2.65 g, respectively. Additionally, Archana et al. (2013) introduced a method which is able to produce microrhizomes with a maximum weight of 1.83 g, while Abbas et al. (2014) produced microrhizomes with a maximum weight of 1.74 g. Swarnathilaka et al. (2016) reported the largest (in number and weight) microrhizomes, propagated from a Sri Lankan cultivar, with 9.6 in vitro microrhizomes and a weight of 8.553 g. Considering the low number of studies on ginger microrhizome production, we examined the impacts of several factors on microrhizome induction in order to create an in vitro production method which is capable of providing a productive and high-quality source of microrhizomes for the perennial ginger cultivar of Hue, Vietnam.
Material and Methods
Plant Material
In vitro ginger plantlets were obtained from the Department of Biology at the Hue University of Sciences, Vietnam. The used plantlets belong to the ginger population found in the province of Hue.
Shoot Multiplication
To create a sufficient number of in vitro shoots for experiments on microrhizome induction, ginger plantlets were cultured for 2 months on MS (Murashige & Skoog,1962) medium containing 30 g/L sucrose, 8 g/L agar, 2 mg/L BAP (6-benzyl amino purine), and 0.5 mg/L NAA (α-naphthaleneacetic acid) (Kambaska & Santilata,2009).
To eliminate carry-over effects of the plant growth regulators (PGRs), which were used during shoot multiplication, multiplied shoots (3–4 cm long) were separated and cultured on basal MS medium containing 30 g/L sucrose and 8 g/L agar for 2 weeks before microrhizome induction experiments.
Ginger Microrhizome Induction
The following experiments were conducted to investigate how ginger microrhizome induction was affected by the factors below:
Firstly, the effect of sucrose concentration on microrhizome induction was examined by culturing in vitro ginger shoots on MS media containing 8 g/L agar and different sucrose concentrations (30, 60, 70, 80, 90, and 100 g/L). The optimal sucrose concentration was used in further experiments.
Then, to investigate the effect of silver nitrate (AgNO3) on ginger microrhizome formation, MS media containing sucrose (at the optimal concentration) and 8 g/L agar were supplemented with different concentrations (0.9, 1.9, 2.9, and 3.9 mg/L) of AgNO3 [based on the optimal AgNO3 concentration of 11 µM – nearly equal to 1.9 mg/L – reported by Singh et al. (2013)]. The best AgNO3 concentration was also used in further experiments.
Next, to evaluate the effects of PGRs on microrhizome induction, BAP, kinetin, NAA, and IBA (indole-3-butyric acid) (at concentrations of 2, 4, 6, and 8 mg/L) were added to MS media with 8 g/L agar and the most suitable amounts of sucrose and AgNO3.
In parallel, the effect of ammonium nitrate (NH4NO3) on microrhizome induction was also assessed. Ginger shoots were cultured on MS media supplemented with 8 g/L agar, the optimal concentrations of sucrose and AgNO3, and different quantities of NH4NO3 (1,650, 825, 550, 412.5, and 330 mg/L).
Sixty thick dark-green ginger shoots were chosen for each of the above different treatments, and were cultured under these conditions for 3 months.
Culture Conditions
Media for shoot multiplication and microrhizome induction were autoclaved at 121 °C and 1 atm for 30 minutes, after which 50 mL was poured into 250 mL Erlenmeyer flasks and capped with two layers of aluminum foil.
Cultures were incubated at 24–26 °C with 16 hours of light per day. Each rack contained three layers and a total of six (two per layer) 1.2 m-long white LED lights (each tube had a photon flux density of 34 µmol/m2s) and 288 Erlenmeyer flasks (96 flasks per layer).
Data Collection and Analysis
After 3 months of culturing, 10 ginger plantlets from each treatment were chosen randomly and removed from the culture flasks. Stems and roots were thoroughly separated from microrhizomes using scissors, from which fresh weight and diameter were measured. Plantlets with no microrhizome formation were considered to have weights and diameters of zero. Experiments were done in triplicate, so that the total number of shoots was 180 (60 × 3) and the final sample size for each treatment was 30 (10 × 3).
Data were analyzed by ANOVA using IBM SPSS Statistic software (version 20). Means were compared using a Duncan’s test with an alpha of 0.05 (Duncan,1955). Bar charts were constructed using Microsoft Excel.
Results
The Effects of Sucrose Concentration on Microrhizome Growth
Sucrose concentration had a significant impact on microrhizome fresh weight and diameter. Specifically, average microrhizome fresh weight increased from 0 to a maximum of 0.246 g when sucrose concentration was increased from 30 to 80 g/L. However, in MS media supplemented with 90 and 100 g/L sucrose, average microrhizome fresh weight dropped to 0.193 and 0.117 g, respectively (Table 1). Microrhizome diameter responded similarly, peaking at 5.83 mm with 80 g/L of sucrose (Table 1, Figure 1A).
Table 1
Effect of sucrose concentrations on microrhizome growth.
[i] * Within a column, means having a letter in common are not significantly different at the 5% level by Duncan’s test. The values in the table are 95% confidence interval for means [mean ± t(29) × SE, where t(29) is the upper 0.025 critical value for the t distribution with 29 degrees of freedom].
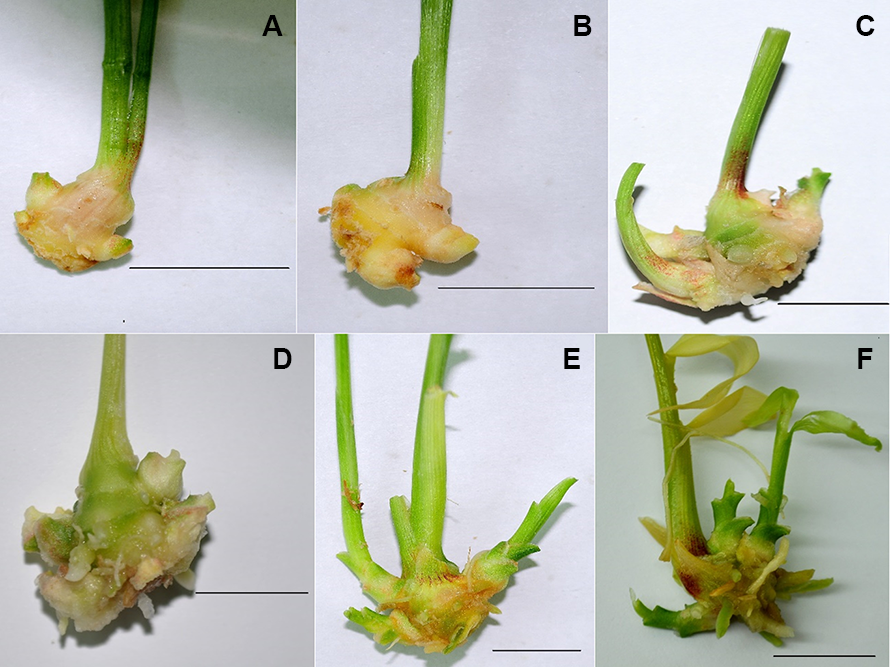
Figure 1
The typical microrhizomes produced by plantlets cultured in MS medium supplemented with 80 g/L sucrose (A), 80 g/L sucrose and 1.9 mg/L AgNO3 (B), 80 g/L sucrose, 1.9 mg/L AgNO3, and 4 mg/L BAP (6-benzylamino purine) (C), 80 g/L sucrose, 1.9 mg/L AgNO3, and 6 mg/L NAA (α-naphthaleneacetic acid) (D), 80 g/L sucrose, 1.9 mg/L AgNO3, and 4 mg/L IBA (indole-3-butyric acid) (E), 80 g/L sucrose, 1.9 mg/L AgNO3, and 550 mg/L NH4NO3 (F). Scale bars: 10 mm.
The Effects of Silver Nitrate (AgNO3) Concentration on Microrhizome Growth
Of the AgNO3 concentrations tested, ginger plantlets produced the largest and heaviest microrhizomes, at 0.337 g and 7.53 mm, respectively (Table 2, Figure 1B), when grown on MS medium with 1.9 mg/L AgNO3. Microrhizomes were not observed on medium with 3.9 mg/L AgNO3, as this concentration was lethal to cultured plantlets.
Table 2
Effect of silver nitrate (AgNO3) concentrations on microrhizome growth.
[i] * Within a column, means having a letter in common are not significantly different at the 5% level by Duncan’s test. The values in the table are 95% confidence interval for means [mean ± t(29) × SE, where t(29) is the upper 0.025 critical value for the t distribution with 29 degrees of freedom].
The Effects of Cytokinins on Microrhizome Growth
The optimal concentration of BAP for microrhizome induction was 4 mg/L, which stimulated the formation of larger (9.03 mm) and heavier (0.433 g) microrhizomes compared to the other concentrations of BAP tested. Additionally, the smallest (in diameter and weight) microrhizomes were found in the 2 mg/L BAP treatment, though these plantlets formed the most shoots (Table 3, Figure 1C, Figure 2, Figure 3, Figure 4B).
Table 3
Effect of BAP (6-benzylamino purine) concentrations on microrhizome growth.
[i] * Within a column, means having a letter in common are not significantly different at the 5% level by Duncan’s test. The values in the table are 95% confidence interval for means [mean ± t(29) × SE, where t(29) is the upper 0.025 critical value for the t distribution with 29 degrees of freedom].
Figure 2
Effects of plant growth regulators (PGRs) on microrhizome fresh weight [mean ± t(29) × SE, where t(29) is the upper 0.025 critical value for the t distribution with 29 degrees of freedom]. The bell-shaped dose-respond curves were formed when the concentrations of PGRs increased from 2 to 8 mg/L, with the peaks of 0.433 g, 0.161 g, 0.437 g, and 0.478 g at the concentrations of 4 mg/L BAP (6-benzylamino purine), 6 mg/L kinetin, 6 mg/L NAA (α-naphthaleneacetic acid), and 4 mg/L IBA (indole-3-butyric acid), respectively (within a group, means having a letter in common are not significantly different at the 5% level by Duncan’s test).
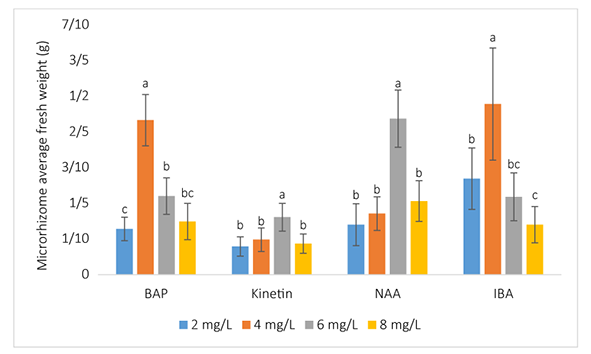
Figure 3
Effect of plant growth regulators (PGRs) on microrhizome diameter [mean ± t(29) × SE, where t(29) is the upper 0.025 critical value for the t distribution with 29 degrees of freedom]. Microrhizome diameter also had the same tendency as fresh weight since the bell-shaped dose-respond curves were formed when the concentrations of PGRs increased, with the four peaks of 9.03 mm, 4.47 mm, 9.73 mm, and 10.80 mm at the concentrations of 4 mg/L BAP (6-benzylamino purine), 6 mg/L kinetin, 6 mg/L NAA (α-naphthaleneacetic acid), and 4 mg/L IBA (indole-3-butyric acid), respectively (within a group, means having a letter in common are not significantly different at the 5% level by Duncan’s test).
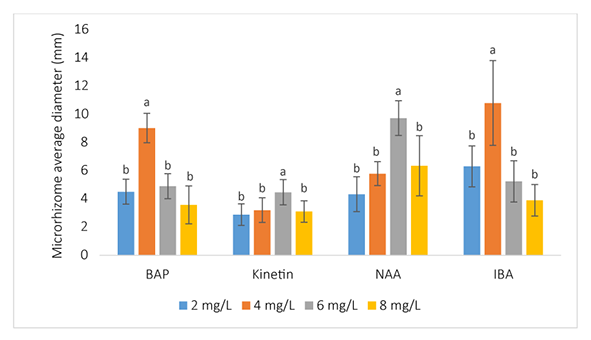
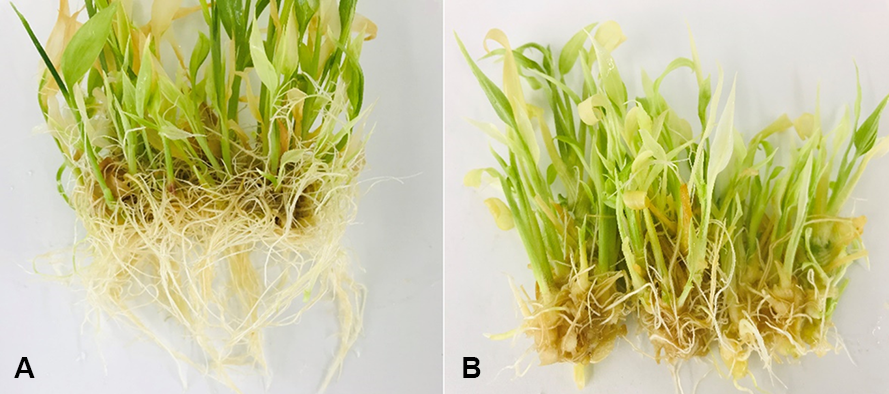
Figure 4
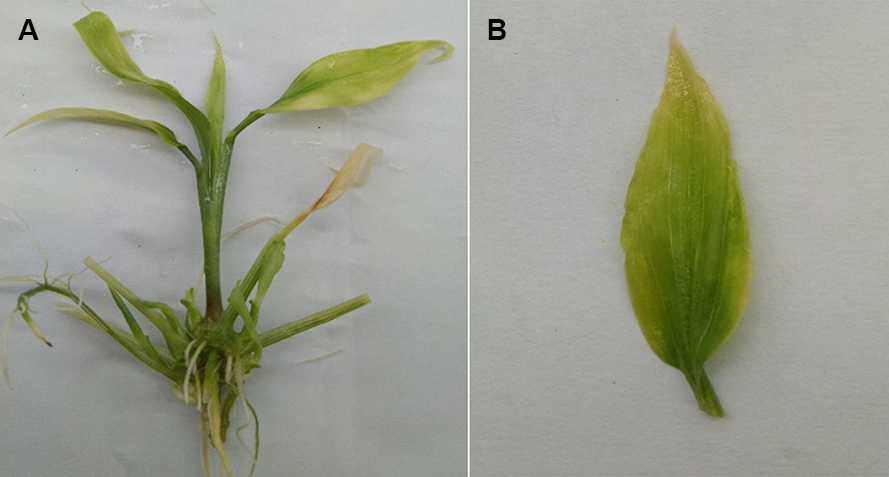
(A) Effect of IBA (indole-3-butyric acid) and NAA (α-naphthaleneacetic acid) at the concentration of 2 mg/L on ginger plantlets. The plantlets show a high number of roots and produce microrhizomes with low fresh weights and diameters. (B) Effect of BAP (6-benzylamino purine) at the concentration of 2 mg/L and kinetin on ginger plantlets. The plantlets show a high number of shoots and produce microrhizomes with low fresh weights and diameters.
In contrast to BAP, treatments with kinetin had an inhibitory effect on microrhizome induction. The optimal kinetin concentration of 6 mg/L could not produce microrhizomes larger or heavier than the ones of plants grown on the media with optimal concentrations of other factors (Figure 5, Figure 6). Moreover, we observed that kinetin could only stimulate shoot growth and multiplication (Table 4, Figure 4B).
Figure 5
Maximum average fresh weight comparison among the tested factors at their optimal concentrations being 80 g/L sucrose, 1.9 mg/L AgNO3, 4 mg/L BAP (6-benzylamino purine), 6 mg/L kinetin, 6 mg/L NAA (α-naphthaleneacetic acid), 4 mg/L IBA (indole-3-butyric acid), and 550 mg/L NH4NO3. The nonsignificant difference of the four maximum average fresh weight values of 4 mg/L BAP, 6 mg/L NAA, 4 mg/L IBA, and 550 mg/L NH4NO3 indicated that MS media supplemented with those four factors are all the best media for the induction of the heaviest ginger microrhizomes [the values shown in the bar charts are mean ± t(29) × SE, where t(29) is the upper 0.025 critical value for the t distribution with 29 degrees of freedom; means having a letter in common are not significantly different at the 5% level by Duncan’s test].
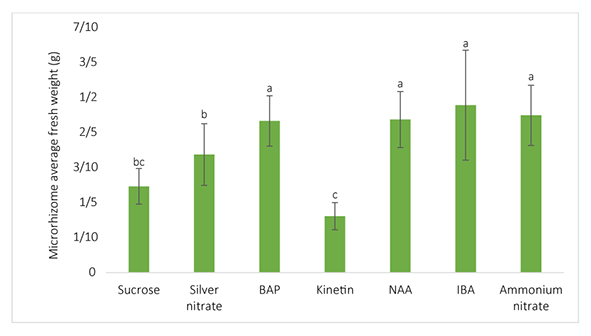
Figure 6
Maximum average diameter comparison among factors at their optimal concentrations being 80 g/L sucrose, 1.9 mg/L AgNO3, 4 mg/L BAP (6-benzylamino purine), 6 mg/L kinetin, 6 mg/L NAA (α-naphthaleneacetic acid), 4 mg/L IBA (indole-3-butyric acid), and 550 mg/L NH4NO3. As is highlighted from the chart, there was no observed significant difference among the four maximum average diameters of 4 mg/L BAP, 6 mg/L NAA, 4 mg/L IBA, and 550 mg/L NH4NO3. This means that MS media supplemented with those four factors are the optimal culture media for the production of the largest ginger microrhizomes [the values shown in the bar charts are mean ± t(29) × SE, where t(29) is the upper 0.025 critical value for the t distribution with 29 degrees of freedom; means having a letter in common are not significantly different at the 5% level by Duncan’s test].
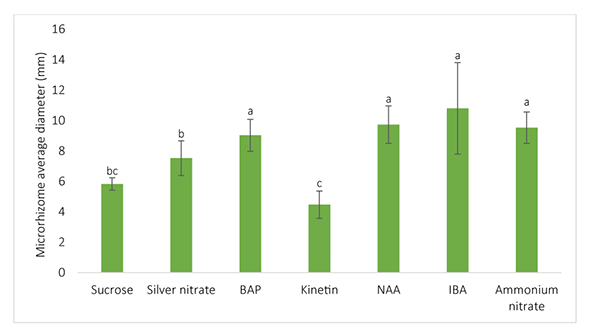
Table 4
Effect of kinetin concentrations on microrhizome growth.
[i] * Within a column, means having a letter in common are not significantly different at the 5% level by Duncan’s test. The values in the table are 95% confidence interval for means [mean ± t(29) × SE, where t(29) is the upper 0.025 critical value for the t distribution with 29 degrees of freedom].
The Effects of Auxins on Microrhizome Growth
We assessed whether ginger microrhizome induction could be stimulated by auxins NAA or IBA. Plantlets formed microrhizomes with maximum fresh weights of 0.437 and 0.478 g, and diameters of 9.73 and 10.80 mm, with 6 mg/L NAA (Table 5, Figure 1D) and 4 mg/L IBA (Table 6, Figure 1E), respectively. Plantlets treated with 2 mg/L NAA or 2 mg/L IBA grew more roots, but had microrhizomes with lower fresh weight and being smaller in diameter than microrhizomes produced by other auxin concentrations (Figure 4A).
Table 5
Effect of NAA (α-naphthaleneacetic acid) concentrations on microrhizome growth.
[i] * Within a column, means having a letter in common are not significantly different at the 5% level by Duncan’s test. The values in the table are 95% confidence interval for means [mean ± t(29) × SE, where t(29) is the upper 0.025 critical value for the t distribution with 29 degrees of freedom].
Table 6
Effect of IBA (indole-3-butyric acid) concentrations on microrhizome growth.
[i] * Within a column, means having a letter in common are not significantly different at the 5% level by Duncan’s test. The values in the table are 95% confidence interval for means [mean ± t(29) × SE, where t(29) is the upper 0.025 critical value for the t distribution with 29 degrees of freedom].
The Effects of Ammonium Nitrate (NH4NO3) Concentration on Microrhizome Growth
Microrhizome induction was optimized at 550 mg/L NH4NO3, which, on average, produced microrhizomes with 0.449 g fresh weight and 9.53 mm in diameter (Table 7, Figure 1F). NH4NO3 at 412.5 or 330 mg/L led to nitrogen deficiency in in vitro ginger plantlets, manifesting in yellow leaves and the inability to grow or produce microrhizomes (Figure 7).
Table 7
Effect of ammonium nitrate (NH4NO3) concentration on ginger microrhizome growth.
[i] * Within a column, means having a letter in common are not significantly different at the 5% level by Duncan’s test. The values in the table are 95% confidence interval for means [mean ± t(29) × SE, where t(29) is the upper 0.025 critical value for the t distribution with 29 degrees of freedom].
Discussion
Our results demonstrate the positive effects of sucrose on microrhizome formation in ginger, and the most suitable concentration for microrhizome induction of 80 g/L, which is in line with work from Archana et al. (2013) on the formation of microrhizomes in ginger cultivars ‘Mahima’ and ‘Varada.’ Stimulation on tuber (a storage organ being similar to a microrhizome) induction by sucrose has been reported in several species, including Solanum tuberosum L. (potato). According to Xu et al. (1998), high concentrations of sucrose raise the induction rate of potato microtubers, where 100% of plantlets cultured on MS media with 6% or 8% sucrose had microtuber formation. Moreover, high concentrations of sucrose regulate tuber formation by influencing the level of endogenous gibberellin, which suppresses microtuber formation. Gibberellin levels are higher in the noninducing condition (with 1% sucrose) than the tuber-inducing condition (with 8% sucrose). However, despite the positive effects of sucrose, ginger plantlets do not survive on MS media with 90 or 100 g/L sucrose, possibly a result of dehydration in these high-sucrose conditions (Pérez et al.,2004).
Our observations on the impact of AgNO3 on the in vitro production of microrhizomes in ginger are similar to those from Singh et al. (2013), who concluded that 11 µM AgNO3, which is approximately equal to the 1.9 mg/L used in our study, was the optimal AgNO3 concentration for microrhizome induction. Plantlets treated with this concentration produced, on average, the maximum number of microrhizomes. The positive effects of AgNO3 on microrhizome growth in ginger could be caused by Ag2+ cations binding to ethylene receptors at the cell membrane; thus, interfering with the typical inhibitory effect of ethylene on organ size’s elongation and determination (Bleecker et al.,1998; Goren et al.,1984; Yang & Hoffman,1984). However, high concentrations of AgNO3 in culture could be lethal to in vitro ginger plantlets, as observed by Singh et al. (2013) with concentrations of AgNO3 higher than 11 µM.
Average fresh weight and diameter of the microrhizomes followed the bell-shaped dose-response curve of all PGRs, as illustrated by Arteca (1996), when BAP and kinetin concentrations increased from 2 to 8 mg/L (Figure 2, Figure 3). Plantlets given 4 mg/L BAP formed the largest and heaviest microrhizomes (Table 3), which differs from that reported by Abbas et al. (2014), where MS medium supplemented with 9 mg/L BAP and 30 g/L sucrose produced the maximum microrhizome fresh weight (at 1.74 g). The stimulatory effect of cytokinins on microtuber induction in other species has been well reported. Mauk and Langille (1978) found that treatment with 3 mg/L zeatin riboside increased the induction rate of noninduced potato tubers from 0% to 75%. Moreover, Koda and Okazawa (1983) demonstrated that treatment with zeatin riboside and a high sucrose concentration (above 4%) increased potato microtuber fresh weight, and that cytokinins may only stimulate thickening growth by cell division to form microtubers. However, our research on the inhibitory effects of kinetin demonstrates that not all cytokinins positively influence microtuber and microrhizome induction (Figure 5, Figure 6), which is in agreement with Rout et al. (2001), who demonstrate that ginger grown on MS media supplemented with kinetin alone, or a combination of kinetin and IAA (indole-3-acetic acid), were unable to produce microrhizomes.
Ginger microrhizome formation stimulated by NAA and IBA also followed the bell-shaped dose-response curve (Figure 2, Figure 3), following Arteca (1996). A relationship between auxin and tuber formation has been reported in other species as well. Roumeliotis et al. (2012) concluded that auxin is involved in potato tuberization, as auxin concentration in the stolon tip increases several-fold prior to tuber swelling. Moreover, application of auxin in in vitro tuberization experiments further supported the role of this hormone during tuber initiation.
The negative effects of nitrogen on tuber induction have been demonstrated by Wilson (1977). Specifically, nitrate reductase – an enzyme strongly induced by high concentrations of nitrogen – can direct carbohydrates to protein synthesis in leaves rather than storage in tubers; thus, when there is a decrease in nitrogen, carbohydrates can be released by nitrate reductase and move to storage in the tuber. However, we found that ginger plantlets were weakened by nitrogen deficiency if the amount of NH4NO3 goes below 550 mg/L, resulting in yellow leaves – a symptom of nitrogen deficiency in ginger, described by McCauley et al. (2011).
We determined the optimal concentrations for certain nutrients and hormones – 550 mg/L NH4NO3, 4 mg/L BAP, 6 mg/L NAA, and 4 mg/L IBA – in order to stimulate formation of the largest ginger microrhizomes, with maximum (average) fresh weights and diameters of 0.449 g and 9.53 mm, 0.433 g and 9.03 mm, 0.437 g and 9.73 mm, and 0.478 g and 10.80 mm, respectively (Figure 1C–F, Figure 5, Figure 6).
Microrhizome fresh weight and diameter values were lower in our experiments than those reported by others. This could be due to differences in the variety of ginger used, as Singh et al. (2013) and Archana et al. (2013) reported that distinct ginger varieties treated with the same factor and concentration can produce microrhizomes of different sizes, fresh weights, and numbers.
Conclusions
High concentrations of sucrose positively affect microrhizome induction in ginger, with the optimal concentration being 80 g/L. Microrhizomes size was improved in ginger plantlets cultured on MS media with 1.9 mg/L AgNO3 and 80 g/L sucrose.
MS media supplemented with the following factors and the given optimal concentrations produced the largest and heaviest ginger microrhizomes obtained in our study – 550 mg/L NH4NO3, 4 mg/L BAP, 6 mg/L NAA, and 4 mg/L IBA.
Handling Editor
Marzena Parzymies; University of Life Sciences in Lublin, Poland; https://orcid.org/0000-0002-4835-3804
Authors’ Contributions
NHA: conductor of experiments, data analysis, and manuscript writing; TTMC, HTHN, NTMN, TTP: participated in the determination of the effects of sucrose, plant growth regulators, and silver nitrate concentrations on ginger microrhizome induction; LTNT, TVBT, PTTN: participated in the determination of the effects of ammonium nitrate concentration on ginger microrhizome induction and data collection; TTBP: supervisor, experimental designer, editor of the manuscript
