Introduction
Pollen is a major component of biological air pollution. Inhalant allergic diseases are caused due to the presence of such allergens in the air. In various regions of Ukraine, pollinosis affects 20%–30% of the population (Pukhlyk, 2011). Therefore, the data on the quantitative dynamics of allergenic pollen in a particular area form the basis for assessing and predicting the aero-allergenic situation. The concentration, species composition, and regularity of migration of allergenic pollen are closely related to the climate, relief, extent, and the anthropogenic activity in a particular region. Therefore, to establish the regional uniqueness of the palynological spectrum of allergenic plants, aerobiological monitoring should be conducted.
Currently, there is a widely coordinated network of stations in Europe that monitors pollen concentrations of several allergenic plants. Old approaches were inadequate compared to those available today. Spectrum determination of allergenic plants, methods for collecting and processing pollen grains, and researching the allergenic properties of the pollen are being increasingly focused upon, and new approaches to realize the same, such as color electronic atlases, pollen calendars and seasonal pollen distribution maps of various taxa, are being developed (Jäger, 2013).
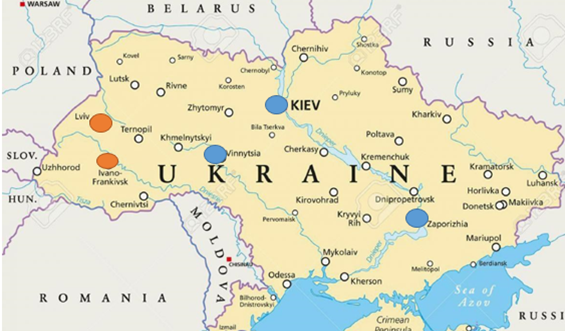
In Ukraine, unlike other European countries, particularly Poland (Myszkowska, 2013; Myszkowska & Majewska, 2014; Piotrowska-Weryszko & Weryszko-Chmielewska, 2014; Weryszko-Chmielewska et al., 2017), aero-palynological studies have not gained popularity and are fragmented. In three cities of Ukraine, i.e., Vinnytsia (Rodinkova, 2015), Zaporizhzhya (Prikhod′ko, 2006, 2008), and Kiev (Turos et al., 2009) (Figure 1), systematic pollen monitoring is conducted using the volumetric method. The cities of Vinnytsia and Zaporizhzhya cooperate with the European Allergy Network (EAN). In Lviv (Voloshchuk, 2014) (since the early 2000s) and Ivano-Frankivsk (Melnichenko & Mylenka, 2014) (since 2013), aeropalynological investigations have been carried out via gravimetry using a self-constructed Durham pollen trap. However, these studies ceased in 2016, and have been renewed in 2020.
Figure 1
Pollen monitoring points in Ukraine. Orange dots indicate locations where the gravimetric method was used. Blue dots represent locations where the volumetric method was used.
Till 2013, not any aeropalynological investigations were conducted in Ivano-Frankivsk. Therefore, our goal was to investigate the aeropalynological spectrum and dynamics of allergenic pollen in the atmospheric air of the city, and thereby determine which plant pollen, and in which time periods, dominate the city air and, cause allergic reactions in sensitized city residents.
Material and Methods
Surveys were conducted during 2013–2015 in Ivano-Frankivsk City (geographical coordinates: 48°55′ N, 24°42′ E, at an altitude of 260 m). The city is located on the Pokut plain in the southwest of Ukraine between the Bystritsa Nadvirnyanska and Bystritsa Solotvynska. The climate of Ivano-Frankivsk is temperate continental. The average temperature in July is 17−19 °С and −5 °C in January. The average humidity is 68%–70%, and the average annual rainfall is 600–700 mm. From a landscape perspective, the city is considered an urbanized territorial complex. This is a part of the natural landscape heavily transformed by buildings, communication infrastructures, and other urban elements. The primary air pollutant in the urban ecosystem of Ivano-Frankivsk is road transport, which accounts for 83% of the total pollution of atmospheric air. The potential natural vegetation of the Ivano-Frankivsk region can be defined as the deciduous forest community type. There are several large park zones with remnants of natural vegetation within the city, and a mosaic of forests and farmlands forms the environs of Ivano-Frankivsk.
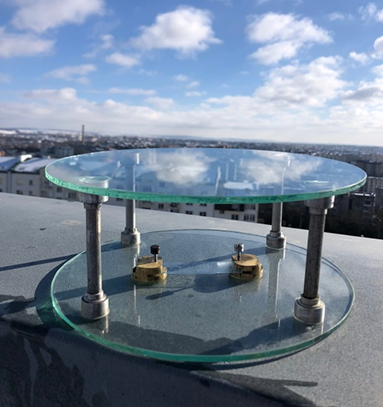
The gravimetric method was used for pollen collection using a Durham’s dust trap that was installed at a height of 24 m from the ground (Figure 2). Glycerin-lubricated slides were replaced daily from early February to mid-October. The pollen grains were counted using an Olympus CX-300 light microscope (×400 magnification) by continuous vertical transects (the analyzed area of the glass comprised 11.52 cm2). A special factor was used for calculations to compare the data obtained by gravimetry to those obtained using the volumetric method. Pollen concentration was expressed as the daily average number of pollen grains in 1 m3 of air per 24 hr (Bassett et al., 1978).
Monitoring was conducted from the beginning of February to the middle of October, in 2013, 2014, and 2015. Pollen grains were delegated to the taxonomic unit “genus” and in some cases “families” (such as Urticaceae, Chenopodiaceae, and Poaceae). Damaged and unidentified pollen grains were classified as “other.” All calculations and graphical interpretations of the study results were conducted using MS Excel (2010).
Results
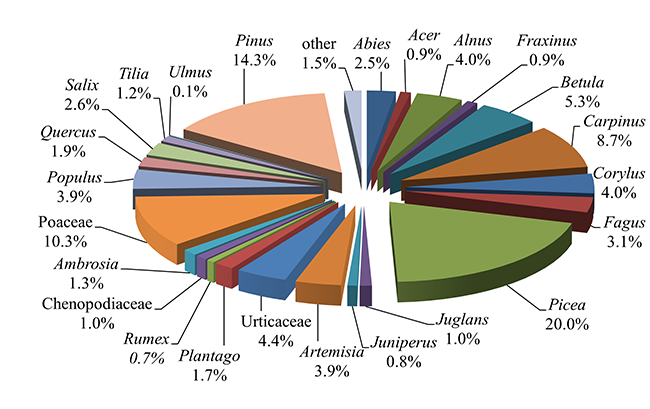
Our research showed that the pollen of 24 taxa (17 taxa of woody plants and seven taxa of herbaceous plants) dominated the aeropalynological spectrum in the atmosphere of Ivano-Frankivsk. The observation results showed differences in the pollen incidence in the city air during 2013–2015. For example, in 2013, among the aeropalynological species, the pollen grains of Picea (20%), Pinus (14.3%), Poaceae (10.3%), and Carpinus (8.7%) dominated. The next taxa in terms of pollen content were Betula (5.3%), Urticaceae (4.4%), Corylus (4%), Alnus (4%), Populus (3.9%), Artemisia (3.9%), Fagus (3.1%), Salix (2.6%), Abies (2.5%), Quercus (1.9%), Plantago (1.7%), Ambrosia (1.3%), and Tilia (1.2%). A low pollen percentage, ranging from 0.1% to 1%, in the aeropalynological spectrum was represented by Chenopodiaceae, Juglans, Fraxinus, Acer, Juniperus, Rumex, and Ulmus (Figure 3).
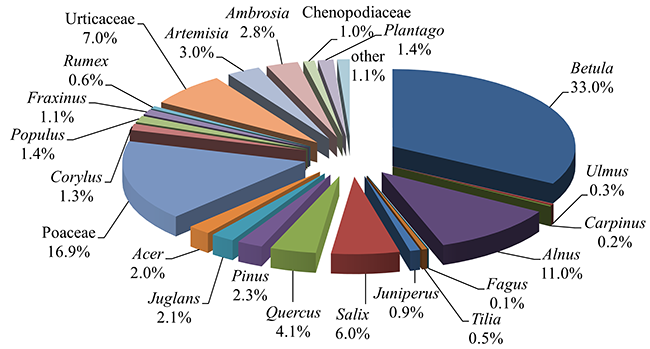
The highest concentrations of Betula, Poaceae, and Alnus pollen were recorded in 2014; they made up 33%, 16.9%, and 11%, respectively, of the annual amount of the registered pollen. In terms of pollen productivity, the following taxa were identified: Urticaceae (7%), Salix (6%), Quercus (4.1%), Artemisia (3%), Ambrosia (2.8%), Pinus (2.3%), Juglans (2.1%), Acer (2%), Populus (1.4%), Plantago (1.4%), Corylus (1.3%), and Fraxinus (1.1%). The pollen contribution of the remaining taxa (Ulmus, Carpinus, Fagus, Juniperus, Rumex, Chenopodiaceae, and Tilia) did not exceed 1% (Figure 4).
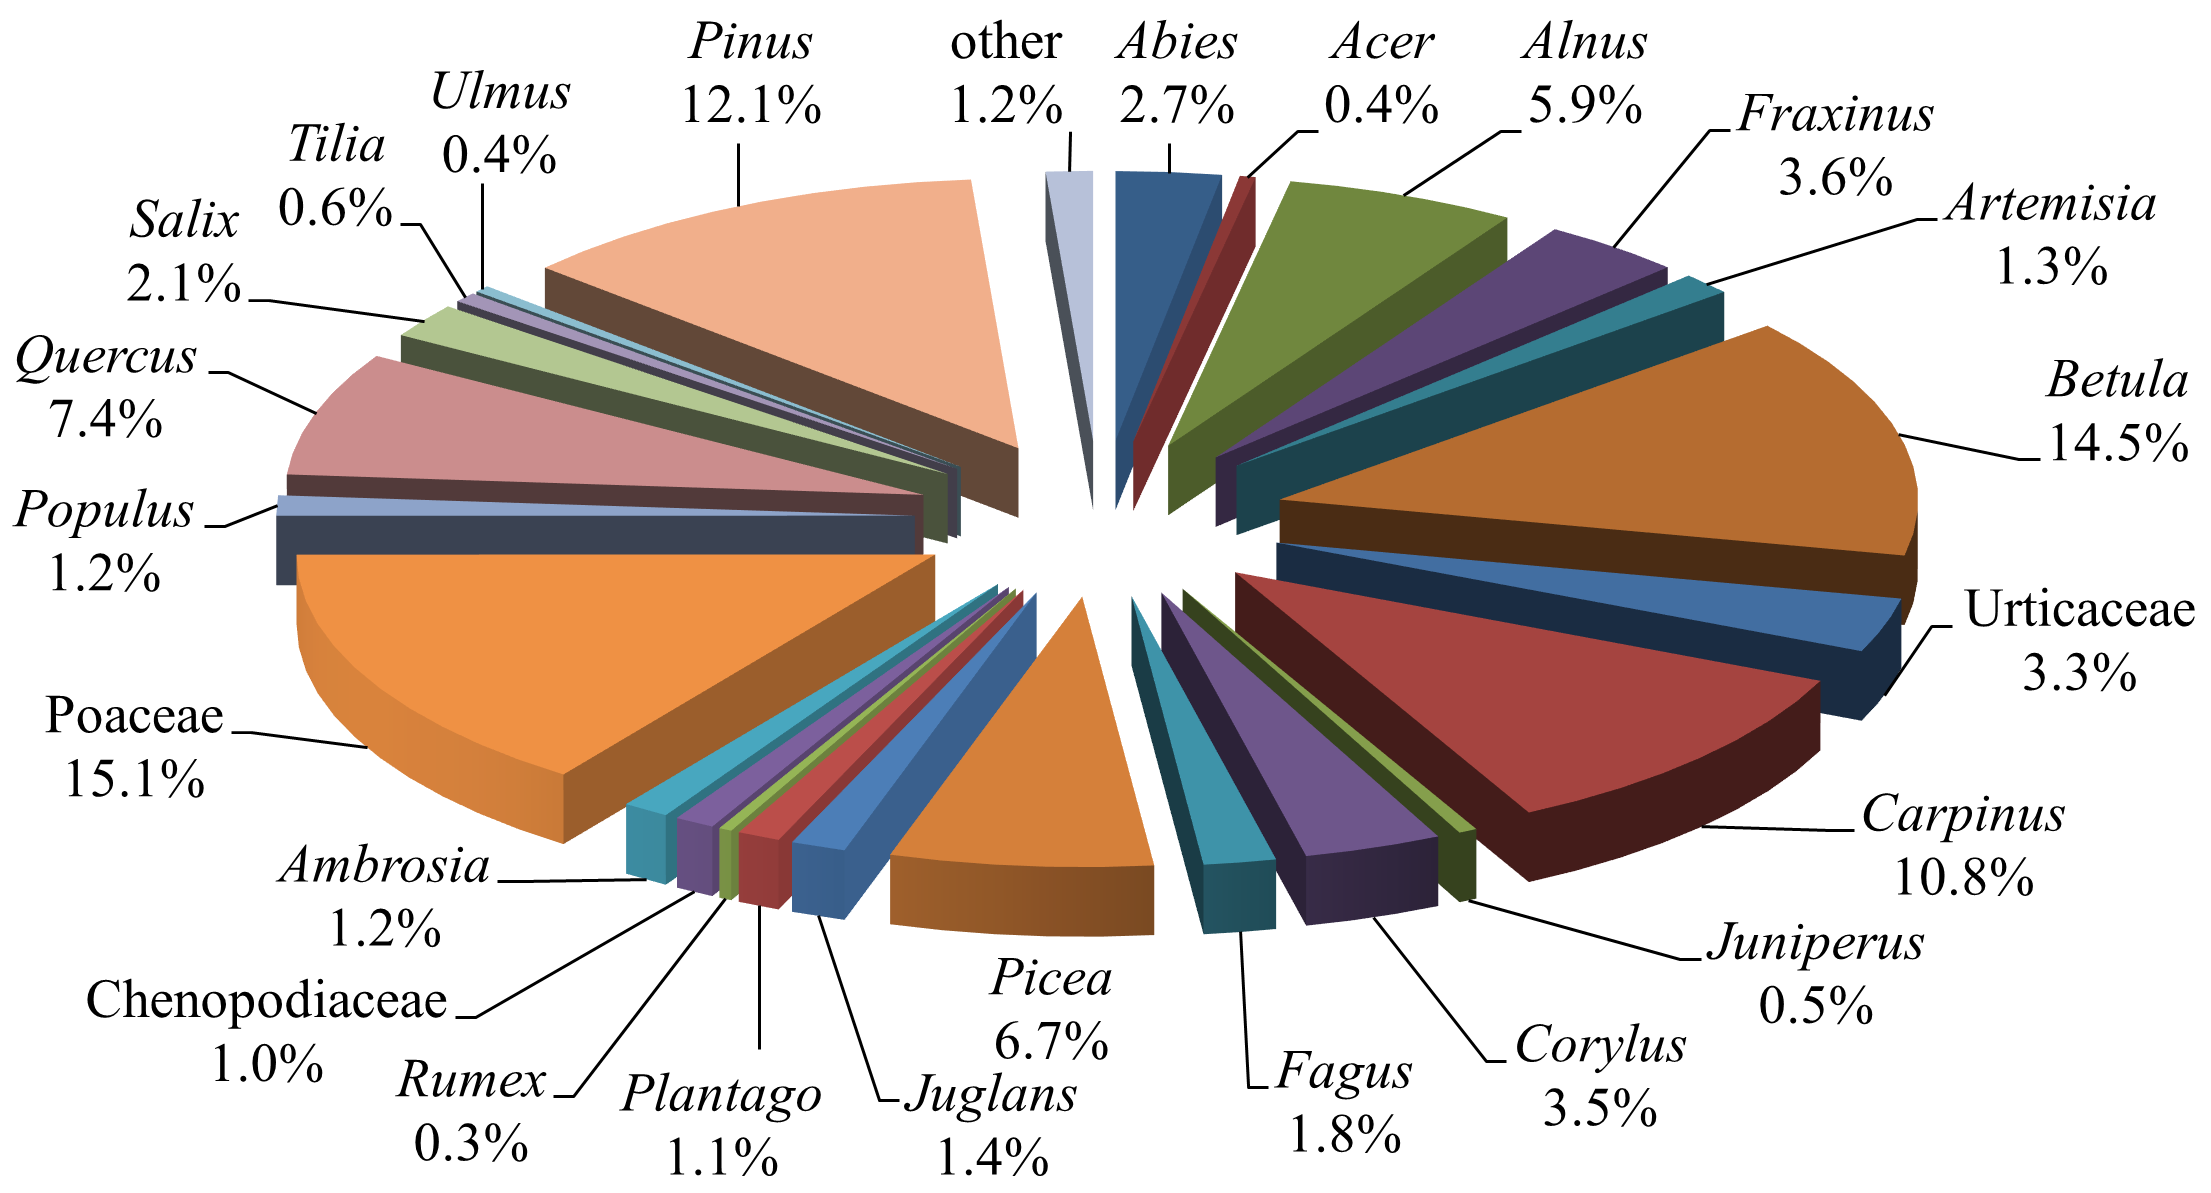
In 2015, the largest contributions to the qualitative composition of pollen deposition in the city were made by the members of the following taxa: Poaceae (15.1%), Betula (14.5%), Pinus (12.1%), Carpinus (10.8%), Quercus (7.4%), Picea (6.7%), and Alnus (5.9%); the pollen contributions from Fraxinus (3.6%), Corylus (3.5%), Abies (2.7%), Salix (2.1%), Fagus (1.8%), Juglans (1.4%), Artemisia (1.3%), Ambrosia (1.2%), Populus (1.2%), and Plantago (1.1%) were relatively less; and Tilia (0.6%), Ulmus (0.4%), Acer (0.4%), Juniperus (0.5%), and Rumex (0.3%) (Figure 5), each contributed to less than 1% of the pollen grains.
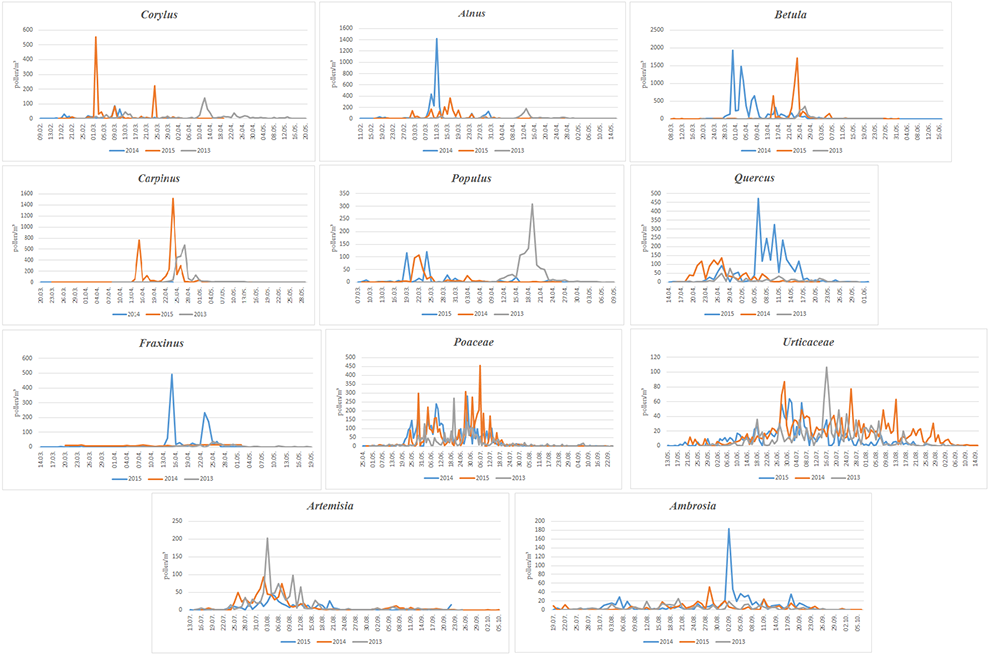
In Ivano-Frankivsk City, the pollen season begins in the second week of February by pollen release in Corylus. The peak air pollen concentrations in 2014 and 2015 occurred in the first week of March and, in 2013, in the second week of April. The peak delay in 2013 was due to low temperature conditions at the beginning of pollination, and in March, a weather anomaly occurred, wherein the temperature decreased to −10 °C (with heavy snow as well), which elongated the pollination duration of Corylus individuals for an average of 2 weeks (until mid-May) (Figure 6).
In 2014 and 2015, as with Corylus, the Alnus pollen season began in the second week of February, but, in 2013, it started in the first week of March. The peak pollen concentrations occurred in the second week of March, and only in 2013, in the second week of April. In 2013, the pollen season of this taxon was observed in the second week of May; in 2014, in the second week of April; and in 2015, in the third week of April. The low average daily temperatures before and at the beginning of pollination in 2013 caused a late pollination peak with a lower pollen concentration.
The pollination of the Betula individuals in 2014 and 2015 was observed in the second to third week of March. In March 2013, low temperatures at the beginning of pollination and heavy snowfall led to a later beginning of pollen season and low plant pollen concentrations. Instead, high temperatures in 2014 accelerated the Betula pollen season. As a result, pollen peaks were recorded early, with very high pollen concentrations (1,934 pollen grains/m3) of pollen being recorded as early as the end of March. The pollination of members of the Betula genus continued throughout the study until the end of May.
In 2015 and 2014, the Fraxinus pollen season began in the second and third weeks of March, respectively. In 2013, it began in the first week of April due to the above-mentioned weather conditions. The peak pollen concentrations occurred in the second and third weeks of April, and the end of the season was observed in the third week of May (2013), the third week of April (2014), and the first week of May (2015).
The beginning of the Populus pollen season was observed in the first week of April (2013) and the second week of March (2014). In 2013, the later start of the pollen season and peak pollen concentrations (in the second week of April) were due to the abnormal weather conditions in the second half of March. The end of the pollen season was observed in the first week of May in 2013, and in the third week of March in 2014. In 2013 and 2014, the length of the pollen season was the same (4 weeks).
In 2013, the Carpinus pollen season began in the second week of April, and in the third week of March 2015, which is also explained by the weather regime of the second half of March. The pollen concentration in both years peaked in the third week of April. In 2013, the end of the pollen season was observed in the third week, and in the first week of May in 2015. The duration of the pollen season in both years was 5 weeks. In 2014, Carpinus pollen grains were only occasionally recorded in the air.
In 2014 and 2015, the beginning of the Salix pollen season was observed in the third week of March. In 2014, the pollen concentration peak was ascertained to be in the second week of April, and in 2015, in the second-third weeks of April. The end of the season was recorded in the second–third weeks of May.
The pollen season of the Quercus genus in all three years of the study began in the second week of April. The highest concentrations were observed in the third week of April (2013 and 2014) and the first week of May (2015). In 2013 and 2014, the end of the pollen season was recorded to be in the third week of May, and in 2015, in the second week of May.
In 2014 and 2015, the Poaceae pollen season began in the third week of April, and, in 2013, in the first week of May. The maximum pollen concentration was observed in the third–fourth weeks of June in 2013 and 2014, and in 2015 in the first week of July. The Poaceae pollen season was the longest (lasting until the second week of September). The presence of pollen in the air of the city was long due to rich species diversity.
The beginning of the Urticaceae pollen season was observed in the second or third week of May. Increased pollen concentrations were observed in the second week of July (2013), the third week of June (2014), and the first week of July (2015). The end of the season varied from the third week of August (2015) to the second week of September (2013 and 2014).
The Artemisia pollen season began in the second (2013 and 2014) and the third week of July (2015). In all the study years, the peak concentration was reported in the first week of August, while the end of the season was recorded in the second week of September.
The Ambrosia pollen season started in the third week of July. The highest concentrations were observed in the second week of August 2013, in the first week of September 2014, and in the third week of August 2015. The end of the season was observed in the third week of September (Figure 6).
Discussion
The list of major taxa that formed the city’s pollen spectrum during 2013–2015 remained unchanged, but the pollen share of individual taxa varied greatly. Thus, in 2013 the share of Piceae genus comprised 20%, in 2014 it was lower than 1%, and in 2015 it was 6.7%. In 2013, the share of Carpinus pollen varied greatly. In 2014, single pollen grains of Carpinus were recorded in the air of the city of Ivano-Frankivsk, which comprised 0.2% of the annual pollen spectrum, and in 2015, their share was 10.8%.
This is explained by the endogenous plant features. The alternation of vegetative and reproductive phases in various plants has been described in literature (e.g., Severova, 2004). The production and release of large amounts of pollen require the expenditure of copious amounts of energy on the development of plant vegetative/generative organs; therefore, inflorescence development reduces in the following year. Hence, the year with high pollen concentration comes after the year with low pollen content. According to the literature, many temperate zone woody plants are characterized by periodic alternation of “productive” and “unproductive” seasons. The 2-year pollen production cycle was described for Betula by Severova (2004).
The research results are consistent with the results of aeropalynological monitoring in Vinnytsia (Central Ukraine). According to the pollen studies results, the airborne pollen spectrum of Vinnytsia and Ivano-Frankivsk are formed by Betula, Quercus, Acer, Fraxinus, Ulmus, Pinus, Juglans, Carpinus, Alnus, Populus, Urticaceae, Poaceae, Artemisia, and Ambrosia (Rodinkova, 2013).
Unlike the city of Ivano-Frankivsk, in the south of Ukraine (Zaporizhzhya City), the main component of the annual airborne pollen spectrum is grass pollen dominated by allergenic ragweed pollen. The results of the studies conducted in Zaporizhzhya (Prikhod′ko, 2006, 2008) indicate that the Ambrosia pollen dominates in the air with the percentage share of 45%, whereas in Ivano-Frankivsk, it was maximum at 2.8%.
The presence of pollen from the Corylus and Alnus plants in the air of Ivano-Frankivsk in February is consistent with the results of aeropalynological studies in Poland (Sosnówka and Cracow) (Myszkowska, 2013) and in Lviv (Kalinovych et al., 2016).
Birch pollen is considered to be the major air allergen in Central and Northern Europe (Denisow & Weryszko-Chmielewska, 2015; Hajkova et al. 2016; Myszkowska, 2013). The pollen season of this plant partially coincides with ours in some cities of Poland (Lublin, Rzeszów) (Piotrowska-Weryszko & Weryszko-Chmielewska, 2014; Puc et al, 2015) and in the cities of Lviv (Voloshchuk, 2014) and Vinnytsya (Rodinkova, 2013).
The beginning and the end of pollen release in individuals of the Poaceae family in Ivano-Frankivsk coincided with those in Lviv, but the maximum concentrations were 5–6 times higher (Voloshchuk, 2014).
The pollen season of the Ambrosia plants in Ivano-Frankivsk and Lviv coincided, but pollen concentrations were higher (maximum 183 pollen grains/m3 in Ivano-Frankivsk, and in Lviv in different years of the study did not exceed 12 pollen grains/m3) (Voloshchuk, 2014). Instead, in the southern and eastern cities of Ukraine, the contribution of pollen grains of Ambrosia to the airborne pollen spectrum was over 50%. The maximum pollen concentrations of this plant in Dnipropetrivsk was 1,491 pollen grains/m3 (Rodinkova, 2013), and in Zaporizhzhya it was 1,950 pollen grains/m3 (Maleeva & Prikhod′ko, 2016).
Conclusions
The aeropalynological monitoring results in Ivano-Frankivsk City indicate that there are two pronounced pollen concentration peaks. The first wave occurs in the spring and is attributed to the more intense pollen season of the tree species, while the second wave occurs in the summer–fall, and is attributed to herbaceous plants.
In 2013 and 2015, the ratio tree pollen vs. herbaceous pollen was similar (in 2013 – 76:24 and in 2015 – 67:33). The high occurrence of the tree pollen grains in the ambient air of Ivano-Frankivsk City is due to its geographical location in the forest-steppe zone of Ukraine.
Pollen release of allergenic plants continued from the second week of February until the beginning of October. From an allergological perspective, in Ivano-Frankivsk April is the most unfavorable period, when high concentrations of allergenic pollen of Betula, Fraxinus, and Carpinus were observed. Among the herbs, the highest concentrations were recorded for Poaceae. High pollen concentrations occurred from the second decade of May to mid-July, except for days with high air humidity and precipitation. In the second half of August and early September, high concentrations of allergenic pollen of the Ambrosia were recorded. The pollen of the above-mentioned herbaceous plants is characterized by a high allergenic potential and create a risk of pollinosis among susceptible population groups. Therefore, it is necessary to monitor the airborne pollen concentrations and carry out forecasts considering meteorological factors and regularities of allergenic plant flowering.
It is extremely important for Ukraine to create a national aeropalynological monitoring network, with further inclusion of observation points with the EAN. It will significantly supplement and increase the informational content of the latter and will create favorable conditions for further developments in this scientific field in Ukraine.
Handling Editor
Idalia Kasprzyk; University of Rzeszów, Poland; https://orcid.org/0000-0002-9392-678X
Authors’ Contributions
GM conducted the study, formulated the main objectives of the study and research design, conducted material collection, meteorological data processing, as well as data analysis and interpretation, prepared the figures and wrote the manuscript; GM and NP conducted the microscope pollen analysis, pollen data analysis, statistical analyses, diagram plotting, and meteorological data processing; ММ and NR conducted material collection and reviewed the final text
